REVIEW 3 major objections 4 minor 52 references
Spectral Properties Of Populations Behind The Coherence In Spitzer Near-Infrared And Chandra X-Ray Backgrounds
T0 review · 3 major / 4 minor · reviewed 2026-08-14 · deepseek-v4-flash
Pith's one-line read The unresolved infrared and X-ray backgrounds carry a 5-sigma cross-power signal whose spectrum favors accreting compact objects.
desk verdict Solid multi-field measurement of the CIB-CXB cross-power; the spectral 'rule out' of absorbed AGN is less secure than the prose suggests because the soft band that drives the hardness ratio is contaminated. read the letter →
The pith
A machine-rendered reading of the paper's core claim, the machinery that carries it, and where it could break.
The reading
What carries the argument
The load-bearing quantity is the CIB-CXB cross-power spectrum $P_{\rm IR\times X}(q)=\langle \Delta_{\rm IR}(q)\Delta_X^*(q)\rangle$, which measures how strongly the infrared and X-ray fluctuation maps rise and fall together at each angular scale. Averaged over scales $2\pi/q>20''$, this quantity exceeds shot noise and known foregrounds, so the paper reads its amplitude $\langle P_{\rm IR,X}\rangle$ as the stacked X-ray spectrum of the unresolved sources producing both fluctuations. The argument is carried by comparing that spectrum, together with X-ray hardness ratios built from the mean cross-powers, against single-component spectral models: absorbed and unabsorbed power-law AGN, hot plasma, Compton-thick reflection, and direct-collapse black hole spectral templates.
What would settle it
Deep, targeted X-ray observations that resolve the [1-2] keV excess into discrete sources would settle the claim: if those sources turn out to be mostly low-redshift heavily absorbed AGN or hot cluster gas, the paper's spectral interpretation fails; if they are faint, unobscured or high-redshift accreting objects with power-law spectra, it holds. A second decisive check is whether the soft-band excess disappears when Galactic cirrus is modeled out.
Extended reading notes
Core claim
The central discovery is that the source-subtracted fluctuations of the Spitzer near-infrared background and the Chandra X-ray background are coherent on scales larger than 20 arcseconds, with an overall detection around $5\sigma$ and a $5.2\sigma$ signal between the 3.6/4.5 micron bands and the [1-2] keV band. After masking resolved X-ray sources and subtracting the stowed particle background, the remaining cross-power has an X-ray spectral shape that follows a power law $\propto E^{-\Gamma}$ with $\Gamma\sim 2$--$3$, favoring populations of accreting compact objects such as local unabsorbed AGN or high-redshift absorbed AGN and direct-collapse black holes, the massive black hole seeds that form in pristine high-redshift gas. The paper explicitly rules out low-redshift heavily absorbed AGN and hot gas with $kT>3$ keV as dominant contributors, and notes a soft-band excess that might indicate a Galactic thermal component correlated with residual cirrus. It does not claim to identify the exact source population, because four broad X-ray bands cannot separate the models.
Load-bearing premise
The residual infrared and X-ray fluctuations left after masking detected sources and subtracting the stowed particle background are dominated by the same unresolved astrophysical population, so the cross-power amplitude can be read as that population's average X-ray spectrum.
Editorial extensions
If this is right
- Any complete model of the cosmic infrared background excess must include a population whose X-ray emission is powered by accretion, not just star-forming galaxies or hot gas.
- Low-redshift heavily absorbed AGN and hot gas above roughly 3 keV are disfavored, so future searches for the source population should concentrate on steep, weakly absorbed power laws and high-redshift absorbed sources.
- The strongest signal appears in the [1-2] keV band, where Chandra's effective area peaks; deeper or wider observations in that band will most efficiently sharpen the spectral constraints.
- The soft-band excess over the power law means a Galactic thermal component may correlate with residual Galactic cirrus, so separating this foreground is required before the extragalactic interpretation is clean.
Reading between the lines
- A testable extension the paper leaves implicit: if the correlated sources are accreting black holes, the cross-power spectral energy distribution should harden toward higher redshift, so splitting the [1-2] keV band into finer energy bins or cross-correlating with redshift-sensitive photometry could test this without resolving individual sources.
- The same cross-power method could be applied to future wider and deeper near-infrared and X-ray surveys to push the measurement to larger angular scales, where the coherence between the two backgrounds should either approach unity or reveal a second, differently shaped component.
- If the soft-band excess really tracks Galactic cirrus, then cross-correlating the [0.5-1] keV residual with dust-emission maps should show a spatial correlation that is absent in the [1-2] keV band, providing a direct way to separate foreground from the extragalactic signal.
Signed reviews
Editorial analysis
A structured set of objections, weighed in public.
Referee Report
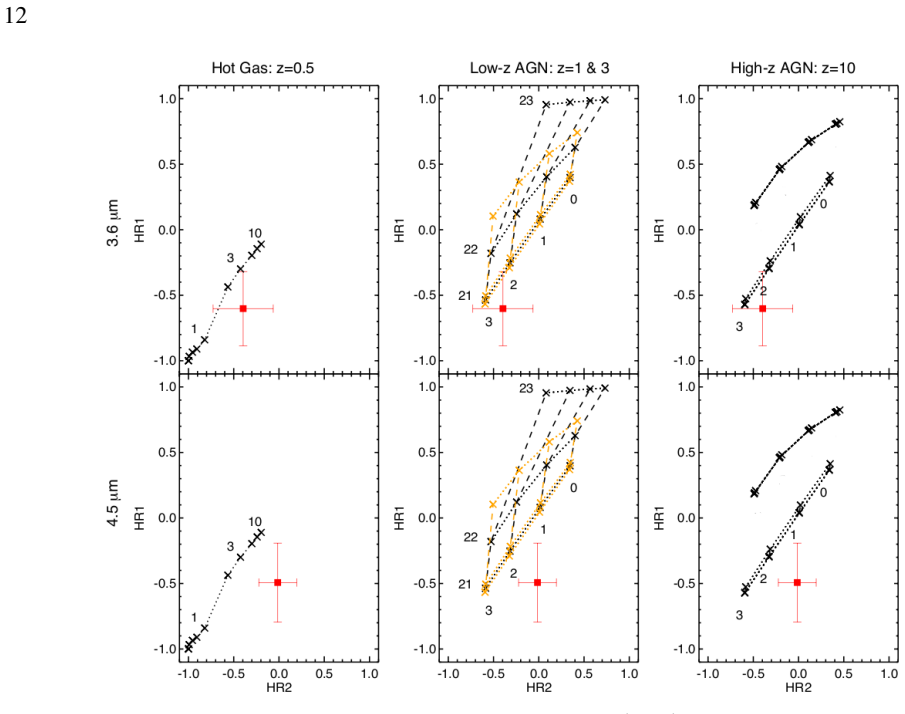
Summary. The manuscript combines Spitzer/IRAC 3.6 and 4.5 micron maps with Chandra data in five deep fields (UDS, HDFN, EGS, CDFS, COSMOS) to measure cross-power spectra between infrared background fluctuations and X-ray background fluctuations in four bands ([0.5-1], [1-2], [2-4], [4-7] keV). After masking resolved sources, subtracting stowed-background cross-powers, and averaging angular scales larger than 20 arcsec, the authors report a roughly 5 sigma correlation in the [1-2] keV band (5.2 sigma for 4.5 micron, 4.8 for 3.6 micron) and lower-significance correlations in the other bands. They convert the mean cross-powers into hardness ratios HR1-HR3 and compare them with model grids for hot gas, absorbed and unabsorbed AGNs at low and high redshift, Compton-thick PEXRAV models, and DCBH SEDs from Pacucci et al. (2015). They conclude that the X-ray SED of the correlated population is consistent with accretion-powered power-law emission, that low-z absorbed AGNs and kT greater than 3 keV gas are ruled out, and that high-z absorbed AGNs or DCBHs could match the data but cannot be distinguished from each other.
Significance. An extended multi-field CIB-CXB cross-power measurement is valuable in itself, and the paper includes appropriate controls: stowed data are reprojected and subtracted, A/B maps are used to characterize instrumental noise, and the model SEDs are external and are normalized only to the 1-2 keV point rather than fitted to produce the central detection. If the spectral constraints survive a careful treatment of the soft-band foreground, this would be a useful first multi-band SED of the correlated background populations and a step toward distinguishing accreting compact-object scenarios. The central caveat is that the exclusions are not yet quantitative; the data quality supports the detection but not the current 'rule out' language.
major comments (3)
- [§4.2, Eqs. (8)-(9), Table 2, §4.4] The central exclusion of low-z absorbed AGNs relies on HR1, which combines the [0.5-1] keV and [1-2] keV cross-powers. The paper itself reports an excess at [0.5-1] keV that "cannot be fully accounted for by any of the models" and suggests a thermal Galactic component correlated with residual cirrus. Since the stacked 3.6 micron [0.5-1] amplitude is about four times the [1-2] amplitude (10.45 versus 2.60 in Table 2), removing even a few units of this foreground would move HR1 from about -0.6 toward the harder values occupied by the NH = 10^22-10^23 cm^-2 absorbed-AGN tracks in Figure 3. The authors need to quantify how much of the soft-band cross-power must be attributed to the foreground before the absorbed-AGN exclusion disappears; without such a test, the rule-out statement is not supported by the data.
- [§4.3, §4.4, Fig. 4] Section 4.3 states that a quantitative statistical interpretation of the SED is not possible and that the comparison is qualitative rather than quantitative, yet Section 4.4 opens with "we rule out the possibilities of low-z absorbed AGN and hot kT > 3 keV gas." No goodness-of-fit statistic, confidence contour, or model-selection criterion is provided. With only four broad bands and hardness-ratio uncertainties of about 0.3, the word "rule out" should either be replaced by a quantitative exclusion significance computed over the model grids or softened to "disfavored."
- [§2.1, §4.1, Fig. 2] The stowed-background subtraction removes the particle background as measured out of the focal plane, but it does not automatically remove celestial soft X-ray foregrounds such as solar wind charge exchange or Galactic thermal emission. Given that the abstract and Section 4.4 admit a possible thermal Galactic component correlating with cirrus, the soft-band cross-power should be treated as an upper limit on the astrophysical population signal in the [0.5-1] keV band, and the spectral conclusions should be recomputed under that interpretation. This is technically not a circularity issue, but it is a foreground-control issue that directly affects the quoted hardness ratios.
minor comments (4)
- [§2.1] There is a typo in "tradoff" in the paragraph describing the choice of the four X-ray bands; it should read "tradeoff."
- [§4.2] The phrase "with with 2 types of models" in the description of the high-z AGN models contains a duplicated "with" and should be corrected.
- [Fig. 3] The model grid labels in the color-color plot are dense and may be difficult to read at publication size; a table listing the model parameters (photon index, column density, redshift, and model normalization choices) would improve reproducibility.
- [Table 2] The units of the cross-power amplitudes, 10^-11 photon s^-1 cm^-2 nW m^-2 sr^-1, are hard to parse in their present form; a clearer decomposition or a note in the caption explaining the combination of X-ray flux units and CIB surface-brightness units would help.
Circularity Check
No significant circularity: the cross-power detection is a direct measurement, and external model SEDs are normalized to one data point only for display.
full rationale
The central detection is a measured quantity: Eq. (5) defines P1×2(q)=⟨Δ1(q)Δ2*(q)⟩ from the actual IR and X-ray maps, and Table 2 reports the stacked amplitudes above 20''. No model parameter is fitted to produce these amplitudes. The model SEDs in Figure 4 are external—XSPEC models (WABS*APEC, WABS*ZWABS*ZPO, PEXRAV) and Pacucci et al. (2015) radiation-hydrodynamic DCBH spectra—and the paper explicitly states that 'the modeled spectra in Fig. 4 are rescaled to match the mean levels of the measurements at 1-2 keV' and that 'a quantitative statistical interpretation of the SED is not possible with the current data quality.' The hardness-ratio exclusions in Section 4.2 compare measured ratios to external model grids, not to quantities derived from the same fitted parameters. The admitted soft-band excess ('an indication of an excess at the softest [0.5-1] keV band') is a data-driven caveat that weakens spectral conclusions rather than being necessary to construct them. Self-citations to prior work (Li et al. 2018; Cappelluti et al. 2013, 2017; Pacucci et al. 2015) are used for data-reduction conventions and possible model templates, but the central claim does not reduce to those citations: the paper concludes that multiple populations can explain the data and states 'we cannot exclude that the excess fluctuations are produced by more than one population.' No equation or fitted parameter is equivalent by construction to the reported detection, so there is no circularity.
Assumptions & free parameters
free parameters (1)
- Model SED normalization =
rescaled to match mean level at 1-2 keV
assumptions (5)
- domain assumption The residual fluctuations above 20'' are dominated by the same source population(s) in the IR and X-ray.
- domain assumption Known foregrounds (stars, cirrus, remaining galaxies) are significantly weaker than the signal above 20''.
- domain assumption The A-B split maps and the stowed X-ray observations provide valid noise and particle-background estimates.
- domain assumption Source masks remove >90% of detected source brightness, leaving fluctuations dominated by unresolved populations.
- standard math The Fourier power spectrum formalism (equations 3-6) with the stated error model is valid for these maps.
Cite this review
Pith. "Pith review of Spectral Properties Of Populations Behind The Coherence In Spitzer Near-Infrared And Chandra X-Ray Backgrounds." pith.science (2026). https://pith.science/paper/P4O75LST
@misc{pith2026190802293,
  author       = {Pith},
  title        = {Pith review of: Spectral Properties Of Populations Behind The Coherence In Spitzer Near-Infrared And Chandra X-Ray Backgrounds},
  year         = {2026},
  howpublished = {\url{https://pith.science/paper/P4O75LST}},
  note         = {Machine review of arXiv:1908.02293}
}
abstract
We study the coherence of the near-infrared and X-ray background fluctuations and the X-ray spectral properties of the sources producing it. We use data from multiple Spitzer and Chandra surveys, including the UDS/SXDF surveys, the Hubble Deep Field North, the EGS/AEGIS field, the Chandra Deep Field South and the COSMOS surveys, comprising $\sim$2275 Spitzer/IRAC hours and $\sim$~16 Ms of Chandra data collected over a total area of $\sim$~1~deg$^2$. We report an overall $\sim$5$\sigma$ detection of a cross-power signal on large angular scales $>$ 20$''$ between the 3.6 and 4.5\mum\ and the X-ray bands, with the IR vs [1-2] keV signal detected at 5.2$\sigma$. The [0.5-1] and [2-4] keV bands are correlated with the infrared wavelengths at a $\sim$1$-$3$\sigma$ significance level. The hardest X-ray band ([4-7] keV) alone is not significantly correlated with any infrared wavelengths due to poor photon and sampling statistics. We study the X-ray SED of the cross-power signal. We find that its shape is consistent with a variety of source populations of accreting compact objects, such as local unabsorbed AGNs or high-z absorbed sources. We cannot exclude that the excess fluctuations are produced by more than one population. Because of poor statistics, the current relatively broad photometric bands employed here do not allow distinguishing the exact nature of these compact objects or if a fraction of the fluctuations have instead a local origin.
Figures


Figures from the paper (1 more)

Reference graph
Works this paper leans on
-
[1]
- [1] #1 = = ^ ^ ^ .\!\!^ d .\!\!^ h .\!\!^ m .\!\!^ s .\!\!^ @mss
thebibliography [1] 20pt to REFERENCES 6pt =0pt 10pt plus 3pt =0pt =0pt =1pt plus 1pt =0pt =0pt -12pt =13pt plus 1pt =20pt =13pt plus 1pt \@M =10000 =-1.0em =0pt =0pt 0pt =0pt =1.0em @enumiv\@empty 10000 10000 `\.\@m \@noitemerr \@latex@warning Empty `thebibliography' environment \@ifnextchar \@reference \@latexerr Missing key on reference command Each re...
work page 2016
-
[2]
- [1] #1 = = ^ ^ ^ .\!\!^ d .\!\!^ h .\!\!^ m .\!\!^ s .\!\!^ @mss
thebibliography [1] 20pt to REFERENCES 6pt =0pt 10pt plus 3pt =0pt =0pt =1pt plus 1pt =0pt =0pt -12pt =13pt plus 1pt =20pt =13pt plus 1pt \@M =10000 =-1.0em =0pt =0pt 0pt =0pt =1.0em @enumiv\@empty 10000 10000 `\.\@m \@noitemerr \@latex@warning Empty `thebibliography' environment \@ifnextchar \@reference \@latexerr Missing key on reference command Each re...
2017
-
[3]
, " * write output.state after.block = add.period write newline
ENTRY address author booktitle chapter edition editor howpublished institution journal key month note number organization pages publisher school series title type volume year label extra.label sort.label short.list INTEGERS output.state before.all mid.sentence after.sentence after.block FUNCTION init.state.consts #0 'before.all := #1 'mid.sentence := #2 '...
-
[4]
write newline
" write newline "" before.all 'output.state := FUNCTION n.dashify 't := "" t empty not t #1 #1 substring "-" = t #1 #2 substring "--" = not "--" * t #2 global.max substring 't := t #1 #1 substring "-" = "-" * t #2 global.max substring 't := while if t #1 #1 substring * t #2 global.max substring 't := if while FUNCTION word.in bbl.in " " * FUNCTION format....
-
[5]
Alexander , D. M., Bauer , F. E., Brandt , W. N., et al. 2003, , 126, 539
work page 2003
-
[6]
G., Kashlinsky , A., Moseley , S
Arendt , R. G., Kashlinsky , A., Moseley , S. H., & Mather , J. 2010, , 186, 10
work page 2010
-
[7]
Arnaud , K. A. 1996, in Astronomical Society of the Pacific Conference Series, Vol. 101, Astronomical Data Analysis Software and Systems V, ed. G. H. Jacoby & J. Barnes , 17
1996
- [8]
Show all 52 references
-
[9]
2008, , 479, 283
Brunner , H., Cappelluti , N., Hasinger , G., et al. 2008, , 479, 283
2008
-
[10]
2004, , 416, 901
Caccianiga , A., Severgnini , P., Braito , V., et al. 2004, , 416, 901
2004
-
[11]
G., et al
Cappelluti , N., Kashlinsky , A., Arendt , R. G., et al. 2013, , 769, 68
2013
-
[12]
2017, , 847, L11
Cappelluti , N., Arendt , R., Kashlinsky , A., et al. 2017, , 847, L11
2017
-
[13]
2018, , 854, 179
Cappelluti , N., Bulbul , E., Foster , A., et al. 2018, , 854, 179
2018
-
[14]
2016, , 819, 62
Civano , F., Marchesi , S., Comastri , A., et al. 2016, , 819, 62
2016
-
[15]
J., Keatin , B., Lange , A
Cooray , A., Bock , J. J., Keatin , B., Lange , A. E., & Matsumoto , T. 2004, , 606, 611
2004
-
[16]
2012, , 490, 514
Cooray , A., Smidt , J., de Bernardis , F., et al. 2012, , 490, 514
2012
-
[17]
2003, in The Mass of Galaxies at Low and High Redshift, ed
Dickinson , M., Giavalisco , M., & GOODS Team . 2003, in The Mass of Galaxies at Low and High Redshift, ed. R. Bender & A. Renzini , 324
2003
-
[18]
2013, , 765, 117
Erfanianfar , G., Finoguenov , A., Tanaka , M., et al. 2013, , 765, 117
2013
-
[19]
2014, , 445, 2725
Erfanianfar , G., Popesso , P., Finoguenov , A., et al. 2014, , 445, 2725
2014
-
[20]
G., & SEDS Team
Fazio , G. G., & SEDS Team . 2011, in Astronomical Society of the Pacific Conference Series, Vol. 446, Galaxy Evolution: Infrared to Millimeter Wavelength Perspective, ed. W. Wang , J. Lu , Z. Luo , Z. Yang , H. Hua , & Z. Chen , 347
2011
-
[21]
2014, , 443, 2410
Ferrara , A., Salvadori , S., Yue , B., & Schleicher , D. 2014, , 443, 2410
2014
-
[22]
G., Tanaka , M., et al
Finoguenov , A., Watson , M. G., Tanaka , M., et al. 2010, , 403, 2063
2010
-
[23]
2015, , 576, A130
Finoguenov , A., Tanaka , M., Cooper , M., et al. 2015, , 576, A130
2015
-
[24]
C., Allen , G
Fruscione , A., McDowell , J. C., Allen , G. E., et al. 2006, in , Vol. 6270, Society of Photo-Optical Instrumentation Engineers (SPIE) Conference Series, 62701V
2006
-
[25]
D., Forman , W
Goulding , A. D., Forman , W. R., Hickox , R. C., et al. 2012, , 202, 6
2012
-
[26]
2014, , 785, 38
Helgason , K., Cappelluti , N., Hasinger , G., Kashlinsky , A., & Ricotti , M. 2014, , 785, 38
2014
-
[27]
2012, , 752, 113
Helgason , K., Ricotti , M., & Kashlinsky , A. 2012, , 752, 113
2012
-
[28]
C., & Markevitch , M
Hickox , R. C., & Markevitch , M. 2006, , 645, 95
2006
-
[29]
W., Brandt , W
Just , D. W., Brandt , W. N., Shemmer , O., et al. 2007, , 665, 1004
2007
-
[30]
2016, , 823, L25
Kashlinsky , A. 2016, , 823, L25
2016
-
[31]
P., Mather , J
Kashlinsky , A., Arendt , R., Gardner , J. P., Mather , J. C., & Moseley , S. H. 2004, , 608, 1
2004
-
[32]
G., Ashby , M
Kashlinsky , A., Arendt , R. G., Ashby , M. L. N., et al. 2012, , 753, 63
2012
-
[33]
G., Atrio-Barandela , F., et al
Kashlinsky , A., Arendt , R. G., Atrio-Barandela , F., et al. 2018, Reviews of Modern Physics, 90, 025006
2018
-
[34]
G., Cappelluti , N., et al
Kashlinsky , A., Arendt , R. G., Cappelluti , N., et al. 2019 a , , 871, L6
2019
-
[35]
G., Mather , J., & Moseley , S
Kashlinsky , A., Arendt , R. G., Mather , J., & Moseley , S. H. 2005, , 438, 45
2005
-
[36]
2007, , 654, L5
---. 2007, , 654, L5
2007
-
[37]
C., Helgason , K., et al
Kashlinsky , A., Mather , J. C., Helgason , K., et al. 2015, , 804, 99
2015
-
[38]
C., Odenwald , S., & Hauser , M
Kashlinsky , A., Mather , J. C., Odenwald , S., & Hauser , M. G. 1996, , 470, 681
1996
-
[39]
2019 b , in , Vol
Kashlinsky , A., Ali-Ha \" moud , Y., Clesse , S., et al. 2019 b , in , Vol. 51, 51
2019
-
[40]
G., Ashby , M., et al
Kashlinsky , A., Arendt , R. G., Ashby , M., et al. 2019 c , in , Vol. 51, 37
2019
-
[41]
D., Hasinger , G., Brightman , M., et al
Kocevski , D. D., Hasinger , G., Brightman , M., et al. 2018, , 236, 48
2018
-
[42]
2017, , 466, 3035
Kolodzig , A., Gilfanov , M., H \"u tsi , G., & Sunyaev , R. 2017, , 466, 3035
2017
-
[43]
G., et al
Li , Y., Cappelluti , N., Arendt , R. G., et al. 2018, , 864, 141
2018
-
[44]
N., Xue , Y
Luo , B., Brandt , W. N., Xue , Y. Q., et al. 2017, , 228, 2
2017
-
[45]
Magdziarz , P., & Zdziarski , A. A. 1995, , 273, 837
1995
-
[46]
2016, , 832, 104
Mitchell-Wynne , K., Cooray , A., Xue , Y., et al. 2016, , 832, 104
2016
-
[47]
2015, , 454, 3771
Pacucci , F., Ferrara , A., Volonteri , M., & Dubus , G. 2015, , 454, 3771
2015
-
[48]
2018, , 864, L6
Pacucci , F., Loeb , A., Mezcua , M., & Mart \' n-Navarro , I. 2018, , 864, L6
2018
-
[49]
Pacucci , F., Natarajan , P., Volonteri , M., Cappelluti , N., & Urry , C. M. 2017, , 850, L42
2017
-
[50]
2019, arXiv e-prints, arXiv:1907.03675
Ricarte , A., Pacucci , F., Cappelluti , N., & Natarajan , P. 2019, arXiv e-prints, arXiv:1907.03675
2019 arXiv
-
[51]
L., Speagle , J
Steinhardt , C. L., Speagle , J. S., Capak , P., et al. 2014, , 791, L25
2014
-
[52]
2013, , 433, 1556
Yue , B., Ferrara , A., Salvaterra , R., Xu , Y., & Chen , X. 2013, , 433, 1556
2013
Reviewed August 14, 2026 · model on record in the stance chip above.
Discussion (0). Continue with ORCID to comment.