REVIEW 3 major objections 4 minor 44 references
You Can't Publish Replication Studies (and How to Anyways)
T0 review · 3 major / 4 minor · reviewed 2026-08-14 · deepseek-v4-flash
Pith's one-line read This position paper argues that strict replication studies are effectively unpublishable under current novelty requirements, but researchers can publish replication value by embedding it in studies that re-evaluate, expand, or specialize…
desk verdict A practical, clearly written position paper with a useful taxonomy, but the title overclaims and the evidence base is a self-selected case study rather than systematic data. read the letter →
The pith
A machine-rendered reading of the paper's core claim, the machinery that carries it, and where it could break.
The reading
What carries the argument
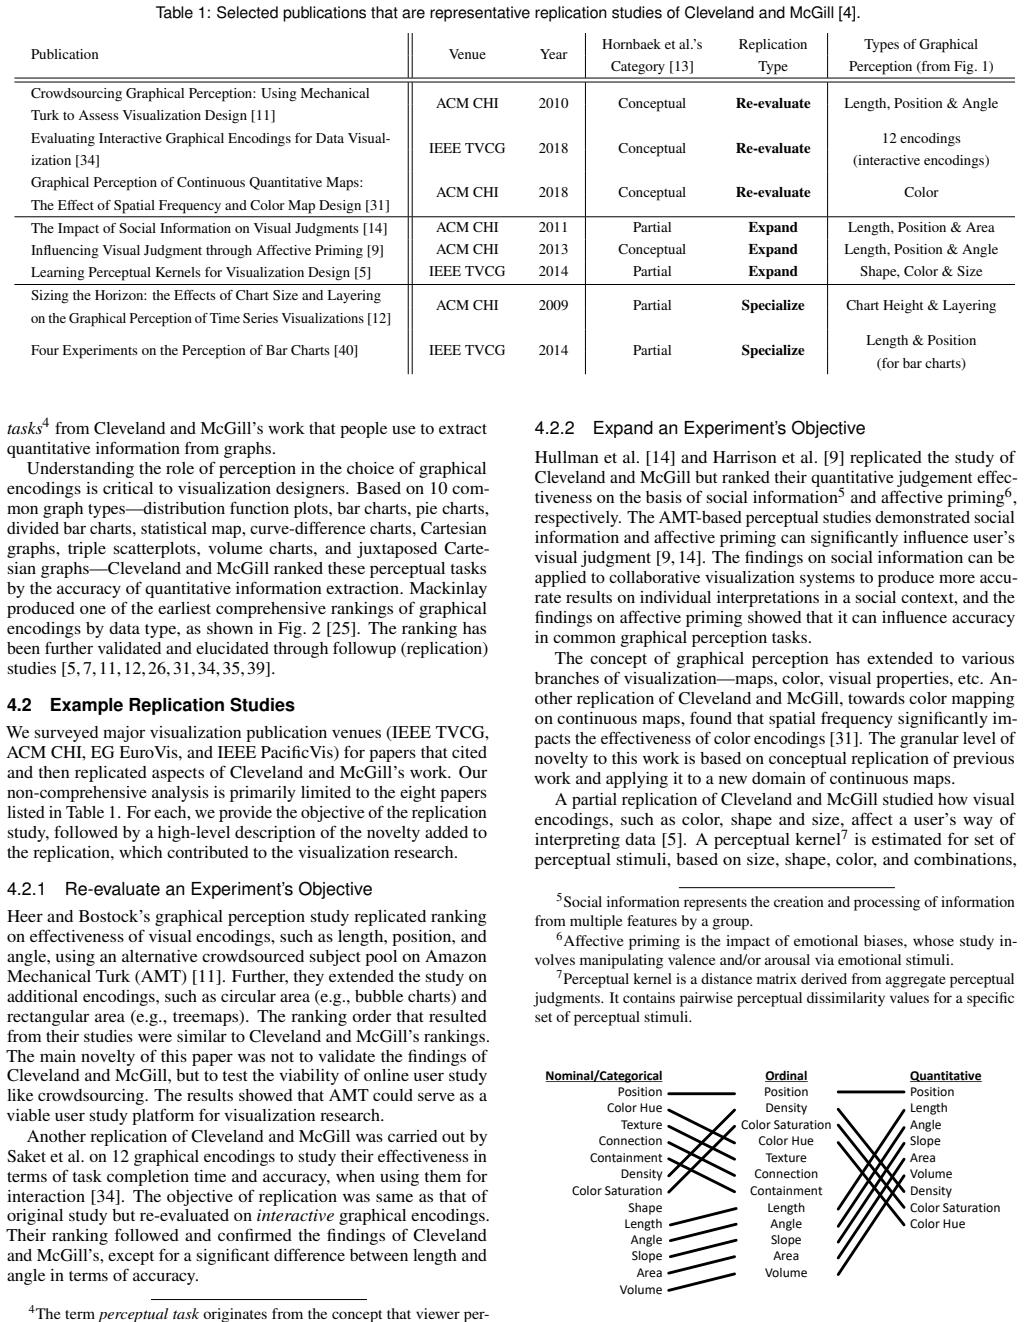
The central mechanism is the taxonomy of three embedded-replication forms. Re-evaluation repeats an earlier experiment's objective in a different setting, such as a crowdsourced subject pool. Expansion adds new experimental conditions to generalize or deepen earlier conclusions. Specialization transfers the original study's conclusions into a specific domain or application, often leveraging domain expertise. These categories are complementary to prior similarity-based classifications (strict, partial, conceptual) and are defined by the kind of novelty each carries.
What would settle it
A systematic survey of visualization and HCI venues that finds a published strict replication of a well-known result, or review data showing reviewers rate strict replication as equal in value to novel contributions, would cast doubt on the claimed dominance of the novelty requirement.
Extended reading notes
Core claim
The paper's central discovery is a taxonomy of how successful replication studies in information visualization actually carry novelty. Rather than classifying replication by similarity to the original (as prior work does), the authors classify by the type of novel contribution attached: re-evaluation, expansion, and specialization. Using the seminal graphical perception study as a case study, they show that widely-cited replication-like studies all fit one of these three patterns, and none is a strict replication. The conclusion is that researchers should not attempt strict replication; they should design studies that both re-confirm prior findings and advance a new objective, environment, or domain.
Load-bearing premise
The argument depends on the premise that the novelty requirement is so dominant across publication venues that strict replication studies are effectively unpublishable; the paper supports this only with anecdotal and secondary evidence rather than systematic acceptance data.
Editorial extensions
If this is right
- Vision scientists can enter visualization research by replicating a known perceptual study and specializing it to a visualization context.
- Re-evaluation studies using new participant pools, such as crowdsourced subjects, can confirm that older lab-based findings still hold in modern settings.
- Expansion studies can generalize perceptual laws, such as modeling correlation perception, to new chart types or tasks.
- Strict replication alone should be avoided if the goal is publication under current novelty standards.
- Reviewers and venues could encourage embedded replications by explicitly rewarding replication components with bonus points, analogous to data-availability incentives.
Reading between the lines
- The taxonomy likely generalizes beyond visualization to other empirical fields where novelty is required, such as human-computer interaction or cognitive science.
- If the novelty requirement weakens through new journal policies or pre-registration, strict replication may become publishable, making the paper's strategic advice time-bound.
- The paper's own literature search found no strict replications of the graphical perception study; a larger systematic review could test whether strict replications ever appear in other venues or subfields.
- The bonus-points mechanism could be evaluated empirically by comparing review scores of submissions that include a replication component versus those that do not.
Signed reviews
Editorial analysis
A structured set of objections, weighed in public.
Referee Report
Summary. This position paper addresses the difficulty of publishing replication studies in information visualization and vision science. The authors argue that strict replication studies—those that only re-conduct and confirm an earlier experiment—lack the novelty required by publication venues and are therefore effectively unpublishable. They propose that researchers can successfully publish replication work by embedding it in studies that carry additional novelty, and they define a three-category taxonomy of such embedded replications: re-evaluation (testing an original finding under new conditions or participant pools), expansion (broadening the original conclusions with additional experimental conditions), and specialization (transferring the original knowledge to a specialized domain). The taxonomy is illustrated with a non-exhaustive case study of eight papers that replicate aspects of Cleveland and McGill's seminal graphical perception work. The paper concludes with practical advice for vision scientists who wish to contribute to visualization research via replication studies, recommending specialization as a particularly promising route, and suggests that reviewers could encourage replication by rewarding papers that include small replication components.
Significance. If the central claim is accepted, the paper contributes a useful vocabulary for describing replication-embedded contributions and offers concrete guidance for researchers at the vision science/visualization interface. The taxonomy is simple and memorable, and the case study of Cleveland and McGill replications gives the advice a concrete grounding. The authors are honest about the non-exhaustive nature of their survey and explicitly frame the paper as a position piece. The practical recommendation—embed replication in a novel contribution—is likely sound regardless of whether strict replication is truly unpublishable, because it aligns with observed publication practices and gives novice researchers a low-risk entry strategy. However, the paper's title and framing depend on an empirical premise that is not systematically demonstrated, and the taxonomy is validated only on the same examples from which it was induced. These issues do not destroy the paper's practical value but do require careful reframing and additional evidence before the strong claims can stand.
major comments (3)
- [Section 5.1 and Section 1] The central premise that strict replication studies are effectively unpublishable is not supported by the evidence provided. The claim relies on citations to position papers and a literature review [8,13,43] rather than systematic acceptance or rejection data, and the authors' own survey (Section 4.2) only examines eight published papers that embed replication, which cannot demonstrate that strict replications are rejected or unpublishable. The text itself concedes that 'some may exist' and that it is 'incredibly difficult' rather than impossible. Please either soften the claim to reflect the available evidence (e.g., 'rarely published' or 'currently disincentivized') or supply systematic evidence on submission and rejection outcomes to justify the strong framing.
- [Section 3.1 and Section 4.2] The taxonomy is circular in construction: Section 3.1 states that the authors' 'evaluation of prior work shows that the vast majority of replicated work in information visualization falls within one of the three following categories,' and then Section 4.2 uses the same body of work to demonstrate that taxonomy. There is no independent validation, no a priori definition of the categories, and no test against negative cases or a broader systematically sampled corpus. Please clarify whether the taxonomy is intended as a descriptive framework derived from the examples (which would require acknowledging its exploratory nature more explicitly) or as an empirical claim about the distribution of replication styles (which would require a more rigorous survey method).
- [Section 4.2 and Table 1] The case study's methodology is not described with enough detail to assess its evidentiary weight. The authors do not report the search strategy, inclusion criteria, screening process, or the number of papers examined before arriving at the eight in Table 1. Without this information, the reader cannot judge whether the eight examples are representative or whether the absence of strict replication studies reflects reality or selection bias. In addition, some classifications in Table 1 appear to blur the category boundaries: for example, Heer and Bostock [11] are labeled 'Re-evaluate' but the text describes them as also extending the original study to new encodings, which would overlap with 'Expand.' Please operationalize the categories and provide transparency about how each paper was assigned.
minor comments (4)
- [Abstract and throughout] There are several wording and typographical errors that should be corrected, including 'Simple put' (should be 'Simply put'), 'Y ou' at the start of the title, 'wishing contribute' (missing 'to'), 'cite' instead of 'cited' in Section 4, 'shined new light' (should be 'shed new light' or 'shed light'), and 'in deep knowledge' (should be 'deep knowledge').
- [Section 2] The discussion of prior replication classifications would benefit from a table or figure that explicitly compares Hornbaek et al.'s strict/partial/conceptual categories with Kosara and Haroz's reanalysis/direct/conceptual categories and the authors' new re-evaluate/expand/specialize taxonomy, as this would help readers see the intended complementarity more clearly.
- [Section 4.2.1] The sentence 'The main novelty of this paper was not to validate the findings of Cleveland and McGill, but to test the viability of online user study like crowdsourcing' is clear in intent but the phrase 'online user study like crowdsourcing' should read 'online user studies such as crowdsourcing' for grammatical correctness.
- [Section 5.2] The claim that 'we believe specializing represents the best opportunity' is presented without a supporting argument for why specialization is superior to re-evaluation or expansion for vision scientists; a short justification would strengthen the practical advice.
Circularity Check
No significant circularity: the paper is an explicitly positioned argument whose recommendation follows from a stated premise; the taxonomy and Cleveland-McGill case study are illustrative, not a derived-and-tested prediction.
full rationale
The paper makes no formal derivation, fits no parameters, and reports no predictive claim. The central recommendation (Section 5.2: 'the best way for individual researchers to publish replication studies is to distinguish the work with the help of added novelty') follows from the explicitly stated premise in Section 5.1 that novelty is a necessary review criterion and that strict replication supplies no novelty by definition. That premise is supported by citations to prior critiques and by the authors' self-described 'non-exhaustive' survey, which is weak empirical evidence but not circular. The three-category taxonomy in Section 3.1 is introduced as 'our evaluation of prior work' and then illustrated in Section 4.2 with the same Cleveland-McGill examples; the paper explicitly labels this a 'non-exhaustive case study' and never claims the examples independently validate the taxonomy. This is an interpretive framework, not a derivation whose output is equivalent to its input. There is no load-bearing self-citation chain and no imported uniqueness theorem. Accordingly, no circular step meeting the evidence standard is present.
Assumptions & free parameters
assumptions (2)
- domain assumption Publication venues require novelty as a necessary contribution, making strict replication studies effectively unpublishable.
- ad hoc to paper Every successful embedded replication in visualization falls into one of the three categories: re-evaluation, expansion, or specialization.
Cite this review
Pith. "Pith review of You Can't Publish Replication Studies (and How to Anyways)." pith.science (2026). https://pith.science/paper/P5BLQWRD
@misc{pith2026190808893,
  author       = {Pith},
  title        = {Pith review of: You Can't Publish Replication Studies (and How to Anyways)},
  year         = {2026},
  howpublished = {\url{https://pith.science/paper/P5BLQWRD}},
  note         = {Machine review of arXiv:1908.08893}
}
read the original abstract
Reproducibility has been increasingly encouraged by communities of science in order to validate experimental conclusions, and replication studies represent a significant opportunity to vision scientists wishing contribute new perceptual models, methods, or insights to the visualization community. Unfortunately, the notion of replication of previous studies does not lend itself to how we communicate research findings. Simple put, studies that re-conduct and confirm earlier results do not hold any novelty, a key element to the modern research publication system. Nevertheless, savvy researchers have discovered ways to produce replication studies by embedding them into other sufficiently novel studies. In this position paper, we define three methods -- re-evaluation, expansion, and specialization -- for embedding a replication study into a novel published work. Within this context, we provide a non-exhaustive case study on replications of Cleveland and McGill's seminal work on graphical perception. As it turns out, numerous replication studies have been carried out based on that work, which have both confirmed prior findings and shined new light on our understanding of human perception. Finally, we discuss how publishing a true replication study should be avoided, while providing suggestions for how vision scientists and others can still use replication studies as a vehicle to producing visualization research publications.
Figures

Reference graph
Works this paper leans on
-
[11]
J. Heer and M. Bostock. Crowdsourcing Graphical Perception: Using Mechanical Turk to Assess Visualization Design. In ACM SIGCHI: on Human Factors in Computing Systems, pp. 203–212, 2010
work page 2010
-
[1]
Changing Order: Replication and Induction in Scientific Practice
C. Bazerman. Book Review of “Changing Order: Replication and Induction in Scientific Practice” by H. M. Collins. Philosophy of the Social Sciences/Philosophie des Sciences Sociales, 19(1):115, 1989
work page 1989
-
[2]
E. Bertini, N. Elmqvist, and T. Wischgoll. Judgment Error in Pie Chart Variations. In Proceedings of the Eurographics/IEEE VGTC Conference on Visualization: Short Papers, pp. 91–95, 2016
work page 2016
- [3]
-
[4]
W. Cleveland and R. McGill. Graphical Perception: Theory, Experi- mentation, and Application to the Development of Graphical Methods. Journal of the American Statistical Association , 79(387):531–554, 1984
work page 1984
-
[5]
C ¸. Demiralp, M. Bernstein, and J. Heer. Learning Perceptual Kernels for Visualization Design. IEEE Transactions on Visualization and Computer Graphics, 20(12):1933–1942, 2014
work page 1933
-
[6]
P. Dragicevic and Y . Jansen. Blinded with Science or Informed by Charts? A Replication Study. IEEE Transactions on Visualization and Computer Graphics, 24(1):781–790, 2017
work page 2017
-
[7]
C. Gramazio, K. Schloss, and D. Laidlaw. The Relation Between Visu- alization Size, Grouping, and User Performance. IEEE Transactions on Visualization and Computer Graphics, 2014
work page 2014
Show all 44 references
-
[8]
Greenberg and B
S. Greenberg and B. Buxton. Usability Evaluation Considered Harmful (Some of the Time). In ACM SIGCHI Conference on Human Factors in Computing Systems, pp. 111–120, 2008
2008
-
[9]
Harrison, D
L. Harrison, D. Skau, S. Franconeri, A. Lu, and R. Chang. Influenc- ing Visual Judgment through Affective Priming. In ACM SIGCHI Conference on Human Factors in Computing Systems, pp. 2949–2958, 2013
2013
-
[10]
Harrison, F
L. Harrison, F. Yang, S. Franconeri, and R. Chang. Ranking Visual- izations of Correlation Using Weber’s Law. IEEE Transactions on Visualization and Computer Graphics, 20(12):1943–1952, 2014
1943
-
[12]
J. Heer, N. Kong, and M. Agrawala. Sizing the Horizon: The Effects of Chart Size and Layering on the Graphical Perception of Time Series Visualizations. In ACM SIGCHI Conference on Human Factors in Computing Systems, 2009
2009
-
[13]
Hornbæk, S
K. Hornbæk, S. Sander, J. A. Bargas-Avila, and J. Grue Simonsen. Is Once Enough?: On the Extent and Content of Replications in Human- Computer Interaction. In ACM SIGCHI Conference on Human Factors in Computing Systems, pp. 3523–3532, 2014
2014
-
[14]
Hullman, E
J. Hullman, E. Adar, and P. Shah. The Impact of Social Information on Visual Judgments. In ACM SIGCHI Conference on Human Factors in Computing Systems, pp. 1461–1470, 2011
2011
-
[15]
Jakobsen and K
M. Jakobsen and K. Hornbæk. Interactive Visualizations on Large and Small Displays: The Interrelation of Display Size, Information Space, and Scale. IEEE Transactions on Visualization and Computer Graphics, 19(12):2336–2345, 2013
2013
-
[16]
Jasny, G
B. Jasny, G. Chin, L. Chong, and S. Vignieri. Again, and Again, and Again... American Association for the Advancement of Science, 2011
2011
-
[17]
Jones, P
K. Jones, P. Derby, and E. Schmidlin. An Investigation of the Preva- lence of Replication Research in Human Factors. Human Factors, 52(5):586–595, 2010
2010
-
[18]
Kay and J
M. Kay and J. Heer. Beyond Weber’s Law: A Second Look at Ranking Visualizations of Correlation. IEEE Transactions on Visualization and Computer Graphics, 22(1):469–478, 2015
2015
-
[19]
S.-H. Kim, Z. Dong, H. Xian, B. Upatising, and J.-S. Yi. Does an Eye Tracker Tell the Truth About Visualizations?: Findings While Investigating Visualizations for Decision Making. IEEE Transactions on Visualization and Computer Graphics, 18(12):2421–2430, 2012
2012
-
[20]
N. Kong, J. Heer, and M. Agrawala. Perceptual Guidelines for Creat- ing Rectangular Treemaps. IEEE Transactions on Visualization and Computer Graphics, 16(6):990–998, 2010
2010
-
[21]
R. Kosara. An Empire Built on Sand: Reexamining What We Think We Know About Visualization. In Beyond Time and Errors on Novel Evaluation Methods for Visualization, pp. 162–168, 2016
2016
-
[22]
Kosara and S
R. Kosara and S. Haroz. Skipping the Replication Crisis in Visualiza- tion: Threats to Study Validity and How to Address Them: Position Paper. In IEEE Evaluation and Beyond-Methodological Approaches for Visualization (BELIV), pp. 102–107, 2018
2018
-
[23]
Kosara and C
R. Kosara and C. Ziemkiewicz. Do Mechanical Turks Dream of Square Pie Charts? In Beyond Time and Errors on Novel Evaluation Methods for Visualization, pp. 63–70, 2010
2010
-
[24]
Lallemand, V
C. Lallemand, V . Koenig, and G. Gronier. Replicating an International Survey on User Experience: Challenges, Successes and Limitations. In ACM SIGCHI Conference on Human Factors in Computing Systems, 2013
2013
-
[25]
Mackinlay
J. Mackinlay. Automating the Design of Graphical Presentations of Re- lational Information. ACM Transactions On Graphics (TOG), 5(2):110– 141, 1986
1986
-
[26]
Neumann, K
L. Neumann, K. Matkovic, and W. Purgathofer. Perception Based Color Image Difference. Computer Graphics Forum, 17(3):233–241, 1998
1998
-
[27]
W. Newman. A Preliminary Analysis of the Products of HCI Research, Using Pro Forma Abstracts. In ACM SIGCHI Conference on Human Factors in Computing Systems, vol. 94, pp. 278–284, 1994
1994
-
[28]
Ottley, E
A. Ottley, E. M. Peck, L. Harrison, D. Afergan, C. Ziemkiewicz, H. Tay- lor, P. Han, and R. Chang. Improving Bayesian Reasoning: The Effects of Phrasing, Visualization, and Spatial Ability. IEEE Transactions on Visualization and Computer Graphics, 22(1):529–538, 2015
2015
-
[29]
R. Peng. Reproducible Research and Biostatistics. Biostatistics, 10(3):405–408, 2009
2009
-
[30]
S. Pinker. A Theory of Graph Comprehension. Artificial Intelligence and the Future of Testing, pp. 73–126, 1990
1990
-
[31]
K. Reda, P. Nalawade, and K. Ansah-Koi. Graphical Perception of Continuous Quantitative Maps: The Effects of Spatial Frequency and Colormap Design. In ACM SIGCHI Conference on Human Factors in Computing Systems, p. 272, 2018
2018
-
[32]
R. A. Rensink and G. Baldridge. The Perception of Correlation in Scatterplots. Computer Graphics Forum, 29(3):1203–1210, 2010
2010
-
[33]
Rosenthal
R. Rosenthal. Replication in Behavioral Research. Journal of Social Behavior and Personality, 5(4):1, 1990
1990
-
[34]
Saket, A
B. Saket, A. Srinivasan, E. D. Ragan, and A. Endert. Evaluating Inter- active Graphical Encodings for Data Visualization. IEEE Transactions on Visualization and Computer Graphics, 24(3):1316–1330, 2018
2018
-
[35]
Sedlmair, A
M. Sedlmair, A. Tatu, T. Munzner, and M. Tory. A Taxonomy of Visual Cluster Separation Factors. Computer Graphics Forum, 31(3pt4):1335– 1344, 2012
2012
-
[36]
Skau and R
D. Skau and R. Kosara. Arcs, Angles, or Areas: Individual Data Encod- ings in Pie and Donut Charts. Computer Graphics Forum, 35(3):121– 130, 2016
2016
-
[37]
Sukumar and R
P. Sukumar and R. Metoyer. Towards Designing Unbiased Replication Studies in Information Visualization. In IEEE Evaluation and Beyond- Methodological Approaches for Visualization (BELIV), pp. 93–101, 2018
2018
-
[38]
P. T. Sukumar and R. Metoyer. Replication and Transparency of Qual- itative Research from a Constructivist Perspective. OSF Preprints, 2019
2019
-
[39]
D. Szafir. Modeling Color Difference for Visualization Design. IEEE Transactions on Visualization and Computer Graphics, 24(1):392–401, 2018
2018
-
[40]
Talbot, V
J. Talbot, V . Setlur, and A. Anand. Four Experiments on the Perception of Bar Charts. IEEE Transactions on Visualization and Computer Graphics, 20(12):2152–2160, 2014
2014
-
[41]
A. C. Valdez, A. K. Schaar, J. R. Hildebrandt, and M. Ziefle. Re- quirements for Reproducibility of Research in Situational and Spatio- Temporal Visualization: Position Paper. In IEEE Evaluation and Beyond-Methodological Approaches for Visualization (BELIV) , pp. 53–59, 2018
2018
-
[42]
C. Ware. Information Visualization: Perception for Design. Elsevier, 2012
2012
-
[43]
Wilson, E
M. Wilson, E. Chi, S. Reeves, and D. Coyle. RepliCHI: The Workshop II. In ACM SIGCHI Conference on Human Factors in Computing Systems (Extended Abstracts), pp. 33–36, 2014
2014
-
[44]
F. Yang, L. Harrison, R. A. Rensink, S. Franconeri, and R. Chang. Cor- relation Judgment and Visualization Features: A Comparative Study. IEEE Transactions on Visualization and Computer Graphics, 2018
2018
Reviewed August 14, 2026 · model on record in the stance chip above.
Discussion (0). Continue with ORCID to comment.