REVIEW 3 major objections 6 minor 31 references
Classifying Radio-Loud and Radio-Quiet Quasars With Novel PCA Based Regression Classifier
T0 review · 3 major / 6 minor · reviewed 2026-08-16 · deepseek-v4-flash
Pith's one-line read A PCA-based balanced logistic regression, using just two principal components of SDSS photometry, raises recall for rare radio-loud quasars to 0.52, far above the 0.04 to 0.39 range of standard classifiers.
desk verdict The headline recall claim rests on a mislabeled target: radio-loudness defined by raw flux instead of the standard ratio, so the paper's central comparison may be measuring something else; still worth refereeing for its clean code/data and clear demonstration of the precision-recall trade-off. read the letter →
The pith
A machine-rendered reading of the paper's core claim, the machinery that carries it, and where it could break.
The reading
What carries the argument
The central object is the PCA-based balanced linear regression classifier (PBC): z-score the five SDSS optical magnitudes, project onto the first two principal components, and fit a logistic regression with class weights set to offset the 1:14 imbalance between radio-quiet and radio-loud quasars. The first component loads uniformly across bands (overall brightness, 87.6% of variance) and the second is dominated by the u-band (UV-sensitive spectral variation, 9.7%), together reaching 97.3% cumulative variance. The regression uses these two scores as a single linear decision boundary in a plane where the paper reports that the radio-loud and radio-quiet projections occupy different regions, letting the balanced weights push the boundary toward higher minority recall.
What would settle it
Recompute the labels with the standard radio-loudness ratio $R = \log_{10}(f_{\rm radio}/f_{\rm optical}) > 1$ on the same SDSS data, rerun the same train/test protocol, and see whether PBC still reaches roughly 0.52 minority recall; a drop toward the baselines would show the reported gain is an artifact of the flux-only label.
Extended reading notes
Core claim
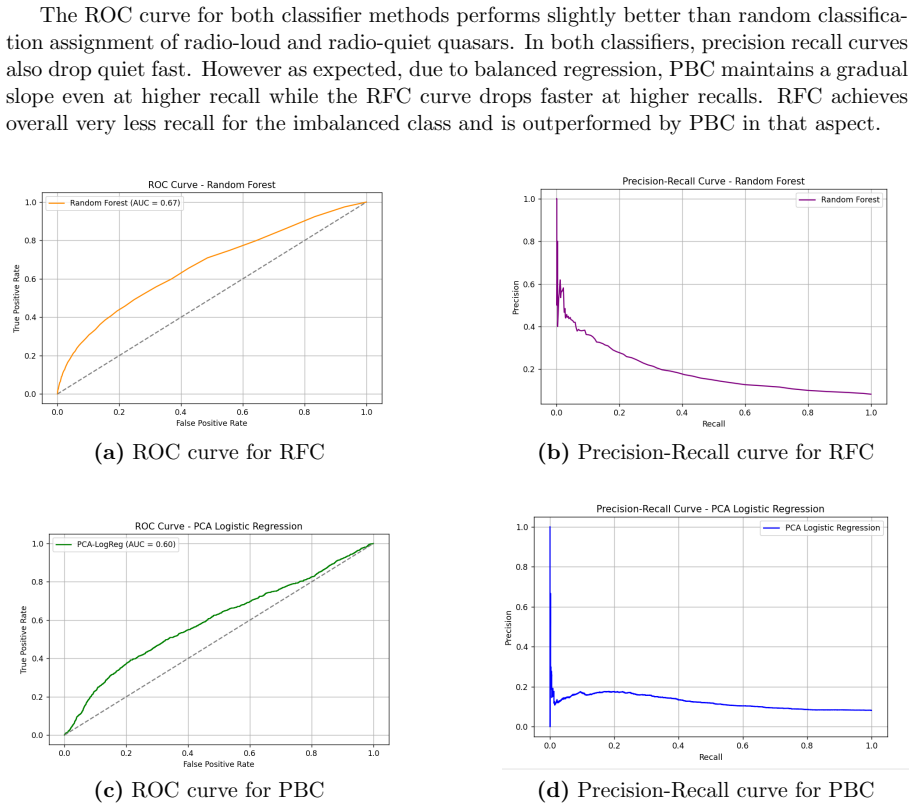
On its own terms, the paper establishes a performance comparison on the SDSS-DR3 quasar catalog: using the first two principal components of the u, g, r, i, z magnitudes (together 97% of the variance) as features, a balanced logistic regression labels 52% of test radio-loud quasars correctly, against 4% for a random forest on the original five magnitudes, 39% for threshold-tuned XGBoost, and 25% for SMOTE-augmented random forest. The same model reaches an F1 of 0.19 for the minority class, sandwiched between XGBoost's 0.22 and the random forest's 0.08. The paper interprets this as evidence that balancing class weights in a regression on PCA components is an effective way to recover rare radio-loud quasars, at the price of precision (0.11) and overall accuracy (0.62).
Load-bearing premise
The load-bearing premise is that radio-loud and radio-quiet quasars are correctly separated by the cutoff $\log_{10}(\mathrm{radio\,flux}) > 1$, applied to raw flux rather than the standard radio-to-optical ratio; if that labeling is incorrect, the reported recalls measure a different dichotomy.
Editorial extensions
If this is right
- The reported recall of 0.52 means a survey that uses PBC as a pre-filter would catch more than half of the radio-loud quasars that a random forest misses, making it a candidate first stage for completeness-driven radio-loud quasar searches.
- Because precision for the radio-loud class is only 0.11, the same pipeline would flood a follow-up sample with false positives; for purity-driven studies the random forest or XGBoost remains the better choice, a tradeoff the paper states explicitly.
- The two-component representation (brightness plus UV-sensitive variation) explains 97% of the photometric variance, so the classification itself needs only two numbers per quasar, a large practical reduction in feature cost.
- The significant redshift difference between the two classes (t-test p = 0.00003) means redshift carries some of the separation the classifiers use, so future work should test whether recall holds when redshift is controlled for.
- The extreme imbalance (about one radio-loud for every 14 radio-quiet in the sample) is itself quantified by the comparison: every method, including PBC, sacrifices precision when it raises minority recall.
Reading between the lines
- Because the label is raw flux rather than the radio-to-optical ratio, part of the apparent separability may be distance or luminosity information; a fair test using $R = \log_{10}(f_{\rm radio}/f_{\rm optical}) > 1$ would likely shrink the gap between PBC and the baselines.
- The paper's own caveat that PCA maximizes variance, not class separation, suggests the two-component projection may discard the color information most tied to jet activity; projecting onto PCA of color indices rather than raw magnitudes is a direct testable extension.
- The reported numbers rest on a single train/test split; a repeated stratified cross-validation with a leakage check on the SDSS-DR3 catalog would show whether the 0.52 recall is stable or a selection artifact.
- The recipe—balance the weights, regress on two principal components—generalizes to any rare-object catalogue problem where completeness beats purity, such as high-redshift quasar hunting, though the paper only demonstrates it for radio loudness.
Signed reviews
Editorial analysis
A structured set of objections, weighed in public.
Referee Report
Summary. Joshi and Shinde present a comparative study of classifiers for distinguishing radio-loud and radio-quiet quasars in the SDSS-DR3 catalog. They apply PCA to the five SDSS optical magnitudes, find that two components capture 97% of the variance, and train a balanced logistic regression classifier on these components (PBC). They compare PBC against a random forest (RFC), an XGBoost classifier with threshold tuning, and RFC with SMOTE. The headline result is that PBC achieves a recall of 0.52 for the minority radio-loud class, far higher than RFC's 0.04, at the cost of lower overall accuracy (0.62 vs 0.92). The paper also reports redshift distribution analysis and a Lyman-alpha forest effect at high redshift.
Significance. If the label definition and evaluation-protocol issues are resolved, the paper would provide a useful, reproducible comparison of simple and interpretable baselines (PCA + balanced logistic regression) against more complex methods on an imbalanced astrophysical classification task. The inclusion of the code and data repository is a strength. However, the methodological novelty is limited: balanced logistic regression on PCA components is a standard technique, and the main contribution is the application-specific comparison. The central recall claim is therefore conditional on fixing the target-variable definition and the evaluation protocol.
major comments (3)
- [Section 2, label definition] The classification target is defined by the raw radio flux (log10(radio flux) > 1) rather than the standard radio-loudness parameter R = log10(f_radio/f_optical), even though reference [10] (Kellermann et al. 1989) defines radio-loudness via this ratio. This is internally inconsistent with the cited reference and misclassifies quasars whose radio flux is low but whose optical flux is even lower, or whose radio flux is high but whose optical flux is higher. Since the input features include optical magnitudes, the classifiers may be learning optical brightness rather than the physical dichotomy. All reported metrics in Tables 3-6, including the headline recall of 0.52, are computed against this potentially incorrect target. The authors should either recompute the labels using the standard ratio (possible with the available optical photometry) or provide a strong astrophysical justification for the raw-flux cutoff and discuss how it differs from the standard definition.
- [Section 3.6, Table 5] The XGBoost decision threshold appears to be selected by evaluating performance on the test set for thresholds from 0.10 to 0.90, and the threshold of 0.50 is then reported as 'optimal' along with the resulting metrics. This constitutes test-set leakage: the reported accuracy, recall, and F1 scores for XGBoost at that threshold are fitted to the evaluation data rather than representing a clean out-of-sample prediction. The threshold should be chosen on a validation set or via cross-validation, and only then should the final model be evaluated once on the held-out test set. Without this correction, the XGBoost comparison in Table 6 is optimistically biased.
- [Section 2 and 3.5, preprocessing] It is unclear whether the StandardScaler and the PCA transformation are fitted on the full dataset before the train/test split or on the training split only. If the former, the test set contributes to the estimated mean, variance, and principal components, which is a form of data leakage that can inflate performance estimates. The authors should fit the scaler and PCA on the training split and apply the fitted transform to the test split, and state this explicitly in the methodology.
minor comments (6)
- [Abstract vs Table 6] The abstract reports XGBoost accuracy as 72%, but Table 6 lists 0.78 for the same configuration; the discrepancy should be corrected.
- [Section 2, outlier handling] The sentence 'We also identify outliers from the data set with i >19 by simply by separating the outliers from i< 19 dataset' is unclear and contains duplicated wording; clarify whether the identified outliers are removed before classification or only used in visualizations, and report the final sample size after any removal.
- [Section 3.5] There is a typo in 'fiur approaches'; it should be 'four approaches'.
- [Section 3.4] There is a typo in 'Diagnostic plots as sbown above'; it should be 'shown'.
- [General terminology] The model described as 'PCA based balanced linear regression classifier' is implemented as logistic regression (Table 3); use consistent terminology throughout the paper.
- [Figure 10 and surrounding text] The claim that 'the distribution of the RL and RQ quasars in the upper quadrant is significantly different' is not supported by any quantitative test; consider adding a density contour plot or a statistical comparison.
Circularity Check
Two evaluation-protocol leaks (XGBoost threshold tuned on the test set; PCA fit before the split) undermine the reported comparisons, but the central PBC claim is not a definitional identity.
-
fitted input called prediction
[Section 3.6 (XGBoost with threshold tuning), Table 5 and Table 6]
"Threshold tuning gives an optimal performance matrix for XGBoost at the threshold of 0.50."
Table 5 computes accuracy, precision, recall, and F1 on the test split (8537 RQ and 747 RL) for thresholds 0.10 through 0.90. The paper then labels one of these threshold-specific rows as the 'optimal' XGBoost model and uses it in the headline comparison of Table 6. The same test labels that generate the reported metrics are used to choose the threshold, so the XGBoost row is an in-sample evaluation of a decision rule, not an independent out-of-sample prediction. The 'optimal' threshold is a fitted input selected from the evaluation data, and the reported 0.39 RL recall and 0.78 accuracy are direct outputs of that selection rather than a clean benchmark against PBC.
-
other
[Section 2 (Methodology: PCA pre-processing) and Section 3.5 (RFC and PBC analysis)]
"To highlight key variance features in the data, Principal Component Analysis (PCA) was applied to the standardized optical magnitudes. First, the photometric features were standardized using the StandardScaler from scikit-learn to ensure zero mean and unit variance. ... Finally, these PCA components were used to train a balanced logistic regression classifier."
The text places standardization and PCA fitting before the description of the train/test split ('The data was split into training and testing sets using train test split' appears later, in the Random Forest paragraph). If the StandardScaler statistics and PCA eigenvectors are computed from the full SDSS sample, the PBC test-set inputs already carry information from the test distribution. The reported PBC test recall and precision therefore are not clean out-of-sample estimates: the feature transformation is partially fitted on the same data used for evaluation. This is a leakage in the validation protocol rather than a definitional equivalence, but it undermines the independence of the PBC metrics.
full rationale
Overall, the paper's central distinction — comparing a balanced logistic regression on two PCA components against RFC, SMOTE+RFC, and XGBoost — is an empirical benchmark, not a derivation equivalent to its own inputs. The 'radio-loud' target is a threshold on log10(radio flux), not on the optical features used as predictors, so PBC is not tautologically predicting its own definition. No load-bearing self-citations appear in the paper; references [7]–[9] are external prior work on PCA and regression, not an author-imported uniqueness claim that forces the method. The reported 0.52 RL recall is a genuine model output for the chosen label. The circularity concerns are confined to the evaluation protocol: (1) the XGBoost decision threshold in Section 3.6 is selected by computing metrics at thresholds 0.10–0.90 on the test set, so the 'optimal' row in Table 6 is fitted to the same labels used for evaluation; (2) the text's ordering suggests StandardScaler and PCA were fit on the full dataset before the train/test split, which would make the PBC test metrics partially dependent on the test set. Neither issue makes the PBC claim itself a definitional identity, and the questionable radio-loudness label definition (raw flux rather than the standard radio-to-optical ratio) is a scientific correctness issue rather than a circularity. The moderate score reflects the real but partial circularity in the evaluation claims while recognizing that the central classifier comparison has independent empirical content.
Assumptions & free parameters
free parameters (5)
- XGBoost decision threshold θ =
0.50
- XGBoost scale_pos_weight =
imbalance ratio N0/N1 (approx 11.4)
- Number of PCA components =
2
- Radio-loud flux cutoff =
log10(radio flux) > 1
- Outlier cutoff for i-band magnitude =
i > 19 (unclear whether excluded)
assumptions (4)
- domain assumption Radio-loud quasars are rare, about 10% of the quasar population, and SDSS DR3 is a suitable sample to study them.
- domain assumption Photometric magnitudes (u,g,r,i,z) and the derived PCA components contain enough information to classify radio-loudness.
- standard math The t-test at the 0.05 significance level is an appropriate test for comparing redshift distributions.
- ad hoc to paper The log10(radio flux)>1 cutoff follows Kellermann et al. [10], even though that reference defines radio-loudness via a ratio.
Cite this review
Pith. "Pith review of Classifying Radio-Loud and Radio-Quiet Quasars With Novel PCA Based Regression Classifier." pith.science (2026). https://pith.science/paper/P6SETGDW
@misc{pith2026250501335,
  author       = {Pith},
  title        = {Pith review of: Classifying Radio-Loud and Radio-Quiet Quasars With Novel PCA Based Regression Classifier},
  year         = {2026},
  howpublished = {\url{https://pith.science/paper/P6SETGDW}},
  note         = {Machine review of arXiv:2505.01335}
}
read the original abstract
The problem of quasar classification comes in the class of highly imbalanced classification problems since Radio-loud (RL) quasars are rare and make up only about 10% of the quasar population. In this work, we use the Sloan Digital Sky Survey-DR3 dataset and introduce a PCA-based regression pipeline designed to maximize recall for rare classes in class-imbalanced astronomical data. We demonstrate an effective methodology to identify the key features of the dataset and apply Principal Component Analysis (PCA) for dimensionality reduction. For the PCA transformed SDSS-DR3 dataset, first two components account for the 97% of the observed variance. We perform classification of Radio-Loud (RL) and Radio-Quiet (RQ) quasars with Random Forest Classifier (RFC), novel PCA based balanced linear regression classifier (PBC), Random forest integrated with SMOTE classifier and XGBoost classifier with threshold tuning. RFC achieves an overall accuracy of 92% while PBC achieves an overall accuracy of 62%. XGBoost achieves an overall accuracy of 72% and SMOTE integrated RFC achieves an accuracy of 85%. Higher precision is obtained for RQ quasars in all classification methods. For the RL class, RFC achieves a recall of 0.04, XGBoost achieves a recall of 0.39, SMOTE integrated RFC achieves a recall of 0.25 and PBC achieves a recall of 0.52 attributed to the balanced logistic regression. RFC and PBC achieve F1 score of 0.08 and 0.19 respectively for RL while XGBoost achieves an improved F1 score of 0.22 but at the cost of reduced recall of the RL class. SMOTE integrated RFC achieves a better F1 score of 0.21 over RFC and PBC. Overall results of classifiers point to extreme class imbalance between RQ and RL classes in the data set.
Figures


Figures from the paper (10 more)




Reference graph
Works this paper leans on
-
[10]
VLA observations of objects in the Palomar Bright Quasar Survey,
K. I. Kellermann, R. Sramek, M. Schmidt, D. B. Shaffer, and R. Green, “VLA observations of objects in the Palomar Bright Quasar Survey,” The Astronomical Journal, vol. 98, no. 4, pp. 1195–1207, Oct. 1989. doi:10.1086/115207
doi:10.1086/115207 1989
-
[1]
K. I. Kellermann, “The discovery of quasars,” Bull. Astr. Soc. India , vol. 41, pp. 1–17, 2013
work page 2013
-
[2]
Evolution of high-redshift quasars,
X. Fan, “Evolution of high-redshift quasars,” New Astronomy Reviews , vol. 50, no. 9–10, pp. 665–671, Nov. 2006. doi:10.1016/j.newar.2006.06.077
-
[3]
SDSS-V: Pioneering Panoptic Spectroscopy,
J. A. Kollmeier et al., “SDSS-V: Pioneering Panoptic Spectroscopy,” Astro2020: Decadal Survey on Astronomy and Astrophysics, APC white papers , no. 274, Bull. Am. Astron. Soc., vol. 51, no. 7, id. 274, Sept. 2019
work page 2019
-
[4]
Principal component analysis: a review and recent develop- ments,
I. T. Jolliffe and J. Cadima, “Principal component analysis: a review and recent develop- ments,” Philosophical Transactions of the Royal Society A: Mathematical, Physical and En- gineering Sciences, vol. 374, no. 2065, p. 20150202, Apr. 2016. doi:10.1098/rsta.2015.0202
arXiv 2016
-
[5]
L. Breiman, “Random forests,” Machine Learning , vol. 45, no. 1, pp. 5–32, 2001. doi:10.1023/A:1010933404324
-
[6]
Random Forest Algorithm Overview,
H. A. Salman, A. Kalakech, and A. Steiti, “Random Forest Algorithm Overview,” British Journal of Machine Learning , June 2024. doi:10.58496/BJML/2024/007
-
[7]
G. Guo, H. Song, and L. Zhu, “The iterated score regression estimation algorithm for PCA- based missing data with high correlation,” Scientific Reports, vol. 15, article no. 9067, Mar
Show all 31 references
-
[8]
Multiclass Logistic Regression Classification with PCA for Imbalanced Medical Datasets,
A. A. Nababan, Sutarman, M. Zarlis, and E. B. Nababan, “Multiclass Logistic Regression Classification with PCA for Imbalanced Medical Datasets,” Mathematical Modelling of Engineering Problems, vol. 11, no. 9, pp. 2377–2387, Sept. 2024. doi:10.18280/mmep.110911
2024 doi
-
[9]
Feature selection for classification using principal component analysis and information gain,
E. O. Omuya, G. O. Okeyo, and M. W. Kimwele, “Feature selection for classification using principal component analysis and information gain,” Expert Systems with Applications , vol. 174, p. 114765, Jul. 2021. doi:10.1016/j.eswa.2021.114765 19
2021
-
[11]
Multivariate sensitivity analysis based on the direction of eigen space through principal component analysis,
S. Xiao, Z. Lu, and L. Xu, “Multivariate sensitivity analysis based on the direction of eigen space through principal component analysis,” Reliability Engineering & System Safety , vol. 165, pp. 1–10, Sep. 2017. doi:10.1016/j.ress.2017.03.011
2017 doi
-
[12]
The Lyman-alpha forest,
M. S. Roberts, “The Lyman-alpha forest,” 2008 Carnegie Observatories Astrophysics Series, pp. 1–22, 2008. Available: https://users.obs.carnegiescience.edu/~mr/ lyforest.pdf
2008
-
[13]
Reionization bias in high-redshift quasar near-zones,
J. S. B. Wyithe, J. S. Bolton, and M. G. Haehnelt, “Reionization bias in high-redshift quasar near-zones,” Monthly Notices of the Royal Astronomical Society , vol. 383, no. 2, pp. 691–704, Dec. 2007. doi:10.1111/j.1365-2966.2007.12578.x
2007
-
[14]
High- redshift quasars along the Main Sequence,
A. Deconto-Machado, A. del Olmo, P. Marziani, J. Perea, and G. M. Stirpe, “High- redshift quasars along the Main Sequence,” Astronomy & Astrophysics , vol. 669, A83,
-
[15]
Lyman- α forest power spectrum and its cross-correlation with dark matter haloes in different astrophysical models,
K. Nakashima, A. J. Nishizawa, K. Nagamine, Y. Oku, and I. Shimizu, “Lyman- α forest power spectrum and its cross-correlation with dark matter haloes in different astrophysical models,” Monthly Notices of the Royal Astronomical Society, vol. 537, no. 2, pp. 1343–1356, Feb. 202...
2025 doi
-
[16]
Classification with correlated features: unreliability of fea- ture ranking and solutions,
L. Tolosi and T. Lengauer, “Classification with correlated features: unreliability of fea- ture ranking and solutions,” Bioinformatics, vol. 27, no. 14, pp. 1986–1994, Jul. 2011. doi:10.1093/bioinformatics/btr300
1986 doi
-
[17]
The spectral slope and escape fraction of bright quasars at z ˜ 3.8: the contribution to the cosmic UV back- ground,
S. Cristiani, L. M. Serrano, F. Fontanot, E. Vanzella, and P. Monaco, “The spectral slope and escape fraction of bright quasars at z ˜ 3.8: the contribution to the cosmic UV back- ground,” Monthly Notices of the Royal Astronomical Society, vol. 462, no. 3, pp. 2478–2485, Nov. ...
2016 doi
-
[18]
The UV excess of quasars — Luminosity dependence,
A. Wandel, “The UV excess of quasars — Luminosity dependence,” The Astrophysical Journal, vol. 316, no. 2, pp. L55–L58, Jun. 1987. doi:10.1086/184891
1987 doi
-
[19]
XGBoost: A scalable tree boosting system,
T. Chen and C. Guestrin, “XGBoost: A scalable tree boosting system,” Proceedings of the 22nd ACM SIGKDD International Conference on Knowledge Discovery and Data Mining , pp. 785–794, Aug. 2016. doi:10.1145/2939672.2939785
2016
-
[20]
Y. Zhang, ”Classification of Quasars, Galaxies, and Stars by Using XGBoost in SDSS- DR16,” 2022 International Conference on Machine Learning and Knowledge Engineering (MLKE), Guilin, China, 2022, pp. 266-272, doi: 10.1109/MLKE55170.2022.00058
2022
-
[21]
Tchekhovskoy, A., Narayan, R., & McKinney, J. C. (2009). Black Hole Spin and the Radio Loud/Quiet Dichotomy of Active Galactic Nuclei. arXiv:0911.2228 [astro-ph.HE]
2009 arXiv
-
[22]
Schulze, A., Done, C., Lu, Y., Zhang, F., & Inoue, Y. (2017). Evidence for higher black hole spin in radio-loud quasars. arXiv:1710.01440 [astro-ph.GA]
2017 arXiv
-
[23]
Cunha, P. (2021). Investigating Obscured Quasars using Machine Learning . MSc Thesis, Universidade do Porto, Faculdade de Ciˆ encias, Departamento de F´ ısica e Astronomia. Supervisor: Dr. Andrew J. Humphrey. 20
2021
-
[24]
Abraham, V., Deville, J., & Kinariwala, G. (2024). The Application of Machine Learning to Quasar and Seyfert Classification. Research Notes of the AAS, 8(2), 46. DOI: 10.3847/2515- 5172/ad26f1
2024 doi
-
[25]
Boroson, T. A. (2002). Black Hole Mass and Eddington Ratio as Drivers for the Observable Properties of Radio-Loud and Radio-Quiet QSOs. The Astrophysical Journal, 565, 78–85. DOI: 10.1086/324486. arXiv: astro-ph/0109317
2002 arXiv
-
[26]
P., Hall, P
Schneider, D. P., Hall, P. B., Richards, G. T., et al. 2005, AJ, 130, 367. Available : https: //arxiv.org/abs/astro-ph/0503679
2005 arXiv
-
[27]
Bishop, C.M., Pattern Recognition and Machine Learning , Springer, 2006, Chapter 12, pp. 563–565. Available: https://www.microsoft.com/en-us/research/wp-content/ uploads/2006/01/Bishop-Pattern-Recognition-and-Machine-Learning-2006.pdf
2006
-
[28]
Goodfellow, I., Bengio, Y., Courville, A., Deep Learning, MIT Press, 2016, Chapter 2, pp. 45–50. Available: https://www.deeplearningbook.org/contents/linear_algebra. html
2016
-
[29]
Codes and the data set used can be found at https://github.com/RKJ246/SDSS-quasar- data-Classifier-ML-models/tree/main 21
-
[2023]
doi:10.1051/0004-6361/202243801
-
[2025]
doi:10.1038/s41598-025-93333-6
Reviewed August 16, 2026 · model on record in the stance chip above.
Discussion (0). Continue with ORCID to comment.