REVIEW 4 major objections 5 minor 82 references
Short Duration Stellar Flares in GALEX Data
T0 review · 4 major / 5 minor · reviewed 2026-08-14 · deepseek-v4-flash
Pith's one-line read Rebuilding GALEX's archive as 10-second ultraviolet light curves reveals roughly 1,900 short, small flares on sun-like stars that Kepler's 30-minute-cadence surveys missed.
desk verdict Solid detection of a genuinely new population of short NUV flares in GALEX/Kepler targets, but the headline power-law slope needs a cleaner fit and injection-recovery tests before it is trusted. read the letter →
The pith
A machine-rendered reading of the paper's core claim, the machinery that carries it, and where it could break.
The reading
What carries the argument
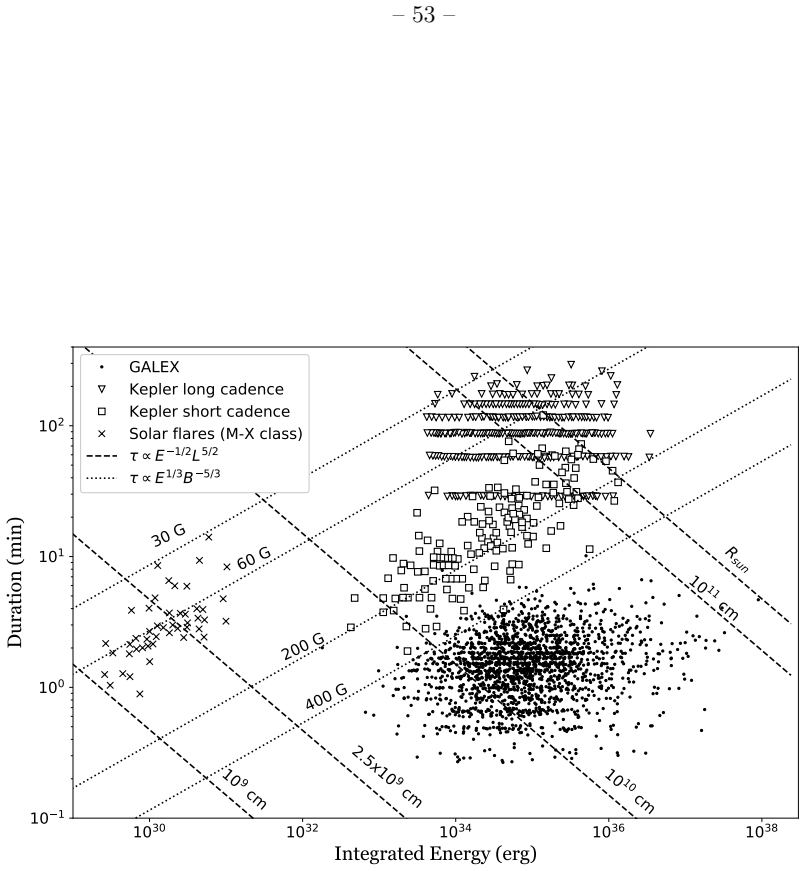
The central object is the 10-second-cadence near-ultraviolet light curve, built from GALEX's archived time-tagged photon events (5-millisecond time resolution) using the gPhoton software package; this cadence is what exposes flares of one to five minutes that 30-minute Kepler cadence smears into the quiescent baseline. The quantitative argument then rests on three identities: the flare frequency distribution of Eq. (7), $FF(E) = N(>E)/[N(E_{\rm det}\ge E)\,\tau(E)]$, which normalizes the cumulative energy distribution by the number of stars on which a flare of energy $E$ could be detected and their total observation time, with the minimum detectable energy per star computed from a synthetic three-point flare; the Clauset et al. (2009) maximum-likelihood power-law fit, which yields $\alpha = 1.72 \pm 0.05$; and the duration-energy scaling relations $\tau_{\rm fl} \propto E^{1/3}B^{-5/3}$ and $\tau_{\rm fl} \propto E^{-1/2}L^{5/2}$, derived from magnetic-reconnection timescales and magnetic energy release, which convert the observed short durations into field strengths of several hundred Gauss and active-region length scales near $10^{10}$ cm.
What would settle it
Injection-recovery is the decisive test: add synthetic flares with known energies and a spread of durations into the real GALEX light curves, run the full automatic-plus-manual detection pipeline, and compare the recovered energies with the injected ones; if the fictitious three-point flare overstates the survey's sensitivity, the completeness curve in Fig. 14 is wrong and the fitted $\alpha = 1.72 \pm 0.05$ shifts beyond its stated error. A second, inexpensive check is to re-vet the roughly 2,000 rejected 'maybe' candidates: if a substantial share turn out to be real microflares, the low-energy end of the frequency distribution steepens or flattens and the claimed population changes.
Extended reading notes
Core claim
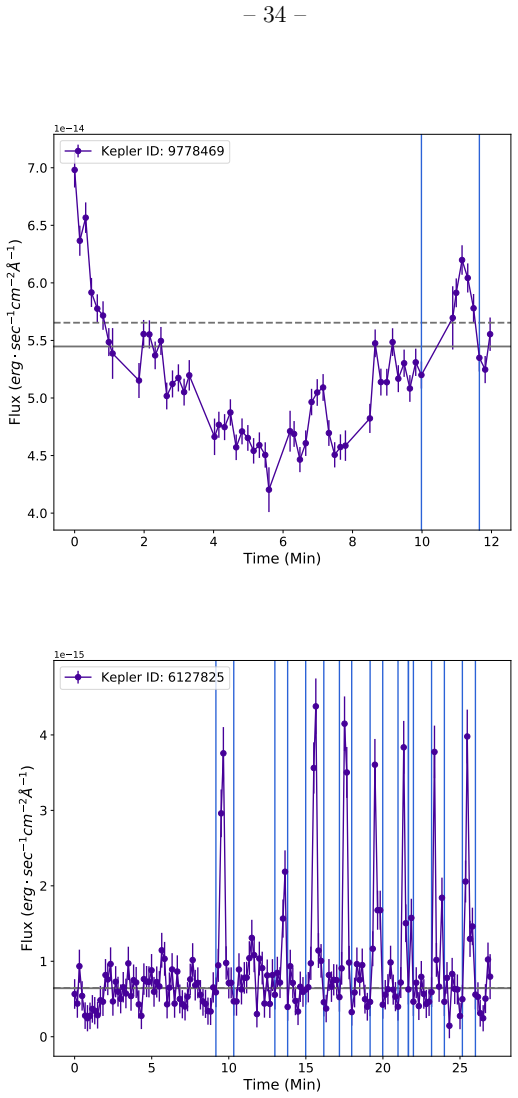
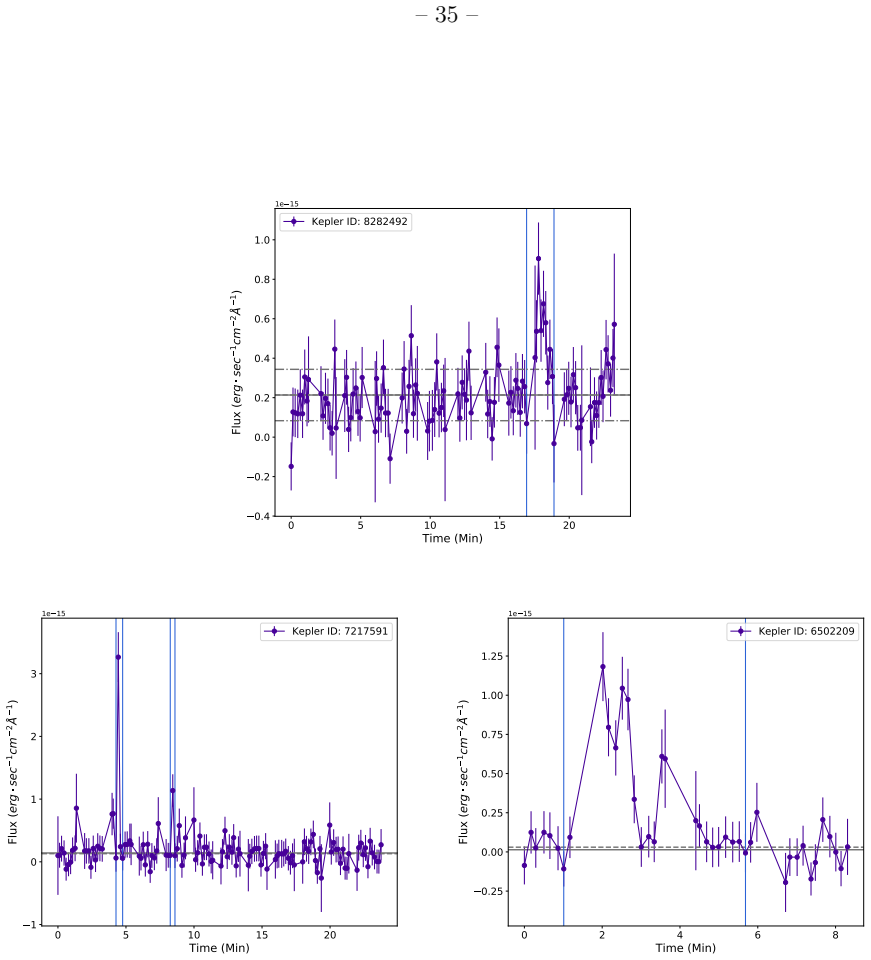
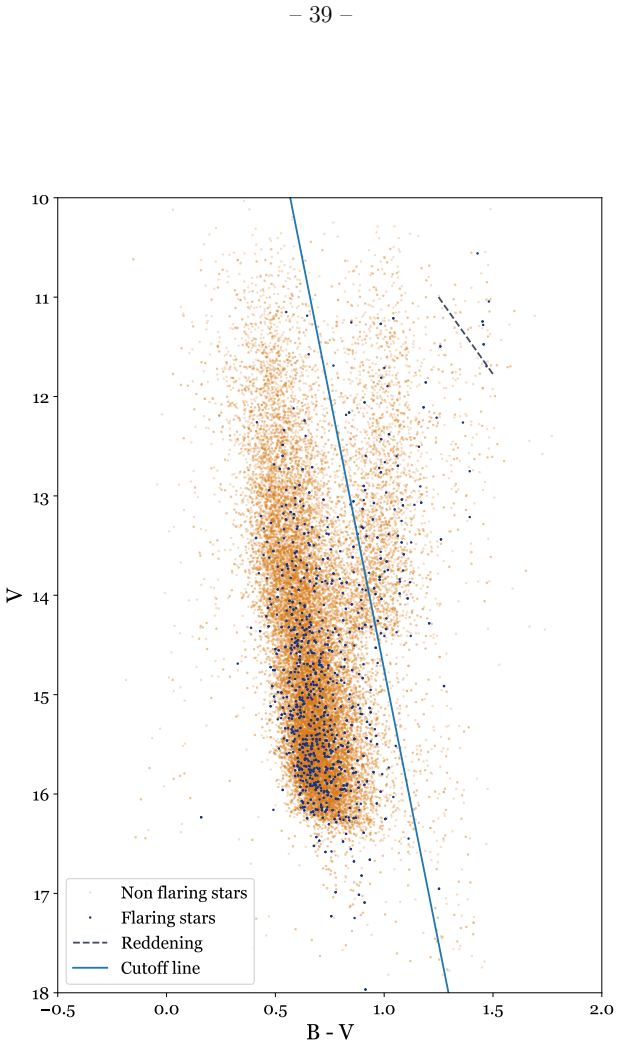
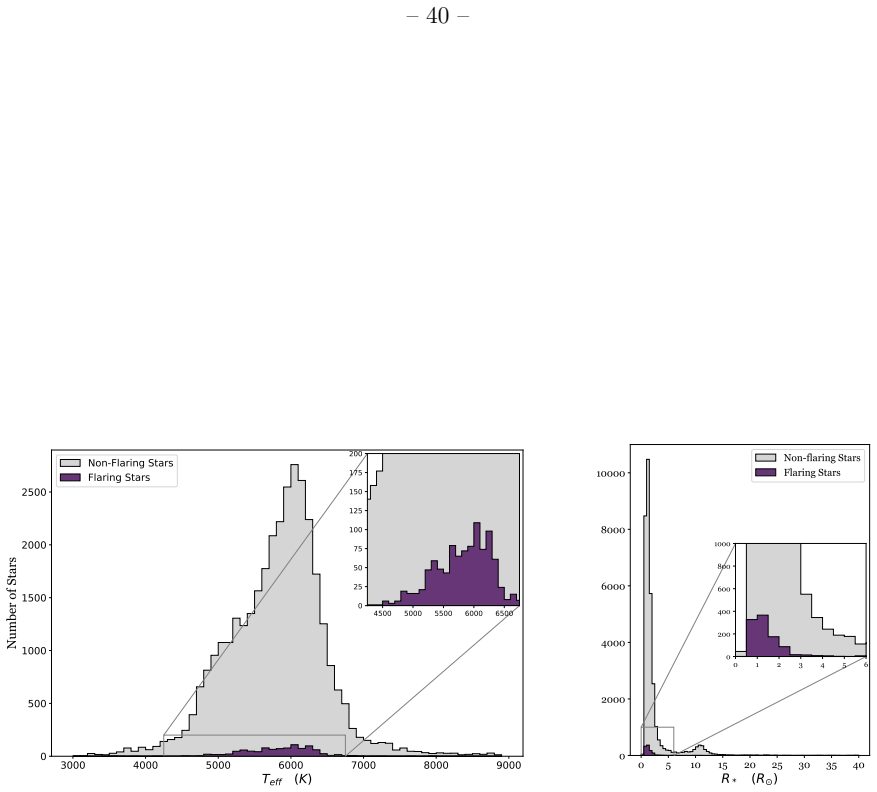
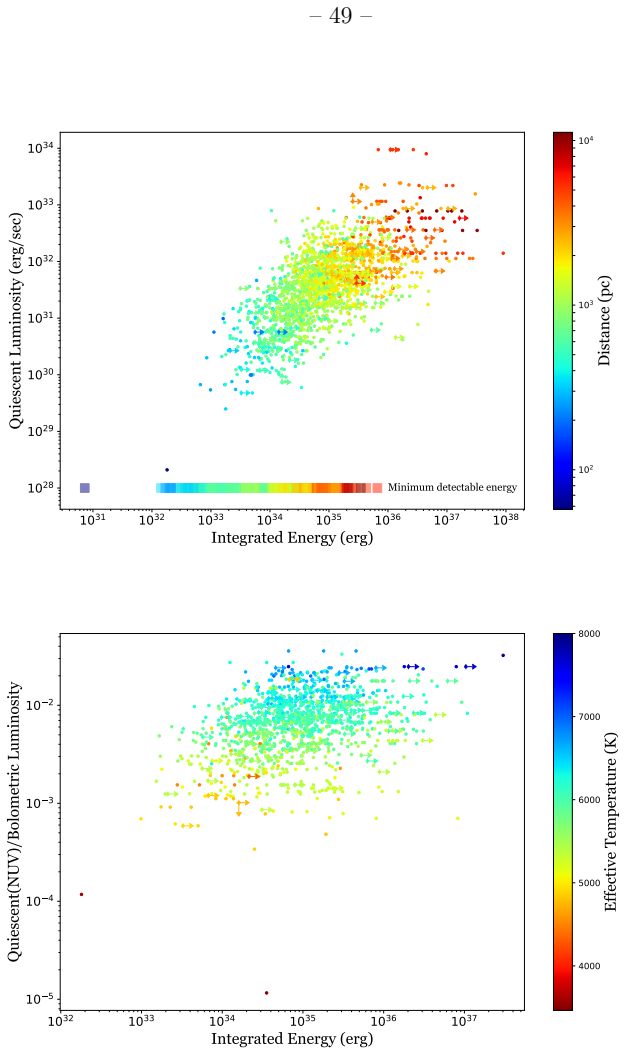
On its own terms, the paper's discovery is that short-duration near-ultraviolet flares form a large, previously uncatalogued population on Kepler-targeted main-sequence stars. Using the gPhoton package to reconstruct GALEX time-tagged photon events into 10-second NUV light curves, the authors detect 1,904 flares on 1,021 stars, with 94.5% of flare durations under five minutes, peak flux enhancements of 1.5 to 1700 above quiescence, and bolometric energies spanning $1.8\times10^{32}$ to $8.9\times10^{37}$ erg. The flare frequency distribution follows a power law with index $\alpha = 1.72 \pm 0.05$ and minimum energy $E_{\min} = 7.2\times10^{34}$ erg, consistent with solar and stellar flare studies from X-ray to optical wavelengths, which the paper reads as evidence that these NUV flares are governed by the same physical processes as solar and white-light flares. Extending the flare duration-energy relation from Maehara et al. (2015) and Namekata et al. (2018) to these short events places the flaring regions at magnetic field strengths of several hundred Gauss and length scales of order $10^{10}$ cm. Because only 13 of the 1,021 flaring stars appear in the Davenport (2016) Kepler flare catalog, the paper concludes that a previously undetected collection of small flares was contained within the Kepler sample, missed by coarser-cadence optical surveys.
Load-bearing premise
Everything about flare rates and the power-law slope rests on the completeness correction that decides how small a flare each star could reveal, a correction built from a fictitious three-point flare shape and from total observing time that ignores how observation intervals actually vary in length, a metric the paper itself calls 'not perfect', combined with the human decision to discard every uncertain 'maybe' candidate, many of which may be genuine microflares.
Editorial extensions
If this is right
- Kepler's optical flare catalogs miss most flaring stars: the 13-star overlap with the Davenport (2016) sample implies a population of small flares inside the Kepler field that only shows up at UV cadences of seconds.
- The power-law index $\alpha = 1.72 \pm 0.05$ sits inside the range of solar and stellar flare studies from X-ray to optical bands (1.52-2.32), strengthening the case that one physical mechanism, magnetic reconnection, governs flare energy release from solar microflares to stellar superflares.
- Even after filtering for solar-like temperature, radius, rotation, and quiescent NUV luminosity, the sample still contains flares up to $\sim10^{36}$ erg, so sun-like stars can release events orders of magnitude above the largest solar flares.
- With 94.5% of the flares shorter than five minutes, any census built on coarser time sampling, including Kepler's 30-minute optical survey, will undercount the most common events, and so will any estimate of flare-driven ultraviolet irradiation of exoplanet atmospheres that relies on optical catalogs.
- The duration-energy relation for these NUV flares extends the white-light flare scaling to much shorter durations, placing the emitting regions at magnetic field strengths of several hundred Gauss and length scales near $10^{10}$ cm.
Reading between the lines
- The roughly 2,000 rejected 'maybe' candidates, marginal peaks near the 3.5-sigma threshold, single-bin spikes, and non-FRED shapes, form a natural reservoir of microflares; re-vetting them statistically could extend the flare frequency distribution to lower energies and reveal whether the power law holds or flattens there.
- Because the paper's completeness metric ignores the uneven length of observation intervals, a re-analysis that weights intervals by their actual duration distribution could change the low-energy end of the flare rate; this is testable on the existing data before any new observations.
- The small overlap with optical Kepler flares may reflect cadence rather than genuinely different flare physics; combining the simultaneous Kepler light curves, which the paper says a follow-up will do, could detect the optical counterparts of these short NUV flares and turn the assumed energy partition, $p_{\rm bol} = 0.132$, into a measured one.
- For exoplanet habitability studies, the practical consequence of this paper, if right, is that ultraviolet doses driving ozone photolysis and atmospheric chemistry are underestimated by optical-only flare surveys, because the most frequent flares are the short ones those surveys cannot resolve.
Signed reviews
Editorial analysis
A structured set of objections, weighed in public.
Referee Report
Summary. This paper analyzes GALEX NUV light curves at 10-second cadence for 34,276 stars that were also observed by Kepler, and reports the detection of 1,904 short-duration flares on 1,021 main-sequence stars after an automated detection algorithm followed by manual Zooniverse vetting. The authors characterize flare durations, peak flux enhancements, and radiated energies, and derive a flare frequency distribution (FFD) that they fit with a power law of index α = 1.72 ± 0.05. They further claim that the flaring stars are almost entirely distinct from those in previous Kepler flare surveys, that this population represents a previously undetected collection of small flares inside the Kepler sample, and that the duration-energy relation implies active-region magnetic field strengths of several hundred Gauss and length scales of order 10^10 cm. The paper is organized around the detection pipeline, flare property measurements, aggregate statistics, and a discussion of stellar and flare physics implications.
Significance. If the central quantitative claims are robust, this would be a valuable new sample: the largest high-cadence NUV stellar flare catalog to date, with a machine-readable table of flare properties (Table 2), a transparent description of the detection thresholds, and an explicit attempt to characterize completeness. The claimed agreement of the FFD slope with solar and other stellar flare studies across wavelengths would support a common physical origin, and the short durations are a distinctive new observational constraint. The paper also carefully acknowledges several limitations, including the imperfect completeness metric in Eq. (7) and the subjective manual rejection of 'maybe' candidates. However, the headline statistical results—especially α = 1.72 ± 0.05—rest on a completeness correction that is not validated and a fit procedure that departs from the standard Clauset et al. (2009) methodology, so the aggregate FFD is not yet secure.
major comments (4)
- [§3.2.3, Eqs. (10)–(11)] The statistic D = max|S(E) − P(E)| is not the Kolmogorov-Smirnov statistic of Clauset et al. (2009), because S(E) and P(E) as defined in Eqs. (10) and (11) are not normalized cumulative distribution functions; they contain the energy-dependent factors 1/[N(Edet≥E)τ(E)]. Consequently, the fitted value Emin = 7.2 × 10^34 erg is not selected by a well-defined goodness-of-fit procedure, and the α computed from Eq. (8) is the truncation-only MLE that implicitly assumes all flares above Emin are observed. This is load-bearing for the headline claim of α = 1.72 ± 0.05 and its consistency with other surveys. The authors should instead fit α with a likelihood that incorporates the per-star, per-energy detection probability, or apply the Clauset KS test to the unbinned distribution after properly accounting for the selection function, and validate the procedure with injected synthetic flares.
- [§4.1 and Eq. (7)] The completeness correction is acknowledged by the authors to be imperfect because it does not account for the interval-length distribution, and the minimum-detectable-energy model is a synthetic three-point flare that does not capture the dependence of detection probability on flare duration or morphology. The residual selection effects are visible in Table 3: the distance-binned power-law indices (α = 1.95 ± 0.04 for d < 1000 pc, 2.15 ± 0.06 for 1000 < d < 1500 pc, and 1.75 ± 0.08 for d > 1500 pc) are mutually inconsistent at roughly the 4σ level, indicating that the completeness correction does not fully remove sensitivity biases. The authors should demonstrate, via injection-recovery of synthetic flares spanning a range of energies, durations, and interval placements, that the FFD analysis recovers the input power-law slope and that the fitted α is stable across distance and interval-length subsamples.
- [§2, Step 5] The manual inspection rejects 2,478 'maybe' candidates, which the text itself states are likely to include genuine microflares while others are statistical noise. This is a subjective and likely energy-dependent selection step, since low-significance and single-bin events are preferentially classified as 'maybe'. Because the low-energy end of the FFD is directly affected, the fitted α and Emin could be biased. The authors should quantify the sensitivity of the FFD to this decision, for example by re-fitting with a subset of 'maybe' events included under explicit assumptions, or by injecting synthetic flares of known energy into the light curves to calibrate the manual classification and measure the completeness as a function of energy.
- [§4.2.3 and Fig. 21] The inference that the flares originate in regions with magnetic field strengths exceeding several hundred Gauss and length scales near 10^10 cm relies on the duration-energy scaling relations, but within the GALEX sample there is no clear duration-energy correlation (Fig. 19 and the statement in §5 that 'we do not see a dependence between flare duration and energy'). If the interpretation depends on combining the GALEX sample with solar and Kepler white-light flares, the different selection functions and the large scatter in the GALEX data must be propagated explicitly. The authors should quantify the uncertainty in the derived B and L values, including the factor-of-2–3 systematic uncertainty in the NUV energy conversion noted in §3.2.3 from Kowalski et al. (2018).
minor comments (5)
- [Eq. (1)] The summation index t is not defined; please specify that the sum runs over the time bins belonging to the flare.
- [§2] The aperture radius is given as 0.004°; for readability and reproducibility, consider also stating the value in arcseconds.
- [Abstract and §4.2.3] The phrase 'extends results found for solar and stellar white-light flares' is stronger than the internal data support given the absence of a significant duration-energy correlation within the GALEX sample; the wording should be softened or qualified.
- [Table 3] The quoted uncertainties on the binned α values do not include systematic errors from the completeness correction or from energy calibration; adding such terms would make the comparisons across distance bins more meaningful.
- [§3.2.3] The energy partition pbol = 0.132 is adopted from Osten & Wolk (2015) without a dedicated uncertainty; given the Kowalski et al. (2018) result that the blackbody assumption can underestimate NUV energy by factors of 2–3, a systematic uncertainty on pbol should be propagated into Ebol and Emin.
Circularity Check
No circularity: α=1.72±0.05 is a maximum-likelihood fit to the measured energies, and the co-authored pbol conversion is a constant rescaling that cannot drive the power-law index.
full rationale
The central derivation chain is empirical rather than circular. The 1,904 flares are identified from the GALEX light curves by an independent detection algorithm, and the durations, peak enhancements, and fluences are measured directly from the light curves. The aggregate flare frequency distribution is built from those measured energies: Equations (5)-(8) assume a power law and use the Clauset et al. maximum-likelihood estimator to fit α and E_min to the observed energies, so α=1.72±0.05 is a fit to the data, not a quantity predicted from an input that already contains it. The energy partition p_bol=0.132 is taken from Osten & Wolk (2015), which includes a co-author, but it is an external physical conversion; since all flare energies are multiplied by the same constant, it cannot affect the power-law index, and at most it rescales the absolute energy axis entering the duration-energy interpretation. The genuinely load-bearing assumptions are the completeness correction in Equation (7) and the rejection of the 'maybe' candidates, and the paper itself flags the completeness metric as 'not perfect' because it ignores interval-length differences. Those are statistical-validity and sensitivity concerns, not circularity: the fit is not defined in terms of its own output, no fitted parameter is renamed as a prediction, and no uniqueness claim is imported from a self-citation. The comparisons against Davenport (2016), Maehara et al. (2015), Namekata et al. (2018), and the other surveys in Table 4 are external benchmarks, so the paper is self-contained for its headline claims.
Assumptions & free parameters
free parameters (5)
- Peak sigma threshold =
3.5σ
- Interval gap threshold =
1600 s
- Power-law index α =
1.72 ± 0.05
- Minimum power-law energy E_min =
7.20×10^34 erg
- Bolometric energy partition p_bol =
0.132
assumptions (5)
- standard math Photon counts in each 10-s bin follow Poisson statistics
- domain assumption The median light-curve level approximates the quiescent flux
- domain assumption The NUV flare emission is dominated by a hot blackbody with the Osten & Wolk (2015) energy partition
- domain assumption The flare energy distribution follows a power law above some E_min
- ad hoc to paper The completeness correction in Eq. (7) is adequate for the flare frequency distribution
Cite this review
Pith. "Pith review of Short Duration Stellar Flares in GALEX Data." pith.science (2026). https://pith.science/paper/PCD2VNOF
@misc{pith2026190808377,
  author       = {Pith},
  title        = {Pith review of: Short Duration Stellar Flares in GALEX Data},
  year         = {2026},
  howpublished = {\url{https://pith.science/paper/PCD2VNOF}},
  note         = {Machine review of arXiv:1908.08377}
}
abstract
We report on a population of short duration near-ultraviolet (NUV) flares in stars observed by the Kepler and GALEX missions. We analyzed NUV light curves of 34,276 stars observed from 2009-2013 by both the GALEX (NUV) and Kepler (optical) space missions with the eventual goal of investigating multi-wavelength flares. From the GALEX data we constructed light curves with a 10 second cadence, and ultimately detected 1,904 short duration flares on 1,021 stars. The vast majority (94.5\%) of these flares have durations less than five minutes, with flare flux enhancements above the quiescent flux level ranging from 1.5 to 1700. The flaring stars are primarily solar-like, with T$_{\rm eff}$ ranging from 3,000-11,000 K and radii between 0.5-15 R$_{\odot}$. This set of flaring stars is almost entirely distinct from that of previous flare surveys of Kepler data and indicates a previously undetected collection of small flares contained within the Kepler sample. The range in flare energies spans 1.8$\times$10$^{32}$-8.9$\times$10$^{37}$ erg, with associated relative errors spanning 2-87\%. The flare frequency distribution by energy follows a power-law with index $\alpha=1.72\pm0.05$, consistent with results of other solar and stellar flare studies at a range of wavelengths. This supports the idea that the NUV flares we observe are governed by the same physical processes present in solar and optical flares. The relationship between flare duration and associated flare energy extends results found for solar and stellar white-light flares, and suggests that these flares originate in regions with magnetic field strengths of several hundred Gauss, and length scales of order 10$^{10}$ cm.
Figures

Figures from the paper (18 more)






Reference graph
Works this paper leans on
-
[1]
, " * write output.state after.block = add.period write newline
ENTRY address archivePrefix author booktitle chapter doi edition editor eprint howpublished institution journal key month note number organization pages publisher school series title type volume year label extra.label sort.label short.list INTEGERS output.state before.all mid.sentence after.sentence after.block FUNCTION init.state.consts #0 'before.all :=...
-
[2]
write newline
" write newline "" before.all 'output.state := FUNCTION format.doi doi empty "" "doi:" doi * if FUNCTION format.eprint eprint empty "" archivePrefix empty "" archivePrefix ":" * if eprint field.or.null * if FUNCTION format.pid eprint empty format.doi format.eprint if FUNCTION n.dashify 't := "" t empty not t #1 #1 substring "-" = t #1 #2 substring "--" = ...
-
[3]
Stellar Activity Effects on Moist Habitable Terrestrial Atmospheres Around M dwarfs
Afrin Badhan , M., Wolf , E. T., Kopparapu , R. K., et al. 2019, arXiv e-prints, arXiv:1902.04086
work page Pith review arXiv 2019
-
[4]
Aschwanden , M. J., Tarbell , T. D., Nightingale , R. W., et al. 2000, , 535, 1047
work page 2000
-
[5]
Audard , M., G \"u del , M., & Guinan , E. F. 1999, , 513, L53
work page 1999
-
[6]
Bailer-Jones , C. A. L., Rybizki , J., Fouesneau , M., Mantelet , G., & Andrae , R. 2018, , 156, 58
2018
-
[7]
Balona , L. A. 2015, , 447, 2714
2015
-
[8]
Barnes , S. A. 2003, , 586, 464
work page 2003
Show all 82 references
-
[9]
1987, , 316, 377
Basri , G. 1987, , 316, 377
1987
-
[10]
Basri , G., Laurent , R., & Walter , F. M. 1985, , 298, 761
1985
-
[11]
M., Borucki , W
Batalha , N. M., Borucki , W. J., Koch , D. G., et al. 2010, , 713, L109
2010
-
[12]
O., & G \"u del , M
Benz , A. O., & G \"u del , M. 2010, , 48, 241
2010
-
[13]
A., Huber , D., Gaidos , E., & van Saders , J
Berger , T. A., Huber , D., Gaidos , E., & van Saders , J. L. 2018, , 866, 99
2018
-
[14]
M., Latham , D
Brown , T. M., Latham , D. W., Everett , M. E., & Esquerdo , G. A. 2011, , 142, 112
2011
-
[15]
C., Tandberg-Hanssen , E., Bruner , E
Cheng , C. C., Tandberg-Hanssen , E., Bruner , E. C., et al. 1981, , 248, L39
1981
-
[16]
R., & Newman , M
Clauset , A., Shalizi , C. R., & Newman , M. E. J. 2009, SIAM Review, 51, 661
2009
-
[17]
Davenport , J. R. A. 2016, , 829, 23
2016
-
[18]
Davenport , J. R. A., Covey , K. R., Clarke , R. W., et al. 2019, , 871, 241
2019
-
[19]
Davenport , J. R. A., Kipping , D. M., Sasselov , D., Matthews , J. M., & Cameron , C. 2016, , 829, L31
2016
-
[20]
R., & Schwartz , R
Dennis , B. R., & Schwartz , R. A. 1989, , 121, 75
1989
-
[21]
Donati , J.-F., & Landstreet , J. D. 2009, , 47, 333
2009
-
[22]
G., Shetye , J., Antonova , A
Doyle , J. G., Shetye , J., Antonova , A. E., et al. 2018, , 475, 2842
2018
-
[23]
E., Howell , S
Everett , M. E., Howell , S. B., & Kinemuchi , K. 2012, , 124, 316
2012
-
[24]
2018, , 620, A55
Flaccomio , E., Micela , G., Sciortino , S., et al. 2018, , 620, A55
2018
-
[25]
Fletcher , L., & Warren , H. P. 2003, in Lecture Notes in Physics, Berlin Springer Verlag, Vol. 612, Energy Conversion and Particle Acceleration in the Solar Corona, ed. L. Klein , 58--79
2003
-
[26]
M., Stancil , P
Fontenla , J. M., Stancil , P. C., & Landi , E. 2015, , 809, 157
2015
-
[27]
S., Linsky , J
France , K., Froning , C. S., Linsky , J. L., et al. 2013, , 763, 149
2013
-
[28]
E., Paudel , R
Gizis , J. E., Paudel , R. R., Mullan , D., et al. 2017, , 845, 33
2017
-
[29]
G \'o mez de Castro , A. I. 2002, , 332, 409
2002
-
[30]
Green, G. M. 2018, Journal of Open Source Software, 3, 695
2018
-
[31]
G., Micela , G., Sciortino , S., et al
Guarcello , M. G., Micela , G., Sciortino , S., et al. 2019, arXiv e-prints, arXiv:1901.07263
2019 arXiv
-
[32]
M., Slee , O
Haisch , B. M., Slee , O. B., Siegman , B. C., et al. 1981, , 245, 1009
1981
-
[33]
L., Davenport , J
Hawley , S. L., Davenport , J. R. A., Kowalski , A. F., et al. 2014, , 797, 121
2014
-
[34]
L., & Pettersen , B
Hawley , S. L., & Pettersen , B. R. 1991, , 378, 725
1991
-
[35]
L., Walkowicz , L
Hawley , S. L., Walkowicz , L. M., Allred , J. C., & Valenti , J. A. 2007, Publications of the Astronomical Society of the Pacific, 119, 67
2007
-
[36]
L., Allred , J
Hawley , S. L., Allred , J. C., Johns-Krull , C. M., et al. 2003, , 597, 535
2003
-
[37]
2014, , 794, L23
Heinzel , P., & Kleint , L. 2014, , 794, L23
2014
-
[38]
S., Tilley , M
Howard , W. S., Tilley , M. A., Corbett , H., et al. 2018, , 860, L30
2018
-
[39]
M., et al
Huber , D., Silva Aguirre , V., Matthews , J. M., et al. 2014, , 211, 2
2014
-
[40]
2016, , 816, 88
Kleint , L., Heinzel , P., Judge , P., & Krucker , S. 2016, , 816, 88
2016
-
[41]
F., Allred , J
Kowalski , A. F., Allred , J. C., Daw , A., Cauzzi , G., & Carlsson , M. 2017, , 836, 12
2017
-
[42]
F., Hawley , S
Kowalski , A. F., Hawley , S. L., Holtzman , J. A., Wisniewski , J. P., & Hilton , E. J. 2010, , 714, L98
2010
-
[43]
F., Hawley , S
Kowalski , A. F., Hawley , S. L., Wisniewski , J. P., et al. 2013, , 207, 15
2013
-
[44]
F., Wisniewski , J
Kowalski , A. F., Wisniewski , J. P., Hawley , S. L., et al. 2018, ArXiv e-prints, arXiv:1811.04021
2018 arXiv
-
[45]
2000, Geophysical Research Letters, 27, 2425
Lean , J. 2000, Geophysical Research Letters, 27, 2425
2000
-
[46]
Linsky , J. L. 2017, Annual Review of Astronomy and Astrophysics, 55, 159
2017
-
[47]
J., Schawinski , K., Slosar , A., et al
Lintott , C. J., Schawinski , K., Slosar , A., et al. 2008, , 389, 1179
2008
-
[48]
Loyd , R. O. P., France , K., Youngblood , A., et al. 2018, , 867, 71
2018
-
[49]
2015, Earth, Planets, and Space, 67, 59
Maehara , H., Shibayama , T., Notsu , Y., et al. 2015, Earth, Planets, and Space, 67, 59
2015
-
[50]
2012, , 485, 478
Maehara , H., Shibayama , T., Notsu , S., et al. 2012, , 485, 478
2012
-
[51]
D., Bianchi , L., Donas , J., et al
Martin , C. D., Bianchi , L., Donas , J., et al. 1999, in Astronomical Society of the Pacific Conference Series, Vol. 164, Ultraviolet-Optical Space Astronomy Beyond HST, ed. J. A. Morse , J. M. Shull , & A. L. Kinney , 182
1999
-
[52]
2014, VizieR Online Data Catalog, J/ApJS/211/24
McQuillan , A., Mazeh , T., & Aigrain , S. 2014, VizieR Online Data Catalog, J/ApJS/211/24
2014
-
[53]
W., Shiao , B., et al
Million , C., Fleming , S. W., Shiao , B., et al. 2016, , 833, 292
2016
-
[54]
K., Williams , D
Mitra-Kraev , U., Harra , L. K., Williams , D. R., & Kraev , E. 2005, , 436, 1041
2005
-
[55]
P., West , A
Morgan , D. P., West , A. A., & Becker , A. C. 2016, , 151, 114
2016
-
[56]
A., et al
Morrissey , P., Conrow , T., Barlow , T. A., et al. 2007, The Astrophysical Journal Supplement Series, 173, 682
2007
-
[57]
M., & Ofman , L
Nakariakov , V. M., & Ofman , L. 2001, , 372, L53
2001
-
[58]
2018, ArXiv e-prints, arXiv:1804.07122
Namekata , K., Sakaue , T., Watanabe , K., et al. 2018, ArXiv e-prints, arXiv:1804.07122
2018 arXiv
-
[59]
2014, Publications of the Astronomical Society of Japan, 66, L4
Nogami , D., Notsu , Y., Honda , S., et al. 2014, Publications of the Astronomical Society of Japan, 66, L4
2014
-
[60]
2019, arXiv e-prints, arXiv:1904.00142
Notsu , Y., Maehara , H., Honda , S., et al. 2019, arXiv e-prints, arXiv:1904.00142
2019 arXiv
-
[61]
2016, in Heliophysics -- Active Stars, their Astrospheres, and Impacts on Planetary EnvironmentsT, ed
Osten, R. 2016, in Heliophysics -- Active Stars, their Astrospheres, and Impacts on Planetary EnvironmentsT, ed. C. J. Schrijver, F. Bagenal, & J. J. Sojka (Cambridge: Cambridge University Press), 23--55
2016
-
[62]
A., & Bastian , T
Osten , R. A., & Bastian , T. S. 2006, , 637, 1016
2006
-
[63]
A., Hawley , S
Osten , R. A., Hawley , S. L., Allred , J. C., Johns-Krull , C. M., & Roark , C. 2005, , 621, 398
2005
-
[64]
A., Kowalski , A., Sahu , K., & Hawley , S
Osten , R. A., Kowalski , A., Sahu , K., & Hawley , S. L. 2012, , 754, 4
2012
-
[65]
A., & Wolk , S
Osten , R. A., & Wolk , S. J. 2009, , 691, 1128
2009
-
[66]
2015, , 809, 79
---. 2015, , 809, 79
2015
-
[67]
A., Kowalski , A., Drake , S
Osten , R. A., Kowalski , A., Drake , S. A., et al. 2016, , 832, 174
2016
-
[68]
R., Gizis , J
Paudel , R. R., Gizis , J. E., Mullan , D. J., et al. 2018, , 858, 55
2018
-
[69]
B., Allred , J
Paulson , D. B., Allred , J. C., Anderson , R. B., et al. 2006, , 118, 227
2006
-
[70]
D., Carpenter , K
Robinson , R. D., Carpenter , K. G., Percival , J. W., & Bookbinder , J. A. 1995, , 451, 795
1995
-
[71]
D., Wheatley , J
Robinson , R. D., Wheatley , J. M., Welsh , B. Y., et al. 2005, , 633, 447
2005
-
[72]
2012, SVO Filter Profile Service Version 1.0 , Tech
Rodrigo , C., Solano , E., & Bayo , A. 2012, SVO Filter Profile Service Version 1.0 , Tech. rep
2012
-
[73]
2013, The Astrophysical Journal Supplement Series, 209, 5
Shibayama , T., Maehara , H., Notsu , S., et al. 2013, The Astrophysical Journal Supplement Series, 209, 5
2013
-
[74]
1972, , 171, 565
Skumanich , A. 1972, , 171, 565
1972
-
[75]
Stelzer , B., Schmitt , J. H. M. M., Micela , G., & Liefke , C. 2006, , 460, L35
2006
-
[76]
A., Schmitt , J
Stern , R. A., Schmitt , J. H. M. M., & Kahabka , P. T. 1995, , 448, 683
1995
-
[77]
L., Mauas , P
Tian , F., France , K., Linsky , J. L., Mauas , P. J. D., & Vieytes , M. C. 2014, Earth and Planetary Science Letters, 385, 22
2014
-
[78]
2002, , 382, 1070
Veronig , A., Temmer , M., Hanslmeier , A., Otruba , W., & Messerotti , M. 2002, , 382, 1070
2002
-
[79]
Y., Wheatley , J., Browne , S
Welsh , B. Y., Wheatley , J., Browne , S. E., et al. 2006, , 458, 921
2006
-
[80]
J., Harnden , Jr., F
Wolk , S. J., Harnden , Jr., F. R., Flaccomio , E., et al. 2005, , 160, 423
2005
-
[81]
2015, , 798, 92
Wu , C.-J., Ip , W.-H., & Huang , L.-C. 2015, , 798, 92
2015
-
[82]
B., Liu , X
Yuan , H. B., Liu , X. W., & Xiang , M. S. 2013, , 430, 2188
2013
Reviewed August 14, 2026 · model on record in the stance chip above.
Discussion (0). Continue with ORCID to comment.