REVIEW 2 major objections 5 minor 48 references
Studying the Variable Continuum and Emission Line Spectrum of 4U 1700-377 using NuSTAR's Stray Light
T0 review · 2 major / 5 minor · reviewed 2026-07-13 · grok-4.5
Pith's one-line read Long quiet spells in 4U 1700-377 show a softer continuum without extra absorption, pointing to rarefied wind or a regime change.
desk verdict Solid NuSTAR stray-light expansion of 4U 1700-377 that cleanly quantifies two long low states and a careful CRSF non-detection; model dependence is real but already flagged by the authors. read the letter →
The pith
A machine-rendered reading of the paper's core claim, the machinery that carries it, and where it could break.
The reading
What carries the argument
NuSTAR stray-light spectra (combined with the two focused observations) that supply a multi-year baseline and allow isolation of the low-flux intervals; continuum models (primarily highecut and thcomp) used to track photon index, cutoff energies and column density across those states.
What would settle it
A high-resolution soft X-ray spectrum (for example with XRISM-Resolve) taken during a similarly long low-flux interval that either shows clear rarefied-wind fluorescence signatures matching the continuum softening, or reveals a stable cyclotron line whose parameters are independent of continuum choice.
Extended reading notes
Core claim
In two extended low-flux intervals of up to 60 ks, the source luminosity falls by almost an order of magnitude and the high-energy continuum softens significantly, yet the absorbing column does not increase correspondingly. The authors argue that this continuum change is consistent with accretion from an extended rarefied interval of the companion's stellar wind or with a possible shift in the dominant accretion regime.
Load-bearing premise
That the chosen continuum models correctly separate the true spectral shape from residual emission or absorption features, so the reported softening and the non-detection of a cyclotron line are physical rather than model artifacts.
Editorial extensions
If this is right
- Continuum shape during multi-tens-of-ks quiet periods can be used as a direct tracer of density structure in the stellar wind of wind-fed high-mass X-ray binaries.
- Claims of a cyclotron resonant scattering feature in 4U 1700-377 remain unsupported once the multi-year stray-light baseline is included.
- Fluorescent lines above iron K-alpha are variable and model-dependent, so higher-resolution spectroscopy is required before they can map large-scale accretion geometry.
- The soft excess present in every observation is consistent with photo-ionized wind emission a few hundred kilometers from the compact object.
Reading between the lines
- If rarefied-wind intervals of tens of ks are common, long-term monitoring of continuum hardness could map the clump size distribution of the companion wind without needing continuous high-cadence light curves.
- Absence of a robust cyclotron line continues to leave open the possibility that the compact object is not a strongly magnetized neutron star, tightening the need for independent spin or mass measurements.
- The same stray-light technique can be applied to other bright galactic-ridge sources to recover multi-year spectral baselines that focused observations alone cannot supply.
Editorial analysis
A structured set of objections, weighed in public.
Referee Report
Summary. The manuscript presents a multi-epoch spectral analysis of the wind-fed HMXB 4U 1700-377 using two focused NuSTAR observations plus five usable stray-light detections (total ~881 ks baseline). Continuum models (highecut, NPEX, thcomp, COMPMAG) are compared; Fe Kα is ubiquitous, excess emission above 6.4 keV is detected at >3σ but remains model-dependent, and no statistically required CRSF is found in either focused or stray-light spectra. The central new result is the characterization of two sustained low-flux intervals (up to ~60 ks) in which unabsorbed luminosity drops by a factor of ~6 and the high-energy continuum softens (higher photon index, higher kTe under thcomp) without a corresponding rise in NH, interpreted as accretion from a rarefied inter-clump wind or a possible change in accretion regime.
Significance. The work usefully expands the observational baseline for a highly variable source by exploiting the public StrayCats catalog and published nuskybgd pipelines, providing a transparent, multi-model view of continuum and line variability. The low-state result is observationally well-supported and, if confirmed, supplies a concrete example of how density structure in a clumpy stellar wind can modulate emission close to the compact object on tens-of-ks timescales. The careful treatment of background, dual-model checks, and explicit mapping of CRSF confidence intervals are strengths that make the data products reusable. The paper does not claim a definitive identification of the compact object or a unique physical model for the low states, which keeps the conclusions appropriately scoped.
major comments (2)
- [§3.4 / Table 4] §3.4 and Table 4: for the stray-light low-state spectrum the exponential-cutoff parameters are frozen to the focused low-state values. While photon statistics are limited, the freeze assumes the two low states share the same continuum shape; a short sensitivity test (freezing only one parameter or reporting the free-fit upper limits) would strengthen the claim that the photon-index change is robust rather than imposed.
- [§3.4 / Figure 7] §3.4 / Figure 7: the highecut fit to the focused low-state spectrum is formally poor (χ² ≈ 388/292) with systematic negative residuals 10–20 keV. The authors correctly prefer thcomp and note that an unconstrained gabs does not improve the physical description, but a brief quantitative statement of how much the photon-index difference between flaring and low states changes when the residual is absorbed by a free gabs (or by allowing Efold free) would close the remaining model-dependence concern for the softening claim.
minor comments (5)
- [global] Throughout: several residual draft artifacts remain (e.g., “V ariable”, “N)ST AR”, “lig tcurve”, “Co(nts”, “Ti e”, “da a -model”). A final proof-reading pass is needed.
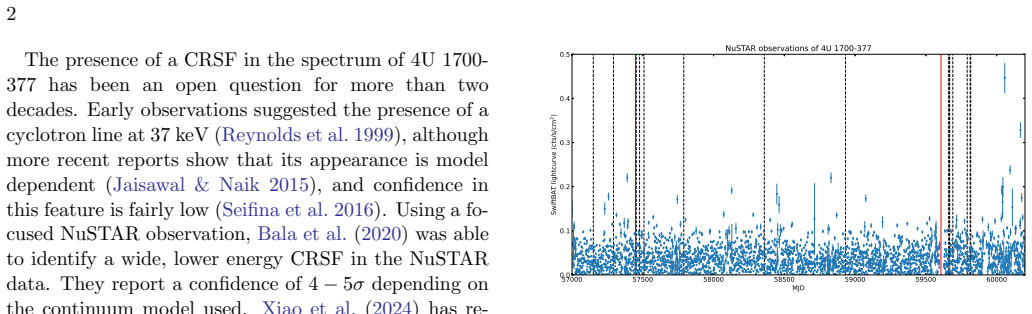
- [Figure 1] Figure 1 caption and axis labels contain OCR-like corruption; the Swift/BAT light-curve units and the distinction between solid/dashed vertical lines should be cleaned for production.
- [Tables 2, A1] Table 2 and Table A1: the constant (FPMB) factor is reported with inconsistent precision; a uniform format (e.g., three decimal places) would aid comparison.
- [§2] §2: the choice of Kaastra & Bleeker (2016) binning is appropriate, but a one-sentence note that no minimum-counts cut was imposed (and that C-stat was used for the lowest-S/N stray-light spectra) would clarify the fitting statistics.
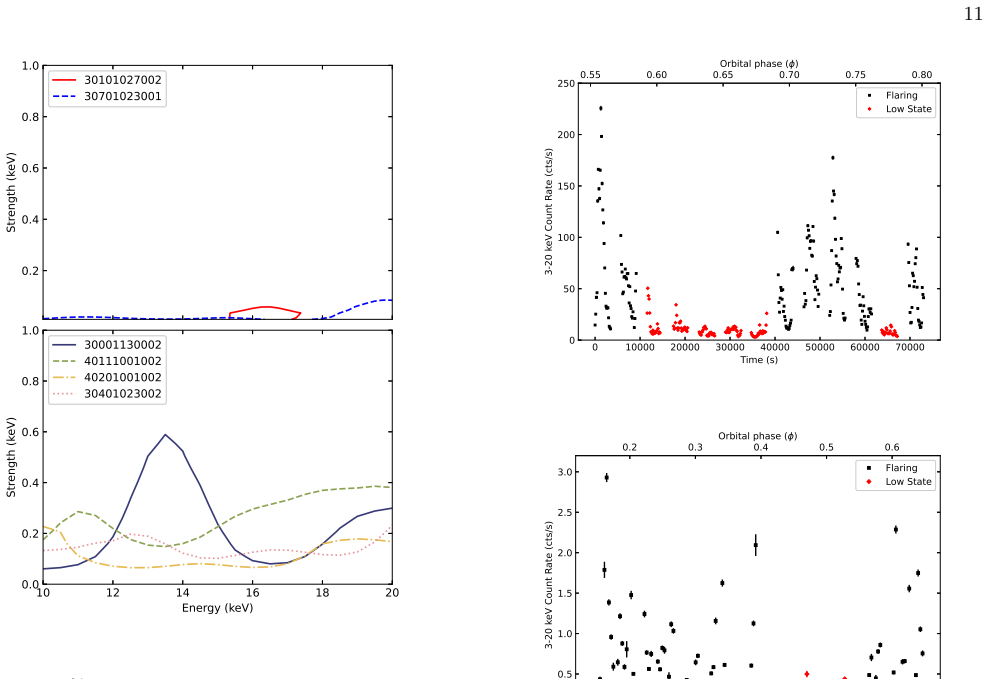
- [Appendix A] Appendix A figures: the extraction-region images (Fig. A1) and light curves (Fig. A2) are useful; adding the orbital-phase range of each filtered low-state interval directly on the light-curve panels would make the time selection fully self-contained.
Circularity Check
No significant circularity: observational spectral fitting of public NuSTAR data with free continuum parameters; claims do not reduce to inputs by construction.
full rationale
The paper is a standard multi-epoch spectral analysis of 4U 1700-377 using two focused and five usable stray-light NuSTAR observations. Continuum models (highecut, NPEX, thcomp, COMPMAG) are chosen for fit quality and consistency with prior literature; parameters (NH, photon index, Ecut, Efold, kTe, blackbody temperatures, line centroids) are free and reported with 90% uncertainties (Tables 2–4, A1). The central claim—two sustained low-flux intervals of ~40–60 ks in which luminosity drops by a factor of ~6 and the continuum softens without a corresponding rise in absorption—is obtained by time-filtering light curves (Fig. 6), extracting spectra, and refitting the same free models (Tables 3–4, Figs. 7–8). Softening appears under both highecut and thcomp; NH is consistent or lower in the low state. Emission-line and CRSF searches are likewise free-parameter tests (simftest, gabs grids) that return non-detections or model-dependent features, which the authors explicitly flag. Self-citations (StrayCats catalog, prior NuSTAR analyses of the same source, nuskybgd) supply data-reduction tools and context, not uniqueness theorems or closed-loop definitions that force the present results. No step equates a fitted quantity to a “prediction” by construction, and no load-bearing uniqueness is imported from overlapping authors. The derivation chain is therefore self-contained against external public data and free spectral fits.
Assumptions & free parameters
free parameters (2)
- NH, photon index, Ecut/Efold or kTe, blackbody kT and norm, Gaussian line energies/norms
- instrumental-lines background normalization
assumptions (3)
- domain assumption Accretion is driven by a clumped stellar wind whose density variations produce the observed flares and low states (Bondi-Hoyle framework of Ducci et al. 2009).
- domain assumption Phenomenological cutoff power-law and thermal-Comptonization models adequately describe the continuum so that residuals can be attributed to lines or CRSFs.
- domain assumption nuskybgd correctly models the non-focused background components for stray-light extraction regions.
Cite this review
Pith. "Pith review of Studying the Variable Continuum and Emission Line Spectrum of 4U 1700-377 using NuSTAR's Stray Light." pith.science (2026). https://pith.science/paper/PECOPNCE
@misc{pith2026260708876,
  author       = {Pith},
  title        = {Pith review of: Studying the Variable Continuum and Emission Line Spectrum of 4U 1700-377 using NuSTAR's Stray Light},
  year         = {2026},
  howpublished = {\url{https://pith.science/paper/PECOPNCE}},
  note         = {Machine review of arXiv:2607.08876}
}
abstract
The high-mass X-ray binary 4U 1700-377 shows strong variation in brightness on timescales of hundreds of seconds due to accretion from a highly clumped stellar wind from the companion. Using two focused observations and five stray light observations from NuSTAR, we are able to expand the baseline of observations of the source and track spectral parameters throughout the source's variability. The focused NuSTAR observations confidently detect excess emission lines at energies above Fe K$\alpha$, but are unable to universally constrain the nature of these lines independently of model choice. Strong Fe K$\alpha$ fluorescence is ubiquitous in the stray light data, but these observations lack sufficient signal-to-noise to further measure additional emission lines. We discuss the statistics of a claimed cyclotron resonant scattering feature as seen in the stray light spectra, but find no conclusive evidence for its existence. Finally, we investigate two instances of sustained low-flux states of up to 60 ks. When this occurs, luminosity can fall by almost an order of magnitude and the high-energy continuum softens significantly without corresponding to increased absorption. We discuss the manner in which the changing shape of the continuum during these intervals may show accretion during an extended rarefied interval of stellar wind, or a possible change of the dominant accretion regime.
Figures


Figures from the paper (4 more)



Reference graph
Works this paper leans on
-
[1]
2021, A&A, 648, A105, doi: 10.1051/0004-6361/202039125
Amato, R., Grinberg, V., Hell, N., et al. 2021, A&A, 648, A105, doi: 10.1051/0004-6361/202039125
-
[2]
Arnaud, K. A. 1996, in Astronomical Society of the Pacific Conference Series, Vol. 101, Astronomical Data Analysis Software and Systems V, ed. G. H. Jacoby & J. Barnes, 17
1996
-
[3]
2018, AJ, 156, 58, doi: 10.3847/1538-3881/aacb21
Mantelet, G., & Andrae, R. 2018, AJ, 156, 58, doi: 10.3847/1538-3881/aacb21
-
[4]
2020, MNRAS, 493, 3045, doi: 10.1093/mnras/staa437
Bala, S., Roy, J., & Bhattacharya, D. 2020, MNRAS, 493, 3045, doi: 10.1093/mnras/staa437
-
[5]
Barthelmy, S. D., Barbier, L. M., Cummings, J. R., et al. 2005, SSRv, 120, 143, doi: 10.1007/s11214-005-5096-3
-
[6]
Becker, P. A., & Wolff, M. T. 2007, ApJ, 654, 435, doi: 10.1086/509108
doi:10.1086/509108 2007
-
[7]
D., Kallman, T., & Corcoran, M
Boroson, B., Vrtilek, S. D., Kallman, T., & Corcoran, M. 2003, ApJ, 592, 516, doi: 10.1086/375636
-
[8]
Coburn, W., Heindl, W. A., Rothschild, R. E., et al. 2002, ApJ, 580, 394, doi: 10.1086/343033
doi:10.1086/343033 2002
Show all 48 references
-
[9]
F., Coe, M
Dolan, J. F., Coe, M. J., Crannell, C. J., et al. 1980, ApJ, 238, 238, doi: 10.1086/157980
1980 doi
-
[10]
2009, MNRAS, 398, 2152, doi: 10.1111/j.1365-2966.2009.15265.x
Ducci, L., Sidoli, L., Mereghetti, S., Paizis, A., & Romano, P. 2009, MNRAS, 398, 2152, doi: 10.1111/j.1365-2966.2009.15265.x
2009 doi
-
[11]
2015, A&A, 577, A130, doi: 10.1051/0004-6361/201425191
Falanga, M., Bozzo, E., Lutovinov, A., et al. 2015, A&A, 577, A130, doi: 10.1051/0004-6361/201425191
2015 doi
-
[12]
2012, A&A, 538, A67, doi: 10.1051/0004-6361/201118008
Farinelli, R., Ceccobello, C., Romano, P., & Titarchuk, L. 2012, A&A, 538, A67, doi: 10.1051/0004-6361/201118008
2012 doi
-
[13]
2011, A&A, 525, A102, doi: 10.1051/0004-6361/201014808
Farinelli, R., & Titarchuk, L. 2011, A&A, 525, A102, doi: 10.1051/0004-6361/201014808
2011 doi
-
[14]
Sunyaev, R. A. 2005, Astronomy Letters, 31, 729, doi: 10.1134/1.2123288 F¨ urst, F., Grefenstette, B. W., Staubert, R., et al. 2013, ApJ, 779, 69, doi: 10.1088/0004-637X/779/1/69 Gim´ enez-Garc´ ıa, A., Torrej´ on, J. M., Eikmann, W., et al. 2015, A&A, 576, A108, doi: 10.1051/...
2005 doi
-
[15]
P., & Blank, D
Goldstein, G., Huenemoerder, D. P., & Blank, D. 2004, AJ, 127, 2310, doi: 10.1086/382514
2004 doi
-
[16]
W., Ludlam, R
Grefenstette, B. W., Ludlam, R. M., Thompson, E. T., et al. 2021, ApJ, 909, 30, doi: 10.3847/1538-4357/abe045
2021 doi
-
[17]
E., & Kallman, T
Haberl, F., White, N. E., & Kallman, T. R. 1989, ApJ, 343, 409, doi: 10.1086/167714
1989 doi
-
[18]
M., Torrej´ on, J
Hainich, R., Oskinova, L. M., Torrej´ on, J. M., et al. 2020, A&A, 634, A49, doi: 10.1051/0004-6361/201935498
2020 doi
-
[19]
A., Craig, W
Harrison, F. A., Craig, W. W., Christensen, F. E., et al. 2013, ApJ, 770, 103, doi: 10.1088/0004-637X/770/2/103
2013 doi
-
[20]
B., Rothschild, R
Hemphill, P. B., Rothschild, R. E., Cheatham, D. M., et al. 2019, ApJ, 873, 62, doi: 10.3847/1538-4357/ab03d3 HI4PI Collaboration, Ben Bekhti, N., Fl¨ oer, L., et al. 2016, A&A, 594, A116, doi: 10.1051/0004-6361/201629178
2019 doi
-
[21]
C., Narayan, R., & Kallman, T
Hickox, R. C., Narayan, R., & Kallman, T. R. 2004, ApJ, 614, 881, doi: 10.1086/423928
2004 doi
-
[22]
2016, MNRAS, 461, 816, doi: 10.1093/mnras/stw1299
Islam, N., & Paul, B. 2016, MNRAS, 461, 816, doi: 10.1093/mnras/stw1299
2016 doi
- [23]
-
[24]
1973, ApJL, 184, L65, doi: 10.1086/181289
Jones, C., & Liller, W. 1973, ApJL, 184, L65, doi: 10.1086/181289
1973 doi
-
[25]
S., & Bleeker, J
Kaastra, J. S., & Bleeker, J. A. M. 2016, A&A, 587, A151, doi: 10.1051/0004-6361/201527395
2016 doi
-
[26]
M., Buisson, D
Li, S., Ludlam, R. M., Buisson, D. J. K., et al. 2025, ApJ, 994, 169, doi: 10.3847/1538-4357/ae10bc
2025 doi
-
[27]
M., Grefenstette, B
Ludlam, R. M., Grefenstette, B. W., Brumback, M. C., et al. 2022, ApJ, 934, 59, doi: 10.3847/1538-4357/ac7b27 18
2022 doi
- [28]
- [29]
-
[30]
1999, ApJ, 525, 978, doi: 10.1086/307912
Makishima, K., Mihara, T., Nagase, F., & Tanaka, Y. 1999, ApJ, 525, 978, doi: 10.1086/307912
1999 doi
-
[31]
M., Oskinova, L., et al
Martinez-Chicharro, M., Torrej´ on, J. M., Oskinova, L., et al. 2018, MNRAS, 473, L74, doi: 10.1093/mnrasl/slx165 Mart´ ınez-N´ u˜ nez, S., Torrej´ on, J. M., K¨ uhnel, M., et al. 2014, A&A, 563, A70, doi: 10.1051/0004-6361/201322404 Mart´ ınez-N´ u˜ nez, S., Kretschmar, P., B...
2018 doi
-
[32]
W., Thalhammer, P., et al
Mastroserio, G., Grefenstette, B. W., Thalhammer, P., et al. 2022, ApJ, 941, 35, doi: 10.3847/1538-4357/ac8c94
2022 doi
-
[33]
1995, in American Astronomical Society Meeting Abstracts, Vol
Mihara, T., Makishima, K., & Nagase, F. 1995, in American Astronomical Society Meeting Abstracts, Vol. 187, American Astronomical Society Meeting Abstracts, 104.03
1995
- [34]
-
[35]
M., Feldmeier, A., & Kretschmar, P
Oskinova, L. M., Feldmeier, A., & Kretschmar, P. 2012, MNRAS, 421, 2820, doi: 10.1111/j.1365-2966.2012.20507.x
2012 doi
- [36]
-
[37]
Rikame, K., Paul, B., Sharma, R., Jithesh, V., & Paul, K. T. 2024, MNRAS, 529, 3360, doi: 10.1093/mnras/stae739
2024 doi
-
[38]
2016, ApJ, 821, 23, doi: 10.3847/0004-637X/821/1/23
Seifina, E., Titarchuk, L., & Shaposhnikov, N. 2016, ApJ, 821, 23, doi: 10.3847/0004-637X/821/1/23
2016 doi
-
[39]
2019, A&A, 622, A61, doi: 10.1051/0004-6361/201834479
Staubert, R., Tr¨ umper, J., Kendziorra, E., et al. 2019, A&A, 622, A61, doi: 10.1051/0004-6361/201834479
2019 doi
-
[40]
1986, in IAU Colloquium 89: Radiation Hydrodynamics in Stars and Compact Objects, ed
Tanaka, Y. 1986, in IAU Colloquium 89: Radiation Hydrodynamics in Stars and Compact Objects, ed. D. Mihalas & K.-H. A. Winkler, Vol. 255 (Springer,
1986
-
[41]
Berlin, Heidelberg), 198, doi: 10.1007/3-540-16764-1 12
-
[42]
2021, Journal of Astronomical Telescopes, Instruments, and Systems, 7, 037001, doi: 10.1117/1.JATIS.7.3.037001
Terada, Y., Holland, M., Loewenstein, M., et al. 2021, Journal of Astronomical Telescopes, Instruments, and Systems, 7, 037001, doi: 10.1117/1.JATIS.7.3.037001
2021 doi
-
[43]
S., Lutovinov, A
Tsygankov, S. S., Lutovinov, A. A., Doroshenko, V., et al. 2016, A&A, 593, A16, doi: 10.1051/0004-6361/201628236 van der Meer, A., Kaper, L., di Salvo, T., et al. 2005, A&A, 432, 999, doi: 10.1051/0004-6361:20041288 van der Meij, V., Guo, D., Kaper, L., & Renzo, M. 2021, A&A, ...
2016 doi
-
[44]
A., Saavedra, E
West-Ocampo, L., Fogantini, F. A., Saavedra, E. A., et al. 2026, Journal of High Energy Astrophysics, 52, 100567, doi: 10.1016/j.jheap.2026.100567
2026 doi
-
[45]
E., Swank, J
White, N. E., Swank, J. H., & Holt, S. S. 1983, ApJ, 270, 711, doi: 10.1086/161162
1983 doi
-
[46]
R., Hornstrup, A., Molendi, S., et al
Wik, D. R., Hornstrup, A., Molendi, S., et al. 2014, ApJ, 792, 48, doi: 10.1088/0004-637X/792/1/48
2014 doi
-
[47]
2024, ApJ, 963, 18, doi: 10.3847/1538-4357/ad1992
Xiao, H., Ji, L., Zhang, P., et al. 2024, ApJ, 963, 18, doi: 10.3847/1538-4357/ad1992
2024 doi
-
[48]
A., Szanecki, M., Poutanen, J., Gierli´ nski, M., & Biernacki, P
Zdziarski, A. A., Szanecki, M., Poutanen, J., Gierli´ nski, M., & Biernacki, P. 2020, MNRAS, 492, 5234, doi: 10.1093/mnras/staa159 19 APPENDIX A.PRODUCTS FOR THE STRAY LIGHT OBSERVATIONS We show products from all of the analyzed stray light observations. Figure A1 shows detect...
2020 doi
Reviewed July 13, 2026 · model on record in the stance chip above.
Discussion (0). Sign in to comment.