REVIEW 4 major objections 5 minor 42 references
Dynamics of Subsurface Flows in Solar Active Regions During the May 2024 Storm
T0 review · 4 major / 5 minor · reviewed 2026-08-07 · deepseek-v4-flash
Pith's one-line read The paper claims NHGV, a measure of how day-to-day kinetic-helicity change varies across depth beneath a sunspot group, begins rising at least one day before major flares; 49% of recorded flares fell on its peak day, 32% on the next.
desk verdict Solid new ring-diagram measurements for the May 2024 storm ARs, but the NHGV precursor statistic is post hoc and needs controls plus a temporal-label fix before it can carry the claim. read the letter →
The pith
A machine-rendered reading of the paper's core claim, the machinery that carries it, and where it could break.
The reading
What carries the argument
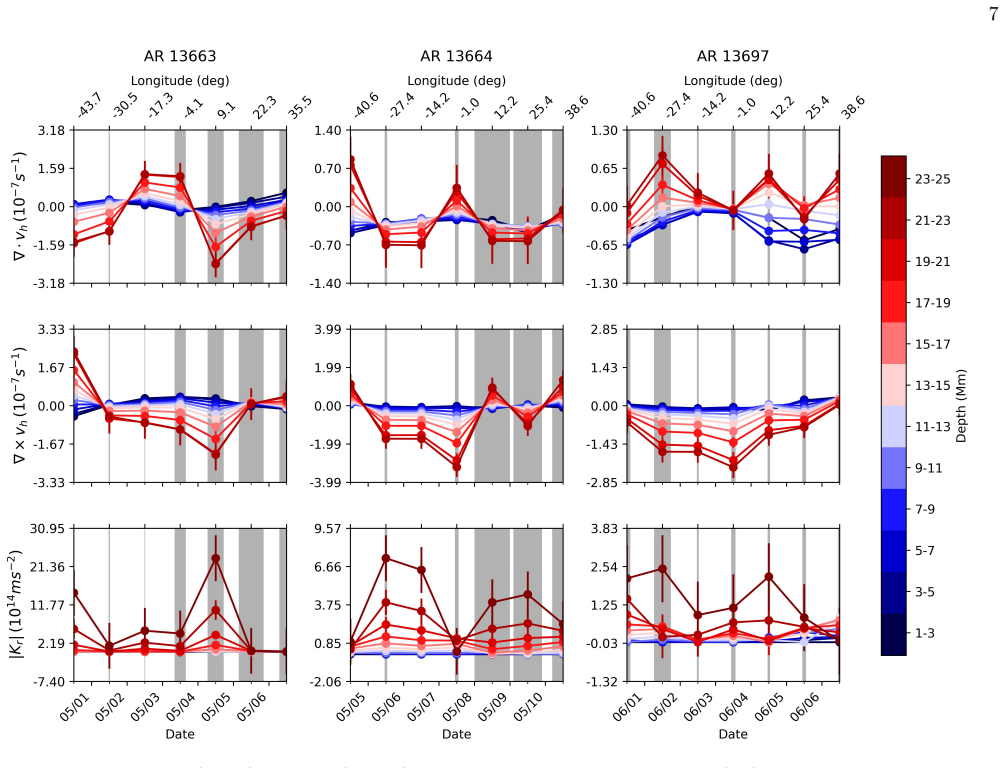
The load-bearing object is the Normalized Helicity Gradient Variance (NHGV), built from daily kinetic-helicity maps: $\mathrm{NHGV} = \Delta k(t)\,\bar{k}(t)$, with $\bar{k}(t) = \sum_r (k_r(t)-k_{r+1}(t))$ the vertical gradient of radial kinetic helicity and $\Delta k(t) = \sum_r (\Delta k_r(t)-\Delta k_{r+1}(t))$ the depth-spread of its day-to-day change $\Delta k_r(t) = k_r(t)-k_r(t-1)$. A large NHGV therefore requires both a strong vertical stratification of helicity and helicity evolving at different rates at different depths. The helicity values come from ring-diagram analysis of HMI Dopplergrams: horizontal flows in tracked patches around each active region give divergence and vorticity, the continuity equation with solar model S densities converts these to radial velocity, and the radial helicity is volume-integrated from the surface to 25 Mm. NHGV is the parameter that carries the paper's precursor claim: its peaks, rather than the amplitude of any single flow component, are what align with flare days.
What would settle it
Apply the identical NHGV pipeline to a matched set of large, complex active regions that produced no flares, and also scramble the observed flare dates against the measured NHGV curves; if non-flaring regions show NHGV peaks as often as flaring ones, or if random shuffles reproduce an 81% peak-or-next-day coincidence rate, then the claimed precursor relation is indistinguishable from noise. A decisive measurement would additionally track AR 13664 through the 14 May X8.8 flare window, which the present data could not cover.
Extended reading notes
Core claim
The central claim is that NHGV behaves as a precursor: it begins rising at least one day before major flaring activity, reaches a local maximum on the day of peak flare activity, and declines while flaring continues. NHGV is the product of two depth-dependent quantities, the vertical gradient of radial kinetic helicity and the spread across depth of its day-to-day change, so a large value indicates a helicity structure that is both strongly stratified and evolving at different rates at different depths. The authors compute it from ring-diagram flow measurements, corrected by subtracting quiet-Sun flows, over the outer 25 Mm of the convection zone of three active regions of Hale class $\beta\gamma\delta$. Across all three regions, 49% of the recorded X- and M-class flares occurred on the day NHGV peaked and 32% on the following day, and NHGV peaks were captured even around comparatively low-intensity flares. The authors interpret the rise as supporting NHGV's use in flare forecasting, and they read the same-sign twist-writhe correlation as evidence that the pre-flare NHGV increase reflects subsurface flows responding to twist the flux tube already carried on emergence, not flows generating the twist that triggers the eruption.
Load-bearing premise
The result stands or falls on the assumption that the NHGV peaks identified in the same daily time series used for the statistics are real features whose alignment with flare days means something, rather than bumps that would coincide with flare days about as often by chance; the paper does not test this against non-flaring control regions or a random-alignment null model, and its own closing paragraph defers that test to future work.
Editorial extensions
If this is right
- If the NHGV-flare alignment holds, daily NHGV curves could be added to flare-forecast schemes as a kinetic complement to magnetic parameters such as twist and unsigned flux, the current standard inputs to prediction systems.
- The claimed sequence implies a warning window, not just a peak: because NHGV begins rising at least one day before major flaring, a sustained multi-day rise would itself flag rising eruptive potential.
- The correlations imply that near-surface (1-13 Mm) subsurface flows are coupled to photospheric magnetism: divergence anticorrelates with unsigned flux ($r_p=-0.52$, 99% confidence), and kinetic helicity correlates with magnetic twist ($r_p=0.42$, 97% confidence).
- The same-sign twist-writhe correlation ($r_p=0.52$, 99% confidence) implies these regions emerged with substantial pre-existing twist, so their helicity budget is set before the subsurface flows respond, constraining the $\Sigma$-effect picture of helicity buildup.
- The persistence of strong divergence, vorticity, and helicity in AR 13697 after a full solar rotation implies that a large complex region can maintain vigorous subsurface dynamics even while its surface area is shrinking, delaying the expected decay.
Reading between the lines
- A decisive check the paper announces but does not perform, deferring it in its closing paragraph to planned work: run the identical NHGV pipeline on a matched sample of large, complex, non-flaring active regions; if NHGV peaks appear there with comparable frequency, the 81% peak-or-next-day alignment would be a statistical coincidence rather than a precursor signal.
- The central event of the storm is not directly measured: the X8.8 flare of 14 May fell outside the tracked window, and the paper covers it only by extrapolating a rising trend from a 9 May minimum, so the strongest claimed case rests on inference.
- A randomization test would tighten the claim without any new data: shuffle flare timestamps against the observed NHGV curves and count how often at least 81% of flares fall within a day of a local maximum by chance; the paper reports no such null model.
- Because the authors' quoted lead time is a lower bound set by daily averaging, recomputing NHGV from flow maps with 6-12 hour cadence could sharpen the forecast window, provided ring-diagram inversions at that cadence retain enough signal.
Editorial analysis
A structured set of objections, weighed in public.
Referee Report
Summary. This paper uses ring-diagram analysis of SDO/HMI Dopplergrams to measure subsurface horizontal flows in three complex active regions (AR 13663, AR 13664, and its returning counterpart AR 13697) during the May 2024 storm. From divergence, vorticity, and kinetic helicity profiles down to 25 Mm, the authors define the Normalized Helicity Gradient Variance (NHGV, Eqs. 6–9) and report that NHGV peaks on the day of or one day before most flares, with 49% of flares on the peak day and 32% on the following day. They also report correlations between divergence and unsigned flux (r_p = -0.52), kinetic helicity and magnetic twist (r_p = 0.42), and twist and writhe (r_p = 0.52). The paper concludes that NHGV is a promising flare precursor and calls for a larger statistical study.
Significance. If the precursor claim were quantitatively established, NHGV would be a valuable helioseismic input to flare forecasting. The manuscript has clear strengths: it uses established ring-diagram methods, applies a quiet-region systematics correction, defines NHGV transparently through Eqs. 6–9, and provides a complete table of X/M flares in Appendix A. However, the central quantitative claim is currently a described trend rather than a tested hypothesis: it is based on three flaring ARs, visually selected daily-averaged NHGV peaks, no non-flaring control regions, and no null-hypothesis test. The authors' own final paragraph acknowledges that a larger sample with higher temporal resolution is needed, which is consistent with treating this as a case-study correlation rather than a demonstrated precursor.
major comments (4)
- [§3.2, Fig. 5] The 49%/32% statistic is computed by matching flare days to local maxima read from the same NHGV curves against which the flares are plotted. No peak-finding rule is pre-specified, no uncertainty is attached to the time of each maximum, and the analysis includes only three flaring active regions. Because the peaks are selected on the data used for the claim, the alignment is not a test of a precursor hypothesis. Please (i) define an automated peak criterion, e.g., prominence relative to the QR-normalized noise level, (ii) propagate flow uncertainties into NHGV to obtain peak-time uncertainties, and (iii) compare against a null model, such as shuffling flare days over the tracking windows or analyzing NHGV in non-flaring control active regions. Without such a test, the '81% of flares near NHGV peaks' statement cannot be distinguished from chance alignment.
- [§2.1 and Fig. 4 caption] The manuscript does not state the exact 24-hour interval represented by each daily flow value. The text says flows are daily averages, and the Figure 4 caption says the flare bars are 'centered at 12:00 UT each day,' but the start, center, or end of the tracking window is never defined. If the NHGV value labeled May 5 includes flows from May 4 12:00 to May 5 12:00, then a flare at 09:00 UT on May 5 lies inside the averaging window that produced the peak, making the 'same-day' alignment contemporaneous rather than a precursor. Please specify the interval precisely and recompute the same-day percentage using only flares that occur after the end of the averaging window; the next-day 32% figure is less affected but still depends on the peak list.
- [§3.2, Fig. 5] NHGV is plotted without error bars, although the underlying ring-diagram flow measurements carry uncertainties that are used elsewhere, e.g., in the weighted means of the quiet-region correction in §2.2. The absence of uncertainties makes it impossible to assess whether the claimed peaks, such as the May 4 peak for AR 13663 or the May 8 peak for AR 13664, are significant relative to daily measurement noise, and whether the claimed rise 'at least a day prior' is robust. Please propagate the flow velocity uncertainties through Eqs. 6–9 to produce error bars for NHGV, or provide an equivalent noise estimate.
- [Abstract and §3.2] The abstract and §3.2 present the peak-day and next-day flare fractions as evidence for a precursor, but a precursor requires a demonstrable lead time between a well-defined NHGV rise and flare onset. A statement that flares cluster around NHGV peaks is a joint-distribution description, not a predictive lead-time statement. Please rephrase the central claim to report the distribution of lead times between the start of the NHGV rise and individual flare onsets, and state explicitly how many same-day flares occur after the NHGV averaging window has closed. The authors' own acknowledgment in §4 that a larger sample and higher temporal resolution are needed should also be reflected in the abstract's language.
minor comments (5)
- [Eq. (5)] There is a typographical error in the line defining K_r: 'dr, ,' should read 'dr,'.
- [Eq. (7)] The expression uses 'r takes only the odd indices of depth (1, 3, 5, ...)', but the mapping from these indices to physical depths in Mm is not defined; please specify the depth grid used in the ring-diagram inversions.
- [Table 1] The layout of Table 1 is difficult to read: the Day #, Date, Location, and Quiet Period columns are interleaved with dashes in a way that obscures which quiet periods correspond to which active region and day. Please reformat the table with clear rows and column headings.
- [§3.3 and Figure 6] The phrase 'unsigned unsigned magnetic flux' appears twice; one 'unsigned' should be removed.
- [§2.1 and Table 1] The Hale class notation 'βγδ' is missing spaces in several places (e.g., 'Hale classβγδ'); please typeset this consistently as 'βγδ'.
Circularity Check
No significant circularity: NHGV is defined independently of flare data, and the precursor claim is an empirical correlation, not a fitted input.
full rationale
The derivation chain is self-contained. NHGV is constructed from ring-diagram flow measurements through Equations 6-9, using divergence, vorticity, radial velocity, and kinetic helicity; flare times are external GOES/NOAA catalog data. The 49%/32% alignment statistic is therefore a post-hoc empirical correlation, not a quantity fitted to the flare outcome or defined in terms of it. The only self-citation (B. Lekshmi et al. 2022) is used to note a previously reported correlation between kinetic and current helicities, and the current correlation is computed independently from the new measurements, so that citation is not load-bearing for the central NHGV precursor claim, which rests on the external studies of Reinard et al. (2010) and Gao et al. (2014) plus the new data. The absence of a pre-specified peak-finding rule and of a non-flaring control sample is a legitimate statistical validity concern, but it does not amount to circularity: no equation in the paper reduces the precursor claim to its own input, and no fitted parameter is renamed as a prediction. The authors' own discussion that a larger sample with higher temporal resolution is needed to quantitatively assess NHGV as a flare indicator further confirms that the present result is offered as a case-study correlation rather than a derivation forced by construction.
Assumptions & free parameters
free parameters (4)
- Flare weighting increment =
0.5 per M-class step (M1 = 0.5, X4 = 6.5)
- AR patch size =
25.92 degrees (AR 13663), 27.2 degrees (ARs 13664/13697)
- Quiet-region normalization windows =
specific dates listed in Table 1
- Depth index selection in Eq. 7 =
odd indices only (1,3,5,...)
assumptions (6)
- standard math Calculus identities for divergence, vorticity, and volume integration are standard.
- domain assumption Solar Model S density profile (Christensen-Dalsgaard 1998) accurately represents the subsurface layers used in Eq. 3.
- domain assumption Ring-diagram analysis of SDO/HMI Dopplergrams yields reliable daily horizontal flow velocities at depths down to 25 Mm for the custom patch sizes.
- domain assumption Subtracting error-weighted mean quiet-region velocities removes center-to-limb and B0-angle systematics on the few-day timescale.
- domain assumption Flare daily counts and flare index determined from GOES/NOAA reports represent the true flaring state of each AR.
- domain assumption The writhe proxy W equals lambda divided by d from Liu et al. 2024 captures the magnetic writhe of the AR.
Cite this review
Pith. "Pith review of Dynamics of Subsurface Flows in Solar Active Regions During the May 2024 Storm." pith.science (2026). https://pith.science/paper/PFTZOORH
@misc{pith2026250608141,
  author       = {Pith},
  title        = {Pith review of: Dynamics of Subsurface Flows in Solar Active Regions During the May 2024 Storm},
  year         = {2026},
  howpublished = {\url{https://pith.science/paper/PFTZOORH}},
  note         = {Machine review of arXiv:2506.08141}
}
read the original abstract
In May 2024, the Sun exhibited intense magnetic activity, marked by numerous high-intensity flares resulting from the interaction and merging of NOAA ARs 13664 and 13668 in the southern hemisphere and AR 13663 in the northern hemisphere. Notably, AR 13664 displayed an extended lifetime, remaining visible after a full solar rotation and continuing to produce significant flaring activity. In this study, we investigate the evolution of sub-photospheric plasma flows associated with these ARs during their disk passage using ring-diagram analysis of SDO/HMI Dopplergrams. We analyze flow divergence, vorticity, and kinetic helicity across depths from the surface to 25 Mm, revealing pronounced temporal and depth-dependent variations. Our observations indicate that the majority of flares occur on the days when the Normalized Helicity Gradient Variance, a measure of kinetic helicity spread, peaks or on the following day. Furthermore, we examine the relationship between subsurface flow dynamics and surface magnetic properties of these complex active regions to understand the interaction between them.
Figures


Figures from the paper (3 more)


Reference graph
Works this paper leans on
-
[1]
, " * write output.state after.block = add.period write newline
ENTRY address archivePrefix author booktitle chapter doi edition editor eprint howpublished institution journal key month number organization pages publisher school series title misctitle type volume year version url label extra.label sort.label short.list INTEGERS output.state before.all mid.sentence after.sentence after.block FUNCTION init.state.consts ...
-
[2]
write newline
" write newline "" before.all 'output.state := FUNCTION format.url url empty "" new.block "" url * "" * if FUNCTION format.eprint eprint empty "" archivePrefix empty "" archivePrefix "arXiv" = new.block " " eprint * " " * new.block " " eprint * " " * if if if FUNCTION format.doi doi empty "" " " doi * " " * if FUNCTION format.pid doi empty eprint empty ur...
-
[3]
,# (7),01444 '9=82<.342C 2! !22222222222222222222222222222222222222222222222222 Y m
thebibliography [1] 20pt to REFERENCES 6pt =0pt \@twocolumntrue 12pt -12pt 10pt plus 3pt =0pt =0pt =1pt plus 1pt =0pt =0pt -12pt =13pt plus 1pt =20pt =13pt plus 1pt \@M =10000 =-1.0em =0pt =0pt 0pt =0pt =1.0em @enumiv\@empty 10000 10000 `\.\@m \@noitemerr \@latex@warning Empty `thebibliography' environment \@ifnextchar \@reference \@latexerr Missing key o...
work page 2017
-
[4]
Bobra , M. G., Sun , X., Hoeksema , J. T., et al. 2014, title The Helioseismic and Magnetic Imager (HMI) Vector Magnetic Field Pipeline: SHARPs - Space-Weather HMI Active Region Patches , , 289, 3549, 10.1007/s11207-014-0529-3
-
[5]
S., Baldner , C., Basu , S., Haber , D
Bogart , R. S., Baldner , C., Basu , S., Haber , D. A., & Rabello-Soares , M. C. 2011, in Journal of Physics Conference Series, Vol. 271, GONG-SoHO 24: A New Era of Seismology of the Sun and Solar-Like Stars (IOP), 012009, 10.1088/1742-6596/271/1/012009
-
[6]
Braun , D. C. 2016, title A Helioseismic Survey of Near-surface Flows Around Active Regions and their Association with Flares , , 819, 106, 10.3847/0004-637X/819/2/106
-
[7]
1998, title The 'Standard' Sun Modelling and Helioseismology , , 85, 19, 10.1023/A:1005116132024
Christensen-Dalsgaard , J. 1998, title The 'Standard' Sun Modelling and Helioseismology , , 85, 19, 10.1023/A:1005116132024
-
[8]
2003, in ESA Special Publication, Vol
Corbard , T., Toner , C., Hill , F., et al. 2003, in ESA Special Publication, Vol. 517, GONG+ 2002. Local and Global Helioseismology: the Present and Future, ed. H. Sawaya-Lacoste , 255--258
work page 2003
Show all 42 references
-
[9]
2009, title Comparison of photospheric current helicity and subsurface kinetic helicity , , 394, L79, 10.1111/j.1745-3933.2008.00615.x
Gao , Y., Zhang , H., & Zhao , J. 2009, title Comparison of photospheric current helicity and subsurface kinetic helicity , , 394, L79, 10.1111/j.1745-3933.2008.00615.x
2009
-
[10]
2012, title Analysis on Correlations between Subsurface Kinetic Helicity and Photospheric Current Helicity in Active Regions , , 761, L9, 10.1088/2041-8205/761/1/L9
Gao , Y., Zhao , J., & Zhang , H. 2012, title Analysis on Correlations between Subsurface Kinetic Helicity and Photospheric Current Helicity in Active Regions , , 761, L9, 10.1088/2041-8205/761/1/L9
2012 doi
-
[11]
2014, title A Study of Connections Between Solar Flares and Subsurface Flow Fields of Active Regions , , 289, 493, 10.1007/s11207-013-0274-z
Gao , Y., Zhao , J., & Zhang , H. 2014, title A Study of Connections Between Solar Flares and Subsurface Flow Fields of Active Regions , , 289, 493, 10.1007/s11207-013-0274-z
2014 doi
-
[12]
2004, title Helioseismology of Time-Varying Flows Through The Solar Cycle , , 224, 217, 10.1007/s11207-005-4983-9
Gizon , L. 2004, title Helioseismology of Time-Varying Flows Through The Solar Cycle , , 224, 217, 10.1007/s11207-005-4983-9
2004 doi
-
[13]
2025, title The Solar and Geomagnetic Storms in 2024 May: A Flash Data Report , , 979, 49, 10.3847/1538-4357/ad9335
Hayakawa , H., Ebihara , Y., Mishev , A., et al. 2025, title The Solar and Geomagnetic Storms in 2024 May: A Flash Data Report , , 979, 49, 10.3847/1538-4357/ad9335
2025 doi
-
[14]
1988, title Rings and Trumpets---Three-dimensional Power Spectra of Solar Oscillations , , 333, 996, 10.1086/166807
Hill , F. 1988, title Rings and Trumpets---Three-dimensional Power Spectra of Solar Oscillations , , 333, 996, 10.1086/166807
1988 doi
-
[15]
2025, title Modeling the Magnetic Connection from Earth to Solar Corona during the May 11 Geomagnetic Superstorm , , 979, 146, 10.3847/1538-4357/ada35a
Ippolito , A., Alberti , T., & Giannattasio , F. 2025, title Modeling the Magnetic Connection from Earth to Solar Corona during the May 11 Geomagnetic Superstorm , , 979, 146, 10.3847/1538-4357/ada35a
2025 doi
-
[16]
C., & Hill , F
Jain , K., Tripathy , S. C., & Hill , F. 2015, title Divergent Horizontal Sub-surface Flows within Active Region 11158 , , 808, 60, 10.1088/0004-637X/808/1/60
2015 doi
-
[17]
M., Purkhart , S., Zhang , P., & Rempel , M
Jarolim , R., Veronig , A. M., Purkhart , S., Zhang , P., & Rempel , M. 2024, title Magnetic Field Evolution of the Solar Active Region 13664 , , 976, L12, 10.3847/2041-8213/ad8914
2024 doi
-
[18]
Jaswal , P., Sinha , S., & Nandy , D. 2025, title Deconstructing the Properties of Solar Super Active Region 13664 in the Context of the Historic Geomagnetic Storm of 2024 May 10 11 , , 979, 31, 10.3847/1538-4357/ad960b
2025 doi
-
[19]
2025, title Evolution of the interacting coronal mass ejections that drove the great geomagnetic storm of 10 May 2024 , , 698, A79, 10.1051/0004-6361/202452866
Khuntia , S., Mishra , W., & Agarwal , A. 2025, title Evolution of the interacting coronal mass ejections that drove the great geomagnetic storm of 10 May 2024 , , 698, A79, 10.1051/0004-6361/202452866
2025 doi
-
[20]
R., et al
Komm , R., Corbard , T., Durney , B. R., et al. 2004, title Solar Subsurface Fluid Dynamics Descriptors Derived from Global Oscillation Network Group and Michelson Doppler Imager Data , , 605, 554, 10.1086/382187
2004 doi
-
[21]
2015, title Subsurface Zonal and Meridional Flow Derived from GONG and SDO/HMI: A Comparison of Systematics , , 290, 1081, 10.1007/s11207-015-0663-6
Komm , R., Gonz \'a lez Hern \'a ndez , I., Howe , R., & Hill , F. 2015, title Subsurface Zonal and Meridional Flow Derived from GONG and SDO/HMI: A Comparison of Systematics , , 290, 1081, 10.1007/s11207-015-0663-6
2015 doi
-
[22]
2015, title Current and Kinetic Helicity of Long-lived Activity Complexes , , 798, 20, 10.1088/0004-637X/798/1/20
Komm , R., & Gosain , S. 2015, title Current and Kinetic Helicity of Long-lived Activity Complexes , , 798, 20, 10.1088/0004-637X/798/1/20
2015 doi
-
[23]
2019, title Kinetic Helicity and Lifetime of Activity Complexes During Solar Cycle 24 , , 887, 192, 10.3847/1538-4357/ab58ca
Komm , R., & Gosain , S. 2019, title Kinetic Helicity and Lifetime of Activity Complexes During Solar Cycle 24 , , 887, 192, 10.3847/1538-4357/ab58ca
2019 doi
-
[24]
2009, title Solar flares and solar subphotospheric vorticity , Journal of Geophysical Research (Space Physics), 114, A06105, 10.1029/2008JA013977
Komm , R., & Hill , F. 2009, title Solar flares and solar subphotospheric vorticity , Journal of Geophysical Research (Space Physics), 114, A06105, 10.1029/2008JA013977
2009 doi
-
[25]
W., & Nandy , D
Lekshmi , B., Jain , K., Komm , R. W., & Nandy , D. 2022, title Sub-surface Plasma Flows and the Flare Productivity of Solar Active Regions , Frontiers in Astronomy and Space Sciences, 9, 1020748, 10.3389/fspas.2022.1020748
2022
-
[26]
H., et al
Liu , Y., Komm , R., Brummell , N. H., et al. 2024, title The Relationship between Kinetic and Magnetic Helicity in Solar Active Regions , , 971, 1, 10.3847/1538-4357/ad58b7
2024 doi
-
[27]
W., Fisher , G
Longcope , D. W., Fisher , G. H., & Pevtsov , A. A. 1998, title Flux-Tube Twist Resulting from Helical Turbulence: The -Effect , , 507, 417, 10.1086/306312
1998 doi
-
[28]
2006, title Flares, Magnetic Fields, and Subsurface Vorticity: A Survey of GONG and MDI Data , , 645, 1543, 10.1086/503761
Mason , D., Komm , R., Hill , F., et al. 2006, title Flares, Magnetic Fields, and Subsurface Vorticity: A Survey of GONG and MDI Data , , 645, 1543, 10.1086/503761
2006 doi
-
[29]
A., Ambastha , A., & Reddy , V
Maurya , R. A., Ambastha , A., & Reddy , V. 2011, in Journal of Physics Conference Series, Vol. 271, GONG-SoHO 24: A New Era of Seismology of the Sun and Solar-Like Stars (IOP), 012003, 10.1088/1742-6596/271/1/012003
2011 doi
-
[30]
D., Thompson , B
Pesnell , W. D., Thompson , B. J., & Chamberlin , P. C. 2012, title The Solar Dynamics Observatory (SDO) , , 275, 3, 10.1007/s11207-011-9841-3
2012 doi
-
[31]
A., Canfield , R
Pevtsov , A. A., Canfield , R. C., & Metcalf , T. R. 1995, title Latitudinal Variation of Helicity of Photospheric Magnetic Fields , , 440, L109, 10.1086/187773
1995 doi
-
[32]
A., Henthorn , J., Komm , R., & Hill , F
Reinard , A. A., Henthorn , J., Komm , R., & Hill , F. 2010, title Evidence That Temporal Changes in Solar Subsurface Helicity Precede Active Region Flaring , , 710, L121, 10.1088/2041-8205/710/2/L121
2010 doi
-
[33]
Romano , P., Contarino , L., & Zuccarello , F. 2005, title Observational evidence of the primary role played by photospheric motions in magnetic helicity transport before a filament eruption , , 433, 683, 10.1051/0004-6361:20041807
2005 doi
-
[34]
H., Schou , J., Bush , R
Scherrer , P. H., Schou , J., Bush , R. I., et al. 2012, title The Helioseismic and Magnetic Imager (HMI) Investigation for the Solar Dynamics Observatory (SDO) , , 275, 207, 10.1007/s11207-011-9834-2
2012 doi
-
[35]
Snodgrass , H. B. 1984, title Separation of large-scale photospheric Doppler patterns , , 94, 13, 10.1007/BF00154804
1984 doi
-
[36]
G., Hoeksema , J
Sun , X., Bobra , M. G., Hoeksema , J. T., et al. 2015, title Why Is the Great Solar Active Region 12192 Flare-rich but CME-poor? , , 804, L28, 10.1088/2041-8205/804/2/L28
2015 doi
-
[37]
2003, title Tilt and alpha _ best of major flare-producing active regions , , 407, L13, 10.1051/0004-6361:20030977
Tian , L., & Liu , Y. 2003, title Tilt and alpha _ best of major flare-producing active regions , , 407, L13, 10.1051/0004-6361:20030977
2003 doi
-
[38]
2019, title Flare-productive active regions , Living Reviews in Solar Physics, 16, 3, 10.1007/s41116-019-0019-7
Toriumi , S., & Wang , H. 2019, title Flare-productive active regions , Living Reviews in Solar Physics, 16, 3, 10.1007/s41116-019-0019-7
2019 doi
-
[39]
A., & Chae , J
Vemareddy , P., Ambastha , A., Maurya , R. A., & Chae , J. 2012, title On the Injection of Helicity by the Shearing Motion of Fluxes in Relation to Flares and Coronal Mass Ejections , , 761, 86, 10.1088/0004-637X/761/2/86
2012 doi
-
[40]
D., Zhao , X., & Hu , H
Wang , R., Liu , Y. D., Zhao , X., & Hu , H. 2024, title Unveiling key factors in solar eruptions leading to the solar superstorm in 2024 May , , 692, A112, 10.1051/0004-6361/202452008
2024 doi
-
[41]
2006, title North South Asymmetry of Zonal and Meridional Flows Determined From Ring Diagram Analysis of Gong ++ Data , , 236, 227, 10.1007/s11207-006-0106-5
Zaatri , A., Komm , R., Gonz \'a lez Hern \'a ndez , I., Howe , R., & Corbard , T. 2006, title North South Asymmetry of Zonal and Meridional Flows Determined From Ring Diagram Analysis of Gong ++ Data , , 236, 227, 10.1007/s11207-006-0106-5
2006 doi
-
[42]
S., Kosovichev , A
Zhao , J., Nagashima , K., Bogart , R. S., Kosovichev , A. G., & Duvall , Jr., T. L. 2012, title Systematic Center-to-limb Variation in Measured Helioseismic Travel Times and its Effect on Inferences of Solar Interior Meridional Flows , , 749, L5, 10.1088/2041-8205/749/1/L5
2012 doi
Reviewed August 7, 2026 · model on record in the stance chip above.
Discussion (0). Sign in to comment.