REVIEW 3 major objections 5 minor 58 references
A new sample of southern radio galaxies: Host galaxy masses and star-formation rates
T0 review · 3 major / 5 minor · reviewed 2026-08-14 · deepseek-v4-flash
Pith's one-line read Powerful radio galaxies in a new southern sample live in galaxies of 10^11 to 10^12 solar masses, matching the brighter classic samples.
desk verdict A useful new southern radio galaxy catalog for HI follow-up whose headline host-mass range is conditional on unverified DES photometric redshifts. read the letter →
The pith
A machine-rendered reading of the paper's core claim, the machinery that carries it, and where it could break.
The reading
What carries the argument
The central machinery is the likelihood-ratio technique for identifying near-infrared counterparts to radio sources, applied in the Ks band using the VHS catalogue. It computes, for each candidate, the ratio of the probability of being a true counterpart to the probability of being a background galaxy, and keeps sources with reliability above 0.8. Photometric redshifts come from BPZ applied to DES SVA1 Gold photometry, and stellar masses and star-formation rates are derived by fitting Bruzual & Charlot (2003) and Maraston (2005) spectral synthesis templates with the FAST code. These quantities are then compared with the K-z relation and host masses of the 3CRR, 6C and 7CRS samples, and with the radio luminosity function of star-forming galaxies from Mauch & Sadler (2007) to test whether low-mass blue hosts are real or mismatches.
What would settle it
Take a random subset of about 30 of the 249 hosts and measure their spectroscopic redshifts; if they disagree systematically with the DES photometric redshifts for the red, massive hosts, the rest-frame radio luminosities, stellar masses, and the K-z relation would shift, and the claimed consistency with the brighter 3CRR/6C/7CRS samples would be weakened.
Extended reading notes
Core claim
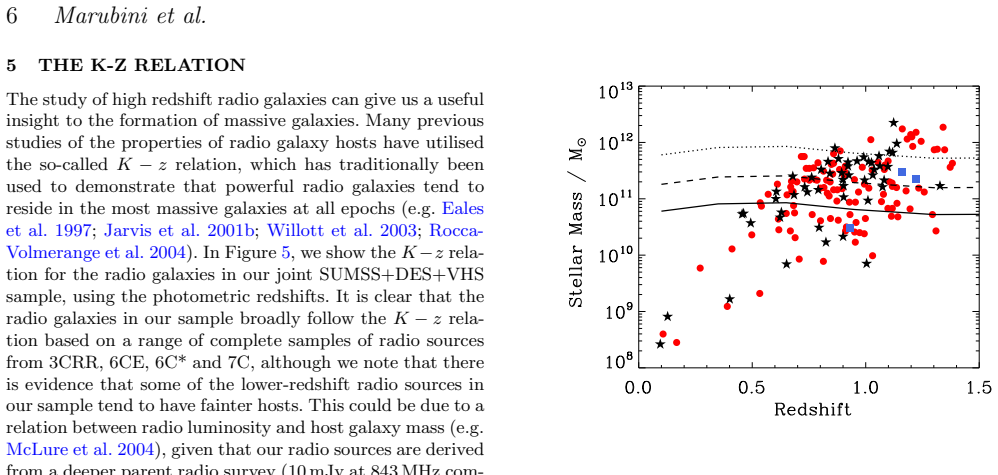
The paper claims that powerful southern radio sources selected at 843 MHz, identified to VHS near-infrared galaxies with the likelihood-ratio technique and assigned DES photometric redshifts, reside in the same massive galaxy hosts as the historically complete northern samples. The bulk of the high-redshift hosts have stellar masses between $10^{11}$ and $10^{12}$ $M_\odot$, corresponding to roughly 1 to 10 times the characteristic mass of the galaxy mass function. The sources follow the radio-galaxy K-z relation defined by 3CRR, 6C and 7CRS, and the authors find no evidence for a correlation between radio luminosity and host mass within their single flux-limited sample. The low-mass blue galaxies, which at face value look like star-forming radio hosts, are argued to be false positives because their radio powers are far too high for their SED-derived star-formation rates.
Load-bearing premise
The central assumption is that the DES photometric redshifts, calibrated on ordinary galaxies, remain accurate for these red, massive, possibly active hosts, even though none of the 249 sources has a spectroscopic redshift to verify them.
Editorial extensions
If this is right
- The 249-source catalogue gives southern-hemisphere targets for HI absorption follow-up with MeerKAT and ASKAP.
- Host masses this high at the 10 mJy flux level imply that the connection between powerful radio emission and very massive galaxies persists to lower radio luminosities than the classic bright samples probe.
- The absence of a radio luminosity-host mass correlation within this sample, combined with wider and deeper samples, would allow a direct test of whether jet power depends on galaxy mass.
- The expected false-positive fraction of about 6.8 percent bounds how much contamination remains in the final catalogue; higher-resolution radio imaging should shrink it.
Reading between the lines
- The radio-luminosity versus star-formation-rate comparison used here could serve as a generic screening tool for low-resolution radio surveys, flagging blue low-mass candidates as likely mismatches before costly spectroscopy.
- If the photometric redshifts hold up, the same SUMSS-VHS-DES pipeline could be run on the deeper EMU survey when it arrives, extending the K-z relation and host-mass distribution to fainter sources without new spectroscopy.
- The sample's effective redshift limit near z<1 is set by the 4000 Angstrom break entering the near-infrared; pushing to z>1 would require adding mid-infrared photometry to the SED fits.
Signed reviews
Editorial analysis
A structured set of objections, weighed in public.
Referee Report
Summary. The paper cross-matches the SUMSS 843 MHz radio catalogue with VHS near-infrared and DES optical data over 148 deg^2, using the likelihood-ratio technique to identify 1,195 reliable counterparts and then requiring 'good photometric information' from DES SVA1 GOLD BPZ photometric redshifts to define a final sample of 249 radio galaxies. The authors fit stellar population synthesis models with FAST to derive host stellar masses and star-formation rates, reporting that the high-redshift radio galaxy hosts typically have stellar masses between 10^11 and 10^12 solar masses, consistent with samples like 3CRR, 6C, and 7CRS. They also identify a population of low-mass blue galaxies, which they attribute to false positives in the cross-identification, and they present the sample as a target list for future HI absorption studies with MeerKAT.
Significance. If the reported mass range is correct, the paper extends host-galaxy mass measurements to a fainter radio-selected population at z ~ 0.5-1 in the southern sky, supporting the view that powerful radio AGN reside in extremely massive galaxies and providing a useful catalogue for upcoming HI absorption campaigns. The likelihood-ratio analysis is careful and includes a quantitative contamination estimate (6.8 per cent), and the comparison to the K-z relation is a useful sanity check. The photometric-redshift dependence, however, makes the central result conditional: the masses and redshifts come from the same unverified measurement chain, so the headline claim is not yet robust. The catalogue itself, with reliability estimates, is a valuable community resource.
major comments (3)
- [Section 4 and Section 6 (Figs 5 and 6)] The central claim that the bulk of high-redshift hosts have stellar masses in the range 10^11-10^12 Msun is derived by fixing the DES SVA1 GOLD BPZ photometric redshifts in FAST, and Section 4 states that no spectroscopic redshifts are available for the sample. As the authors concede in Section 8, 'their photometric redshifts could be significantly wrong.' A systematic photo-z error of ~0.1 at z ~ 1 changes the luminosity distance by 10-20 per cent and the derived stellar mass by roughly 0.4-0.5 dex, which is comparable to the width of the quoted mass range. The K-z comparison in Fig. 5 is not an independent validation because it uses the same photo-z on the x-axis. The paper needs either a spectroscopic subsample, an explicit propagation of the BPZ redshift PDFs through the FAST fitting, or a quantitative estimate of the allowed photo-z bias, before the mass range can be regarded as established.
- [Section 4 (sample selection from 1,195 to 249)] The selection step that reduces 1,195 LR counterparts with Rel>0.8 to 249 sources with 'good photometric information' is not characterized. If the DES photo-z pipeline preferentially fails or biases faint, red, or bright sources, the final sample's mass distribution could be a selection artifact. The authors should compare the 249-source sample to the parent 1,195-source set in terms of radio flux, Ks magnitude, colour, reliability, and, where possible, the DES photometric redshift quality flags. Such a comparison is needed to support the implicit claim that the 249 sources are representative of the reliable radio galaxy population in the survey area.
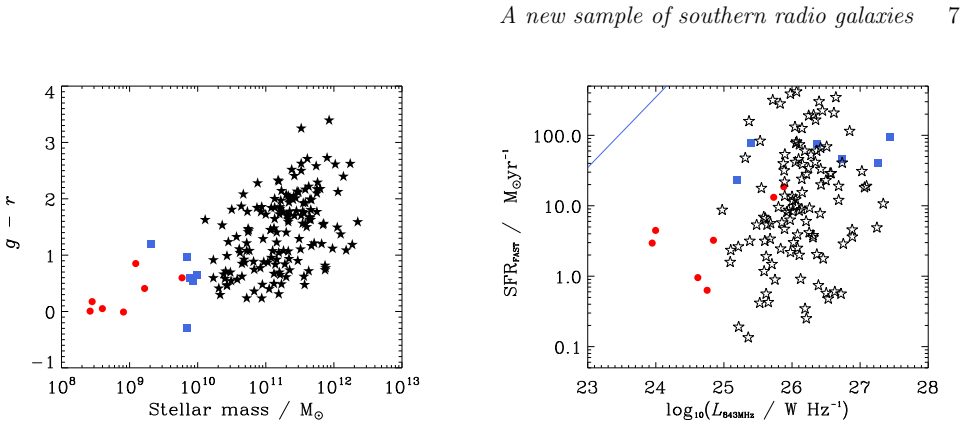
- [Section 6 and Table 1 (SFR estimates)] The SED-derived star-formation rates appear to hit a boundary in the fitting grid: Table 1 lists log10(SFR) values of -2.06 and -2.15 for galaxies with log10(M*) of ~11.7, which are effectively zero and unphysical. This suggests that the FAST grid does not adequately sample low SFRs for passive galaxies. The paper states that varying the SPS model, SFH, and IMF gives a scatter of less than 0.2 dex, but does not show the basis for this claim or clarify whether it applies to SFR as well as mass. Since Section 7 uses the SFR comparison to argue that the low-mass blue galaxies are false positives, the reliability of the SFR estimates is load-bearing. The authors should display the SFR uncertainties and the variation across model choices, or temper the conclusion to acknowledge that the SFR measurements are not sufficiently reliable to distinguish false positives from genuine low-mass hosts.
minor comments (5)
- [Abstract] The word 'mid-identifications' in the abstract should be 'misidentifications'.
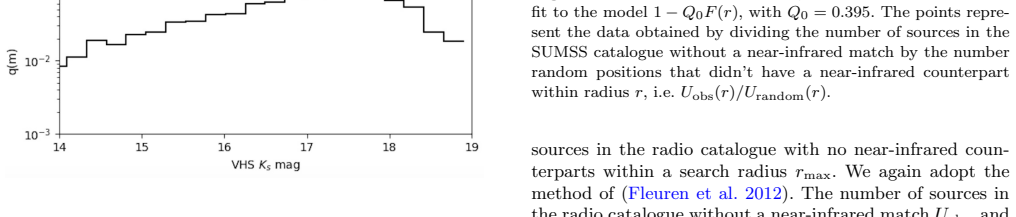
- [Section 3, paragraph on Q0] The sentence containing 'This is in line with expectationsl' contains a typo: 'expectationsl' should be 'expectations'.
- [Table 1] Several entries are missing J- and H-band magnitudes (e.g., IDs 4 and 6); the table notes or caption should state whether these are non-detections, upper limits, or data gaps in the VHS coverage.
- [Section 6, final paragraph] The statement 'we find no evidence for this in our sample' regarding the radio luminosity-host mass relation could be strengthened by providing a quantitative test, e.g., a Spearman rank test between L_843 and M* within the flux-limited sample, since the absence of evidence is otherwise difficult to interpret.
- [Figure 8 caption] The caption should specify which Delhaize et al. (2017) and Novak et al. (2017) relation is plotted (e.g., the SFR-L_1.4GHz relation for star-forming galaxies) and the assumed band and spectral index used to convert to 843 MHz.
Circularity Check
No significant circularity: the host-galaxy mass and SFR results are derived from external photometric redshift data and independent comparison relations, not from fitted inputs renamed as predictions.
full rationale
The paper's central claims rest on independent data products and standard external calibrations, not on self-referential definitions. The likelihood-ratio method (Section 3) uses the external calibrators of Sutherland & Saunders, Ciliegi, Fleuren and Smith; the only internally fitted quantity, Q0, enters the contamination estimate (Eqs. 6-9) and does not feed the stellar-mass or SFR conclusions. Stellar masses (Section 6) come from FAST SED fitting with Bruzual & Charlot (2003) and Maraston (2005) templates, and the resulting mass range is compared with external benchmarks from Seymour et al. (2007), Wright et al. (2017), and Ilbert et al. (2013). The SFR-vs-radio-luminosity comparison (Section 7) uses the independent Delhaize et al. (2017) and Novak et al. (2017) relations. The K-z consistency check (Section 5) uses photometric redshifts on the x-axis, but that is a consistency test, not the derivation of the mass range, and it is not used to force the masses. The reliance on DES SVA1 photometric redshifts, with the acknowledged absence of spectroscopy and the Section 8 admission that 'their photometric redshifts could be significantly wrong,' is a genuine accuracy limitation but not a circularity: no equation defines the output in terms of itself, and no fitted parameter is renamed as a prediction. Self-citations to Jarvis et al. (2016) and McAlpine et al. (2012) are for the DES data release and for a standard likelihood-ratio implementation; they are not load-bearing circular justifications. Overall, the derivation chain is self-contained with respect to external benchmarks and exhibits no significant circularity.
Assumptions & free parameters
free parameters (3)
- Q0 =
0.395
- Spectral index alpha =
0.7
- Reliability threshold =
0.8
assumptions (6)
- domain assumption Planck cosmology with H0=67.7 km/s/Mpc, Omega_M=0.31, Omega_Lambda=0.69
- domain assumption The spectral synthesis models of Bruzual & Charlot (2003) and Maraston (2005) accurately represent the stellar populations of radio galaxy hosts
- domain assumption Exponentially declining star formation history and a Salpeter IMF are assumed in the SED fitting
- domain assumption DES SVA1 Gold photometric redshifts (BPZ, calibrated by Sanchez et al. 2014) are accurate for the radio source hosts
- domain assumption The positional error model sigma_pos = 0.655 * theta_FWHM / SNR from Ivison et al. (2007) is valid for SUMSS
- domain assumption The radio luminosity versus star-formation rate relations of Delhaize et al. (2017) and Novak et al. (2017) apply to the low-redshift sources
Cite this review
Pith. "Pith review of A new sample of southern radio galaxies: Host galaxy masses and star-formation rates." pith.science (2026). https://pith.science/paper/PIP4UZCS
@misc{pith2026190808761,
  author       = {Pith},
  title        = {Pith review of: A new sample of southern radio galaxies: Host galaxy masses and star-formation rates},
  year         = {2026},
  howpublished = {\url{https://pith.science/paper/PIP4UZCS}},
  note         = {Machine review of arXiv:1908.08761}
}
abstract
In this study we define a new sample of distant powerful radio galaxies in order to study their host-galaxy properties and provide targets for future observations of HI absorption with new radio telescopes and to understand the fuelling and feedback from such sources. We have cross-matched the Sydney University Molonglo Sky Survey (SUMSS) radio catalogue at 843 MHz with the VISTA Hemisphere Survey (VHS) near-infrared catalogue using the Likelihood Ratio technique. Photometric redshifts from the Dark Energy Survey are then used to assign redshifts to the radio source counterparts. We found a total of 249 radio sources with photometric redshifts over a 148 deg^2 region. By fitting the optical and near-infrared photometry with spectral synthesis models we determine the stellar mass and star-formation rates of the radio sources, finding typical stellar masses of 10^{11} - 10^{12}M$_{\odot}$ for the powerful high-redshift radio galaxies. We also find a population of low-mass blue galaxies. However, by comparing the derived star-formation rates to the radio luminosity, we suggest that these sources are false positives in our likelihood ratio analysis. Follow up, higher-resolution (<5 arcsec) radio imaging would help alleviate these mid-identifications, as the limiting factor in our cross-identifications is the low resolution (~45 arcsec) of the SUMSS radio imaging.
Figures


Figures from the paper (4 more)


Reference graph
Works this paper leans on
-
[1]
Abazajian K. N., et al., 2009, @doi [ ] 10.1088/0067-0049/182/2/543 , http://adsabs.harvard.edu/abs/2009ApJS..182..543A 182, 543
-
[2]
Allison J. R., et al., 2015, @doi [ ] 10.1093/mnras/stv1532 , http://adsabs.harvard.edu/abs/2015MNRAS.453.1249A 453, 1249
-
[3]
Banerji M., et al., 2015, @doi [ ] 10.1093/mnras/stu2261 , http://adsabs.harvard.edu/abs/2015MNRAS.446.2523B 446, 2523
-
[4]
Beckmann R. S., et al., 2017, @doi [ ] 10.1093/mnras/stx1831 , http://adsabs.harvard.edu/abs/2017MNRAS.472..949B 472, 949
-
[5]
Ben \' tez N., 2000, @doi [ ] 10.1086/308947 , http://adsabs.harvard.edu/abs/2000ApJ...536..571B 536, 571
doi:10.1086/308947 2000
-
[6]
Best P. N., Longair M. S., Roettgering H. J. A., 1997, @doi [ ] 10.1093/mnras/292.4.758 , http://adsabs.harvard.edu/abs/1997MNRAS.292..758B 292, 758
-
[7]
Blundell K. M., Rawlings S., Willott C. J., 1999, @doi [ ] 10.1086/300721 , http://adsabs.harvard.edu/abs/1999AJ....117..677B 117, 677
doi:10.1086/300721 1999
- [8]
Show all 58 references
-
[9]
C.-J., Large M
Bock D. C.-J., Large M. I., Sadler E. M., 1999, @doi [ ] 10.1086/300786 , http://adsabs.harvard.edu/abs/1999AJ....117.1578B 117, 1578
1999 doi
-
[12]
Camilo F., et al., 2018, @doi [ ] 10.3847/1538-4357/aab35a , http://adsabs.harvard.edu/abs/2018ApJ...856..180C 856, 180
2018 doi
-
[13]
Ciliegi P., Zamorani G., Hasinger G., Lehmann I., Szokoly G., Wilson G., 2003, @doi [A&A] 10.1051/0004-6361:20021721 , http://adsabs.harvard.edu/abs/2003A
2003 doi
-
[15]
Crocce M., et al., 2016, @doi [ ] 10.1093/mnras/stv2590 , https://ui.adsabs.harvard.edu/abs/2016MNRAS.455.4301C 455, 4301
2016 doi
-
[18]
Dark Energy Survey Collaboration et al., 2016, @doi [ ] 10.1093/mnras/stw641 , http://adsabs.harvard.edu/abs/2016MNRAS.460.1270D 460, 1270
2016 doi
-
[19]
Delhaize J., et al., 2017, @doi [ ] 10.1051/0004-6361/201629430 , http://adsabs.harvard.edu/abs/2017A
2017 doi
-
[21]
Eales S., Rawlings S., Law-Green D., Cotter G., Lacy M., 1997, @doi [ ] 10.1093/mnras/291.4.593 , http://adsabs.harvard.edu/abs/1997MNRAS.291..593E 291, 593
1997 doi
-
[22]
Fernandes C. A. C., et al., 2015, @doi [ ] 10.1093/mnras/stu2517 , https://ui.adsabs.harvard.edu/abs/2015MNRAS.447.1184F 447, 1184
2015 doi
-
[23]
Flaugher B., et al., 2015, @doi [ ] 10.1088/0004-6256/150/5/150 , http://adsabs.harvard.edu/abs/2015AJ....150..150F 150, 150
2015 doi
-
[25]
Gupta N., et al., 2017, preprint, http://adsabs.harvard.edu/abs/2017arXiv170807371G ( @eprint arXiv 1708.07371 )
2017 arXiv
-
[26]
J., Alexander P., Pooley G
Hardcastle M. J., Alexander P., Pooley G. G., Riley J. M., 1998, @doi [ ] 10.1046/j.1365-8711.1998.01480.x , http://adsabs.harvard.edu/abs/1998MNRAS.296..445H 296, 445
1998
-
[27]
Ilbert O., et al., 2013, @doi [ ] 10.1051/0004-6361/201321100 , http://adsabs.harvard.edu/abs/2013A
2013 doi
-
[29]
J., Rawlings S., 2000, @doi [ ] 10.1046/j.1365-8711.2000.03801.x , http://adsabs.harvard.edu/abs/2000MNRAS.319..121J 319, 121
Jarvis M. J., Rawlings S., 2000, @doi [ ] 10.1046/j.1365-8711.2000.03801.x , http://adsabs.harvard.edu/abs/2000MNRAS.319..121J 319, 121
2000
-
[31]
J., Rawlings S., Eales S., Blundell K
Jarvis M. J., Rawlings S., Eales S., Blundell K. M., Bunker A. J., Croft S., McLure R. J., Willott C. J., 2001b, @doi [ ] 10.1111/j.1365-2966.2001.04730.x , http://adsabs.harvard.edu/abs/2001MNRAS.326.1585J 326, 1585
2001
-
[33]
Jarvis M., et al., 2016, @doi [ ] 10.1093/mnras/stw990 , http://adsabs.harvard.edu/abs/2016MNRAS.460.2245J 460, 2245
2016 doi
-
[34]
J., et al., 2017, preprint, http://adsabs.harvard.edu/abs/2017arXiv170901901J ( @eprint arXiv 1709.01901 )
Jarvis M. J., et al., 2017, preprint, http://adsabs.harvard.edu/abs/2017arXiv170901901J ( @eprint arXiv 1709.01901 )
2017 arXiv
-
[35]
Johnston S., et al., 2008, @doi [Experimental Astronomy] 10.1007/s10686-008-9124-7 , http://adsabs.harvard.edu/abs/2008ExA....22..151J 22, 151
2008 doi
-
[36]
L., 2009, @doi [IEEE Proceedings] 10.1109/JPROC.2009.2020713 , http://adsabs.harvard.edu/abs/2009IEEEP..97.1522J 97, 1522
Jonas J. L., 2009, @doi [IEEE Proceedings] 10.1109/JPROC.2009.2020713 , http://adsabs.harvard.edu/abs/2009IEEEP..97.1522J 97, 1522
2009
-
[37]
R., Alexander P., 1997, @doi [ ] 10.1093/mnras/286.1.215 , http://adsabs.harvard.edu/abs/1997MNRAS.286..215K 286, 215
Kaiser C. R., Alexander P., 1997, @doi [ ] 10.1093/mnras/286.1.215 , http://adsabs.harvard.edu/abs/1997MNRAS.286..215K 286, 215
1997 doi
-
[38]
G., Labb \'e I., Franx M., Illingworth G
Kriek M., van Dokkum P. G., Labb \'e I., Franx M., Illingworth G. D., Marchesini D., Quadri R. F., 2009, @doi [ ] 10.1088/0004-637X/700/1/221 , http://adsabs.harvard.edu/abs/2009ApJ...700..221K 700, 221
2009 doi
-
[39]
A., Riley J
Laing R. A., Riley J. M., Longair M. S., 1983, @doi [ ] 10.1093/mnras/204.1.151 , http://adsabs.harvard.edu/abs/1983MNRAS.204..151L 204, 151
1983 doi
-
[40]
J., Longair M
Lilly S. J., Longair M. S., 1984, @doi [ ] 10.1093/mnras/211.4.833 , http://adsabs.harvard.edu/abs/1984MNRAS.211..833L 211, 833
1984 doi
-
[41]
Maraston C., 2005, @doi [ ] 10.1111/j.1365-2966.2005.09270.x , http://adsabs.harvard.edu/abs/2005MNRAS.362..799M 362, 799
2005
-
[42]
M., 2007, @doi [ ] 10.1111/j.1365-2966.2006.11353.x , http://adsabs.harvard.edu/abs/2007MNRAS.375..931M 375, 931
Mauch T., Sadler E. M., 2007, @doi [ ] 10.1111/j.1365-2966.2006.11353.x , http://adsabs.harvard.edu/abs/2007MNRAS.375..931M 375, 931
2007
-
[44]
McAlpine K., Smith D. J. B., Jarvis M. J., Bonfield D. G., Fleuren S., 2012, @doi [ ] 10.1111/j.1365-2966.2012.20715.x , http://adsabs.harvard.edu/abs/2012MNRAS.423..132M 423, 132
2012
-
[45]
J., Bonfield D
McAlpine K., Jarvis M. J., Bonfield D. G., 2013, @doi [ ] 10.1093/mnras/stt1638 , http://adsabs.harvard.edu/abs/2013MNRAS.436.1084M 436, 1084
2013 doi
-
[48]
G., Banerji M., Gonzalez E., Koposov S
McMahon R. G., Banerji M., Gonzalez E., Koposov S. E., Bejar V. J., Lodieu N., Rebolo R., VHS Collaboration 2013, The Messenger, http://adsabs.harvard.edu/abs/2013Msngr.154...35M 154, 35
2013
-
[49]
Y., 1981, Proceedings of the Astronomical Society of Australia, http://adsabs.harvard.edu/abs/1981PASAu...4..156M 4, 156
Mills B. Y., 1981, Proceedings of the Astronomical Society of Australia, http://adsabs.harvard.edu/abs/1981PASAu...4..156M 4, 156
1981
-
[50]
P., et al., 2011, @doi [ ] 10.1071/AS11021 , http://adsabs.harvard.edu/abs/2011PASA...28..215N 28, 215
Norris R. P., et al., 2011, @doi [ ] 10.1071/AS11021 , http://adsabs.harvard.edu/abs/2011PASA...28..215N 28, 215
2011 doi
-
[51]
Novak M., et al., 2017, @doi [ ] 10.1051/0004-6361/201629436 , http://adsabs.harvard.edu/abs/2017A
2017 doi
-
[52]
B., et al., 2016, @doi [ ] 10.1093/mnras/stw910 , http://adsabs.harvard.edu/abs/2016MNRAS.460....2P 460, 2
Pracy M. B., et al., 2016, @doi [ ] 10.1093/mnras/stw910 , http://adsabs.harvard.edu/abs/2016MNRAS.460....2P 460, 2
2016 doi
-
[53]
Prescott M., et al., 2016, @doi [ ] 10.1093/mnras/stv3020 , http://adsabs.harvard.edu/abs/2016MNRAS.457..730P 457, 730
2016 doi
-
[54]
J., 2004, @doi [ ] 10.1111/j.1365-2966.2004.08234.x , http://adsabs.harvard.edu/abs/2004MNRAS.355L...9R 355, L9
Rawlings S., Jarvis M. J., 2004, @doi [ ] 10.1111/j.1365-2966.2004.08234.x , http://adsabs.harvard.edu/abs/2004MNRAS.355L...9R 355, L9
2004
-
[56]
E., Argyle J., Best P
Rigby E. E., Argyle J., Best P. N., Rosario D., R \"o ttgering H. J. A., 2015, @doi [ ] 10.1051/0004-6361/201526475 , http://adsabs.harvard.edu/abs/2015A
2015 doi
-
[57]
Rocca-Volmerange B., Le Borgne D., De Breuck C., Fioc M., Moy E., 2004, @doi [ ] 10.1051/0004-6361:20031717 , http://adsabs.harvard.edu/abs/2004A
2004 doi
-
[58]
M., et al., 2007, @doi [ ] 10.1111/j.1365-2966.2007.12231.x , http://adsabs.harvard.edu/abs/2007MNRAS.381..211S 381, 211
Sadler E. M., et al., 2007, @doi [ ] 10.1111/j.1365-2966.2007.12231.x , http://adsabs.harvard.edu/abs/2007MNRAS.381..211S 381, 211
2007
-
[59]
E., 1955, @doi [ ] 10.1086/145971 , http://adsabs.harvard.edu/abs/1955ApJ...121..161S 121, 161
Salpeter E. E., 1955, @doi [ ] 10.1086/145971 , http://adsabs.harvard.edu/abs/1955ApJ...121..161S 121, 161
1955 doi
-
[60]
S \'a nchez C., et al., 2014, @doi [ ] 10.1093/mnras/stu1836 , https://ui.adsabs.harvard.edu/abs/2014MNRAS.445.1482S 445, 1482
2014 doi
-
[61]
Schaye J., et al., 2015, @doi [ ] 10.1093/mnras/stu2058 , http://adsabs.harvard.edu/abs/2015MNRAS.446..521S 446, 521
2015 doi
-
[62]
Seymour N., et al., 2007, @doi [ ] 10.1086/517887 , http://adsabs.harvard.edu/abs/2007ApJS..171..353S 171, 353
2007 doi
-
[63]
F., Nelson D., Hernquist L., 2015, @doi [ ] 10.1093/mnras/stv1340 , http://adsabs.harvard.edu/abs/2015MNRAS.452..575S 452, 575
Sijacki D., Vogelsberger M., Genel S., Springel V., Torrey P., Snyder G. F., Nelson D., Hernquist L., 2015, @doi [ ] 10.1093/mnras/stv1340 , http://adsabs.harvard.edu/abs/2015MNRAS.452..575S 452, 575
2015 doi
-
[64]
Smith D. J. B., et al., 2011, @doi [MNRAS] 10.1111/j.1365-2966.2011.18827.x , http://adsabs.harvard.edu/abs/2011MNRAS.416..857S 416, 857
2011
-
[65]
Smol c i \'c V., et al., 2017, @doi [ ] 10.1051/0004-6361/201730685 , http://adsabs.harvard.edu/abs/2017A
2017 doi
-
[66]
Sutherland W., Saunders W., 1992, @doi [MNRAS] 10.1093/mnras/259.3.413 , http://adsabs.harvard.edu/abs/1992MNRAS.259..413S 259, 413
1992 doi
-
[67]
J., Rawlings S., Blundell K
Willott C. J., Rawlings S., Blundell K. M., Lacy M., Eales S. A., 2001, @doi [ ] 10.1046/j.1365-8711.2001.04101.x , http://adsabs.harvard.edu/abs/2001MNRAS.322..536W 322, 536
2001
-
[68]
J., Rawlings S., Blundell K
Willott C. J., Rawlings S., Blundell K. M., Lacy M., Hill G. J., Scott S. E., 2002, @doi [ ] 10.1046/j.1365-8711.2002.05718.x , http://adsabs.harvard.edu/abs/2002MNRAS.335.1120W 335, 1120
2002
-
[69]
J., Rawlings S., Jarvis M
Willott C. J., Rawlings S., Jarvis M. J., Blundell K. M., 2003, @doi [ ] 10.1046/j.1365-8711.2003.06172.x , http://adsabs.harvard.edu/abs/2003MNRAS.339..173W 339, 173
2003
-
[70]
L., et al., 2010, @doi [ ] 10.1088/0004-6256/140/6/1868 , http://adsabs.harvard.edu/abs/2010AJ....140.1868W 140, 1868
Wright E. L., et al., 2010, @doi [ ] 10.1088/0004-6256/140/6/1868 , http://adsabs.harvard.edu/abs/2010AJ....140.1868W 140, 1868
2010 doi
-
[71]
H., et al., 2017, @doi [ ] 10.1093/mnras/stx1149 , http://adsabs.harvard.edu/abs/2017MNRAS.470..283W 470, 283
Wright A. H., et al., 2017, @doi [ ] 10.1093/mnras/stx1149 , http://adsabs.harvard.edu/abs/2017MNRAS.470..283W 470, 283
2017 doi
-
[72]
de Jong J. T. A., et al., 2015, @doi [ ] 10.1051/0004-6361/201526601 , http://adsabs.harvard.edu/abs/2015A
2015 doi
Reviewed August 14, 2026 · model on record in the stance chip above.
Discussion (0). Continue with ORCID to comment.