REVIEW 4 major objections 5 minor 87 references
Synthetic observations of dust emission and polarisation of Galactic cold clumps
T0 review · 4 major / 5 minor · reviewed 2026-08-14 · deepseek-v4-flash
Pith's one-line read This paper argues that the observed decrease in polarisation fraction towards Galactic cold clumps is too large to be caused by magnetic field geometry alone, so imperfect grain alignment by radiative torques is likely required.
desk verdict A careful synthetic-observation study that makes a plausible case for RAT-induced depolarisation in PGCC clumps, but the observational benchmark is too preliminary to pin the number down. read the letter →
The pith
A machine-rendered reading of the paper's core claim, the machinery that carries it, and where it could break.
The reading
What carries the argument
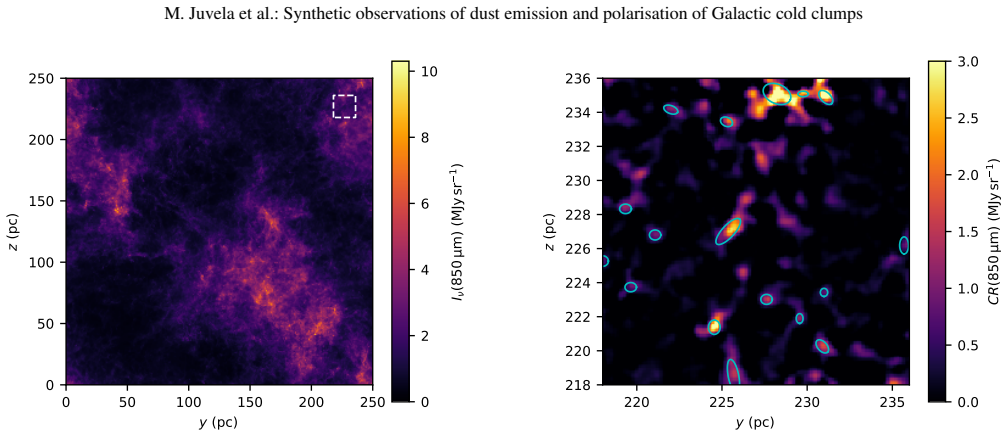
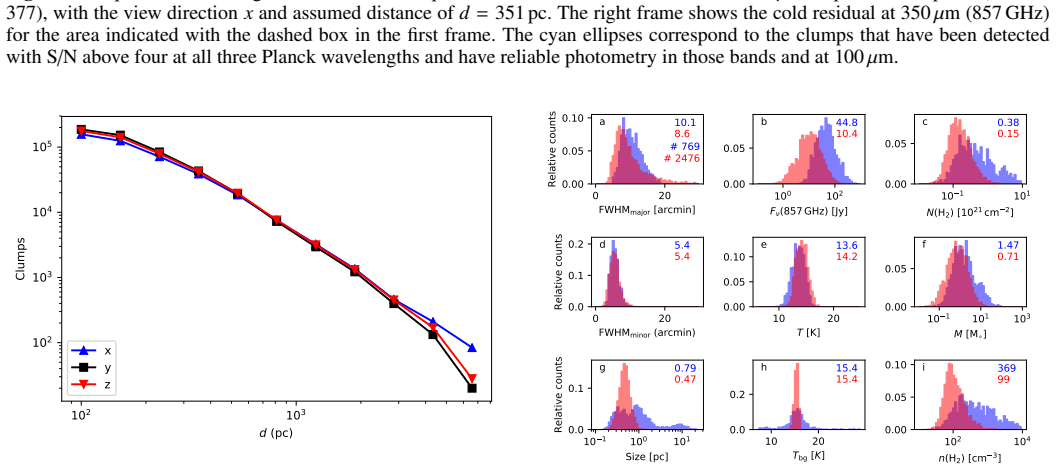
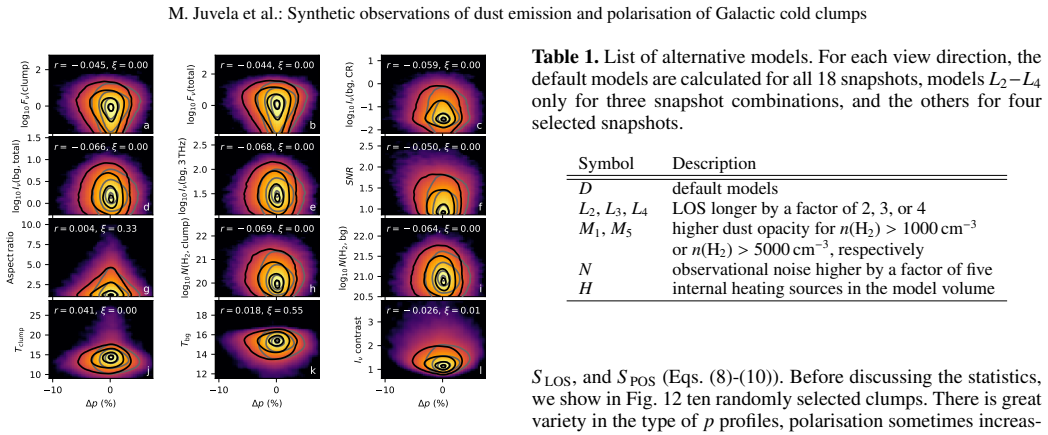
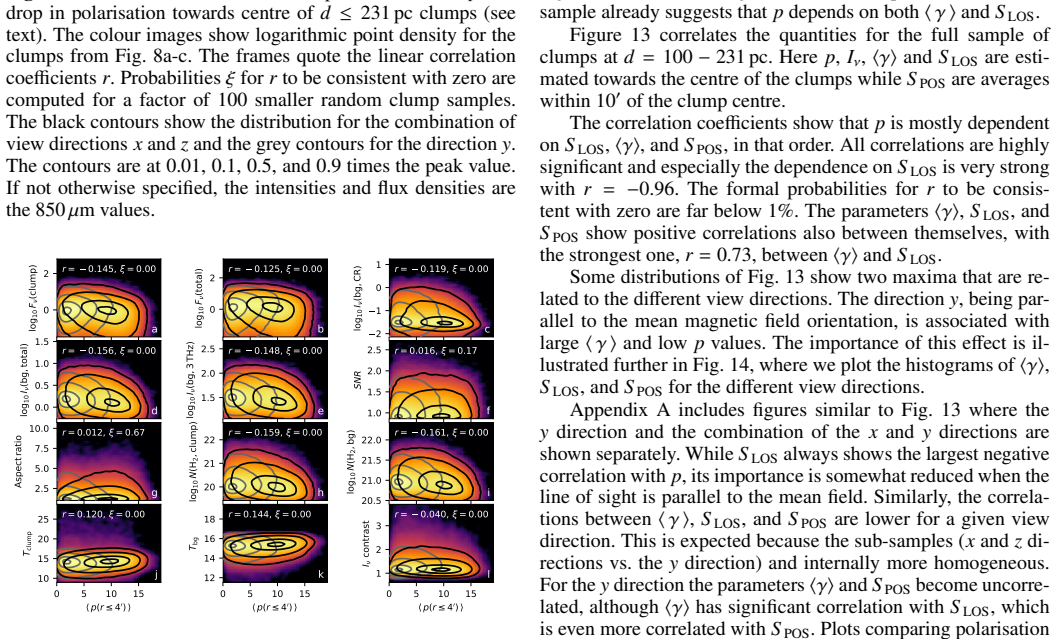
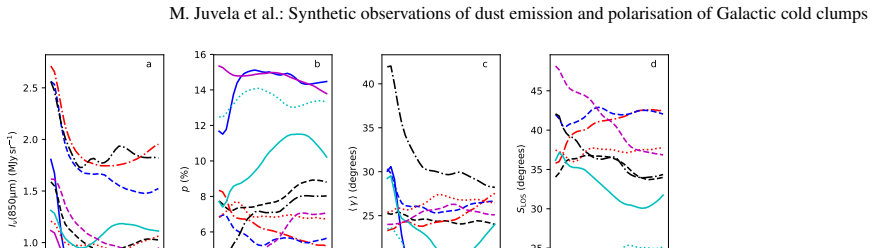
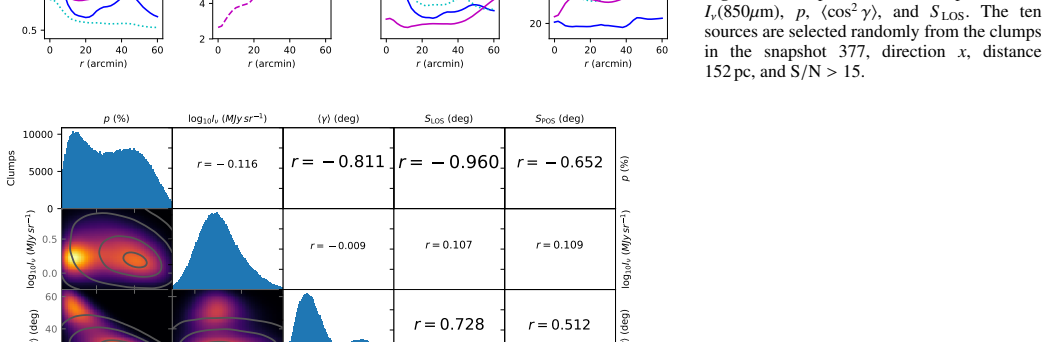
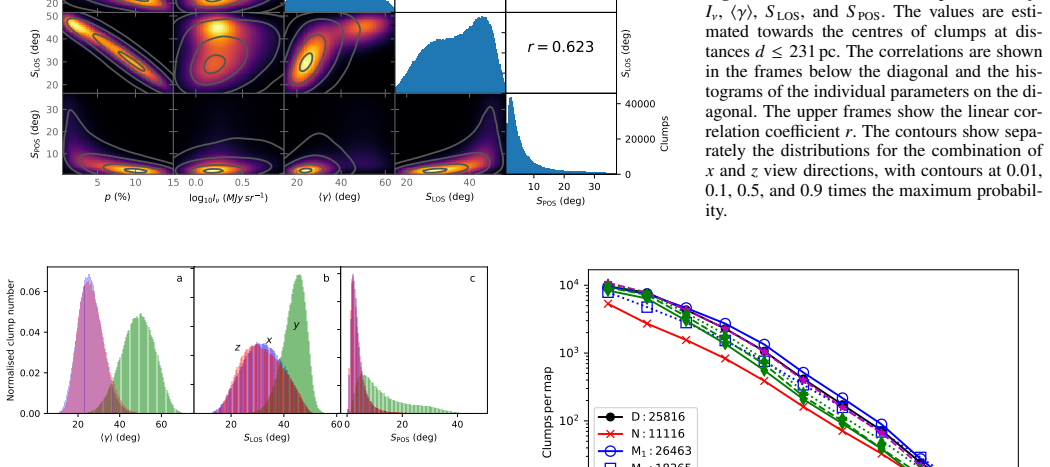
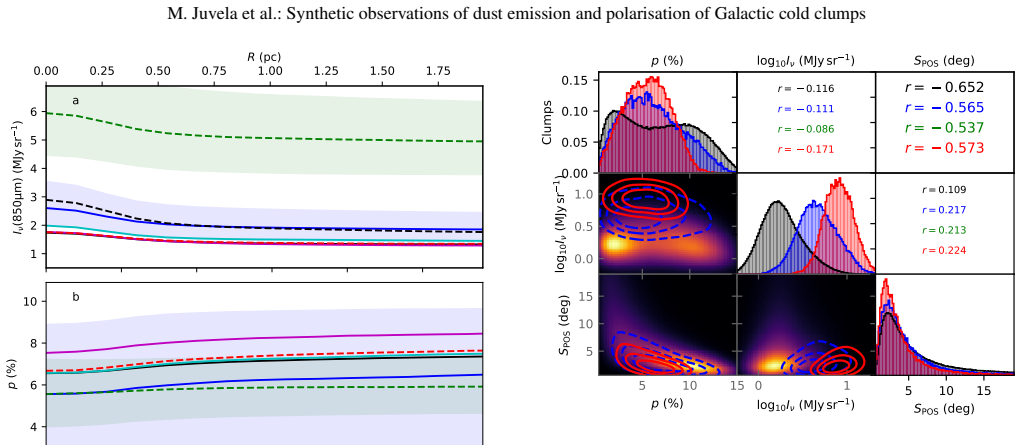
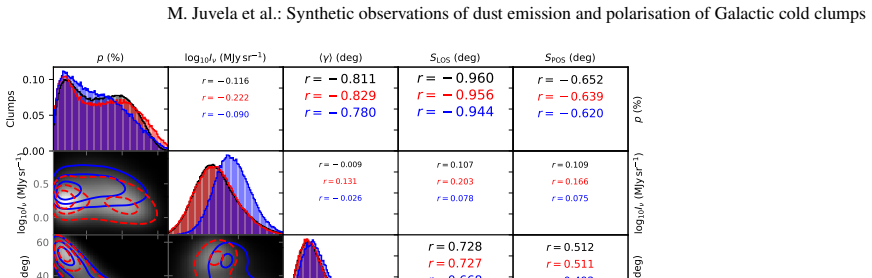
The argument is carried by a chain of synthetic observations: MHD snapshots of a 250 pc box of supernova-driven turbulence with a uniform mean magnetic field; Monte Carlo radiative transfer (the SOC code) that solves dust temperatures, 100–850 $\mu$m surface brightness, and 353 GHz Stokes $I,Q,U$ under constant grain alignment; and a clump-extraction algorithm that mirrors the PGCC detection pipeline. The load-bearing diagnostics are the radial profile of the polarisation fraction, the centre-to-background $p$ contrast, and two line-of-sight field-geometry descriptors: $\langle \cos^2\gamma\rangle$, the emission-weighted projection of the magnetic field onto the plane of the sky, and $S_{\rm LOS}$, the polarisation-angle dispersion along the line of sight. The near-perfect anticorrelation between $p$ and $S_{\rm LOS}$ ($r\approx-0.96$) shows that field tangling is what controls $p$ in the model, yet it produces only a small net drop.
What would settle it
If a sample of PGCC clumps with line-of-sight angles measured close to the plane of the sky ($\gamma\approx 0^\circ$, so that projection effects are minimised) and with low enough extinction for radiative torques to keep grains aligned shows a centre-to-background polarisation contrast near 0.85 rather than 0.60, the claim that extra depolarisation requires alignment loss would be overturned; a contrast near 0.60 in exactly that sample would confirm it.
Extended reading notes
Core claim
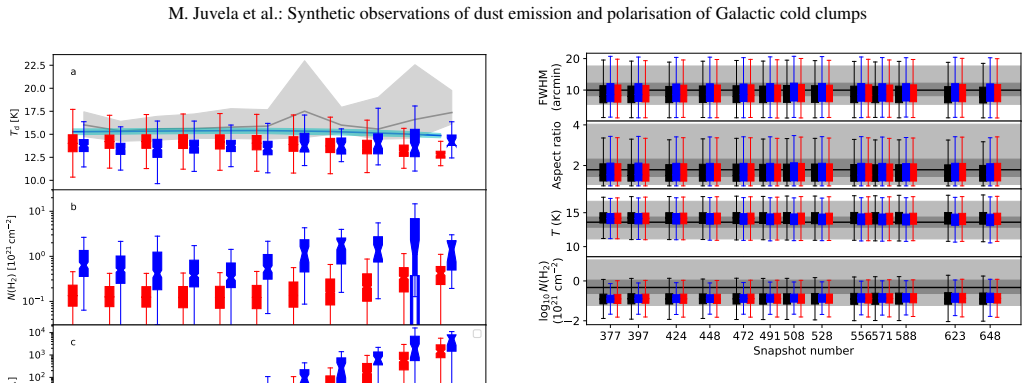
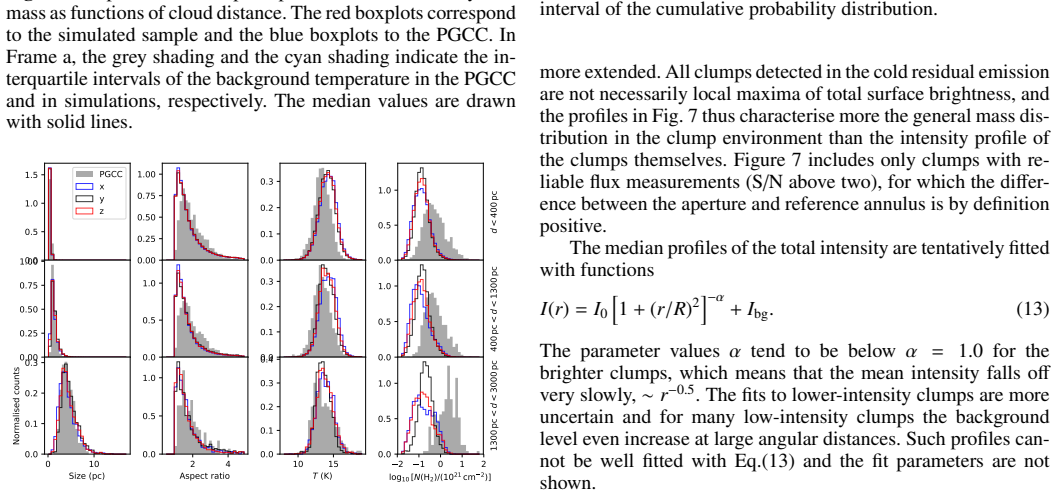
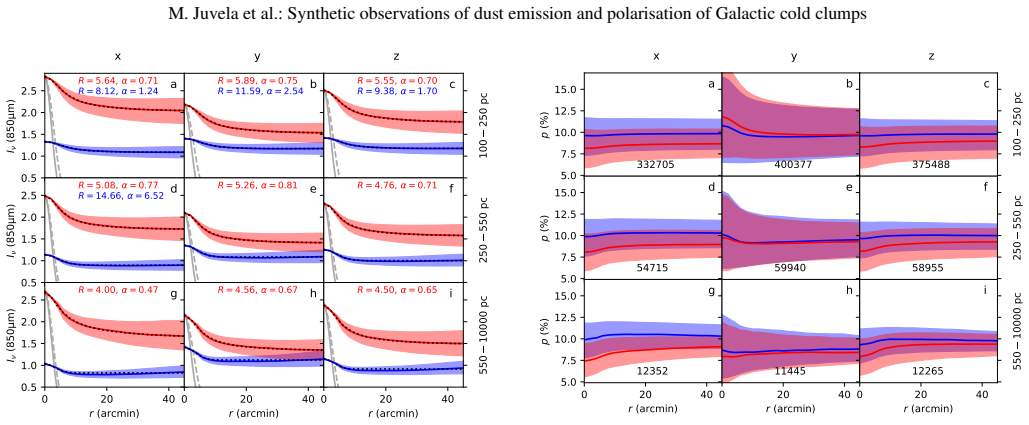
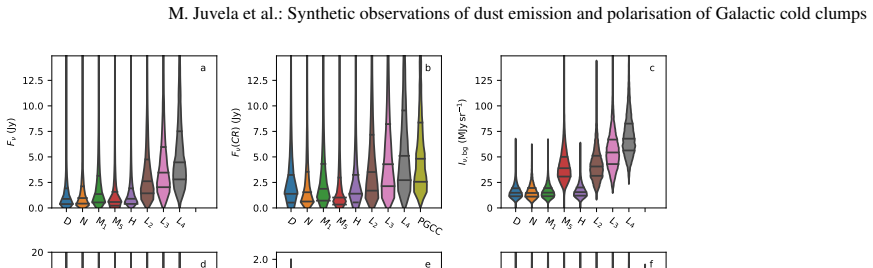
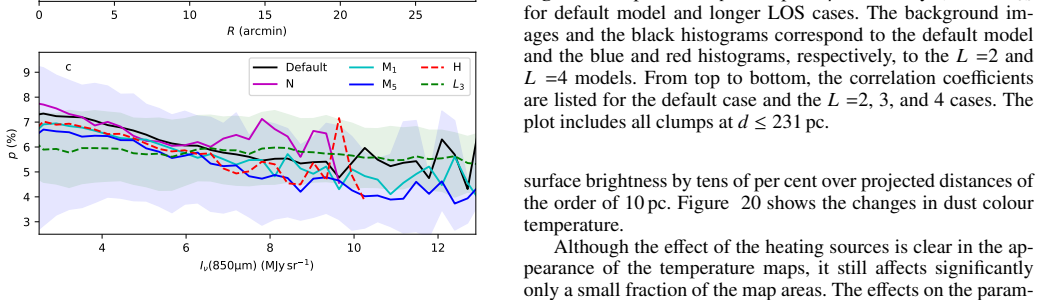
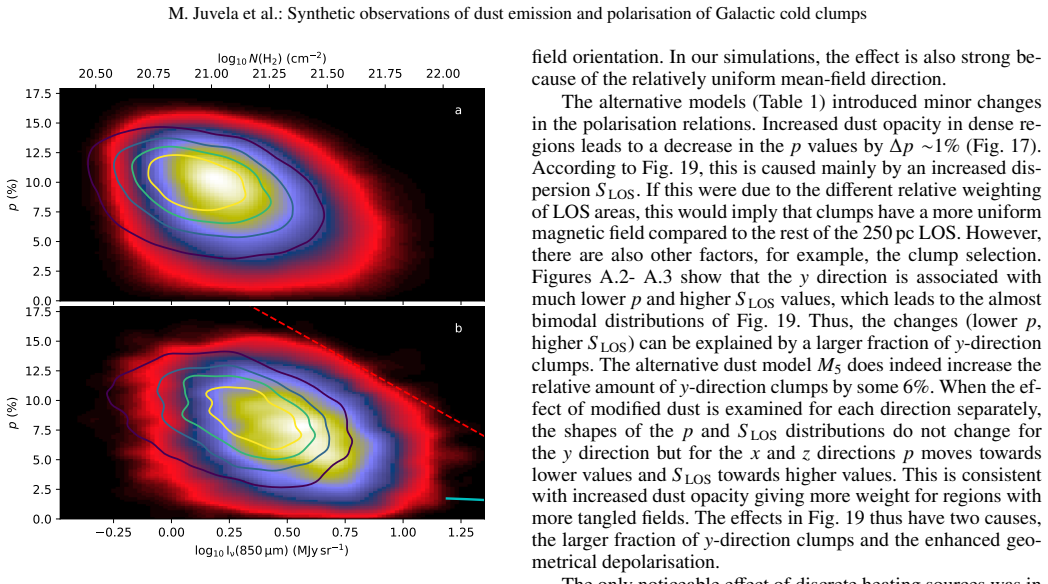
The paper's central claim is that geometrical depolarisation is too weak to explain the observed polarisation decrease in cold clumps. In the synthetic observations, the centre-to-background ratio of the polarisation fraction is about 0.85 and the radial drop is of order $1\%$, whereas the PGCC clumps show a ratio near 0.60. Because the simulations assume constant grain alignment efficiency, the extra drop in the real clumps must come from another factor, and the paper points to the radiative torque (RAT) mechanism, which weakens alignment in dense, shielded gas. A related, secondary claim is that the lower fluxes and column densities of the synthetic clumps are explained by the model's lower column density, not by a different dust opacity.
Load-bearing premise
The comparison assumes that the simulated 250 pc volume, with its uniform mean magnetic field, constant grain alignment efficiency, and mean column density $N({\rm H}) = 3.8\times10^{21}$ cm$^{-2}$, is representative of the sightlines toward real PGCC clumps, which have mean column densities near $8.3\times10^{21}$ cm$^{-2}$ and unknown field geometry.
Editorial extensions
If this is right
- The observed polarisation drop towards PGCC clumps becomes a diagnostic of grain-alignment physics, not merely of magnetic field geometry.
- Column densities and masses derived from Planck cold-clump photometry should be treated with line-of-sight confusion in mind, since the synthetic clumps show that projection effects raise fluxes as the line of sight lengthens.
- Simulations that aim to predict dust polarisation in star-forming regions must include realistic, environment-dependent grain alignment efficiency rather than a fixed one.
- The sign and magnitude of the radial $p$ gradient depend on the angle between the line of sight and the mean magnetic field, so interpretation of observations requires a handle on that angle.
Reading between the lines
- The same synthetic-observation pipeline could be applied to higher-resolution cold-core catalogues (e.g., Herschel or SCUBA-2 selected sources) to test whether the $p$ contrast scales with column density in the way RAT predicts.
- A quantitative test of the RAT interpretation would be to rerun the analysis with a position-dependent alignment prescription; the observed contrast of 0.60 then becomes a target that the grain-alignment model must reproduce.
- If near-infrared extinction data were available for PGCC clumps, the comparison between simulated and observed column densities could be turned into a direct measurement of submillimetre dust emissivity, breaking the degeneracy the paper acknowledges.
Signed reviews
Editorial analysis
A structured set of objections, weighed in public.
Referee Report
Summary. This paper generates synthetic observations of dust emission and polarisation from MHD simulations of a 250 pc supernova-driven turbulent box (18 snapshots, 512^3 root grid), using the SOC Monte Carlo radiative transfer code. The authors run a source-extraction pipeline closely following the PGCC cold-clump algorithm, producing about 1.5 million synthetic clumps over 12 distances and 3 viewing directions, and compare their sizes, fluxes, temperatures, column densities, and polarisation properties with the Planck PGCC catalogue. The principal quantitative result is that, for lines of sight perpendicular to the mean magnetic field, the polarisation fraction p decreases toward clump centres by only about 1 percentage point, with a centre-to-background polarisation contrast of 0.85, whereas a preliminary analysis of the PGCC clumps yields a contrast of about 0.60. The paper interprets this residual as evidence for additional depolarisation in real clumps, most plausibly grain-alignment loss predicted by the radiative-torque alignment mechanism, while cautioning that dust opacity changes cannot be quantified from this study.
Significance. The paper is significant because it is one of the few attempts to compare PGCC-like cold-clump populations extracted from MHD simulations with the full Planck catalogue, and it isolates the geometrical contribution to polarisation-fraction variations under constant grain alignment. The robustness tests (longer lines of sight, modified dust opacity, increased noise, internal heating) are valuable and show which conclusions are stable, and the large synthetic sample gives the statistical comparison real weight. If the quantitative comparison can be established with a matched analysis pipeline, the conclusion that geometric depolarisation alone underproduces the observed p drop would provide a useful constraint on grain-alignment physics in cold clumps. However, the central RAT inference depends on a comparison whose two sides are not currently measured with a common definition, so the significance is conditional on completing that matched comparison.
major comments (4)
- [Section 4.4 / Appendix B / Fig. 16i] The central numerical comparison underpinning the RAT suggestion is not a matched one. In Section 4.4 the synthetic contrast is quoted as 0.85, defined as the ratio of p at the clump centre to p in a background at 30 arcmin distance, for x/z views at 5 arcmin resolution and d=231 pc; Fig. 16i defines the 'p contrast' as the ratio of means at R<4 arcmin and R=10-16 arcmin; and Appendix B defines the PGCC contrast as p at the centre divided by the mean over R=16-20 arcmin, using maps convolved to 10 arcmin. No uncertainties are quoted for the PGCC value. Because p contrasts depend on beam size, annulus choice, distance, and line-of-sight confusion, the 0.85 versus 0.60 gap cannot be attributed to grain alignment until the same measurement definition is applied to both samples and the observational errors are propagated.
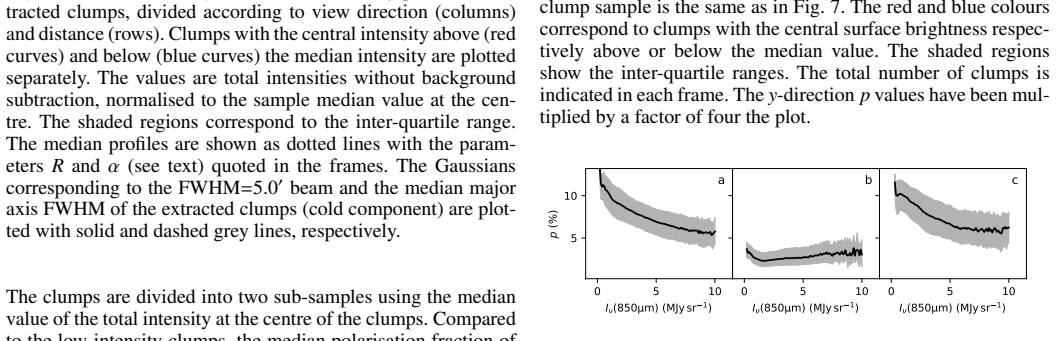
- [Appendix B] The gamma-angle reconstruction assumes a purely azimuthal Galactic magnetic field with a fixed 14 degree pitch angle (Vallee 2017), applied to clump distances and Galactic coordinates. Figure B.1c shows that the observed p contrast stays below unity even at gamma approximately 90 degrees, where the simulations predict an increase; this indicates that either the assumed field geometry, the distance estimates, or the sample selection is not adequately modelling the real sightlines. The conclusion that geometry alone cannot explain the PGCC drop depends on this gamma assignment, so the analysis should include a sensitivity test, for example alternative pitch angles or pitch-angle scatter, higher-latitude subsamples, or use of an observed three-dimensional field model.
- [Section 4.3 / Section 3.3.1] The two samples have strongly different column-density habitats: Section 4.3 estimates N(H)=8.3e21 cm^-2 for PGCC sightlines versus N(H)=3.8e21 cm^-2 for the default model, and Section 3.3.1 shows that longer lines of sight (models L2-L4) flatten the p profiles and reduce the centre-to-background contrast. The observed PGCC sample is therefore not directly comparable to the default synthetic one; before invoking RAT, the authors should quote the synthetic contrast for models with matched column density, distance, and selection (for example, L3-L4 or higher-column-density versions of the models) and show how much of the 0.25 residual remains after that matching.
- [Section 5 / Appendix B] The central conclusion in Section 5 ('The drop in p is also smaller in the simulations...') is based on a 'preliminary test' whose full analysis is deferred to an unpublished companion paper (Ristorcelli et al. 2019, in prep.). For the present paper to be self-contained and falsifiable, the PGCC contrast and its uncertainties need to be reproducible from the details given here, or the conclusion should be explicitly conditional on the companion analysis being published.
minor comments (5)
- [Section 2.2] The distance list 'from 100 pc to 10000 kpc' should read 'from 100 pc to 10000 pc' (or '10 kpc'), as the same paragraph later refers to d=10000 pc.
- [Section 2.2] The noise values are listed as 0.06, 0.01, 0.01, and 0.001 MJy/sr for 100, 350, 350, and 850 micron; the second 350 micron entry should presumably be 550 micron, matching the four wavelengths listed earlier.
- [Figure 7 and Figure 8 captions] The captions write fit parameters as 'R = 5.64, = 0.71', omitting the symbol alpha; please restore 'alpha =' for readability.
- [Figure 8 caption] The sentence 'The y-direction p values have been multiplied by a factor of four the plot' contains a typo and should read 'multiplied by a factor of four in the plot'.
- [Appendix B / Fig. B.1] The caption of Fig. B.1 does not state whether the plotted p values are debiased using Eq. (2) or are raw estimates; since the samples extend to low signal-to-noise, this should be stated explicitly.
Circularity Check
Simulation p-contrast is genuinely computed; the RAT conclusion rests on an unpublished self-cited PGCC value (0.60) rather than on a derivation in this paper.
-
self citation load bearing
[Section 4.4 (Discussion), p. 15; see also Appendix B and the reference list entry 'Ristorcelli et al. 2019, in prep.']
"For the x and z view directions, the average ratio of p values measured at the clump centre and in the background at 30′ distance is 0.85. For the PGCC, the corresponding factor is ∼ 0.60. This is thus significantly smaller, even though the PGCC sources should correspond to a mixture of different LOS vs. B-field configurations. This suggests that the polarised emission from dense clumps is reduced by additional factors, such as the RAT mechanism."
The load-bearing comparison is between the synthetic value 0.85 and the PGCC value ∼0.60. The 0.60 is not computed in this paper; it is attributed to Ristorcelli et al. (2019, in prep.), whose author list overlaps with the present paper, and Appendix B states that 'the full analysis of polarisation fraction variations will be presented in Ristorcelli et al. (2019)'. The paper's own Appendix B is only a 'preliminary test' and does not produce or verify the 0.60 number under the same 30-arcmin contrast definition. Since the gap between 0.85 and 0.60 is the sole quantitative support for the RAT hypothesis in the conclusions, the central inference depends on accepting an unverified self-cited work rather than on a reduction shown in this paper.
full rationale
The core simulation result is self-contained and not circular: the synthetic p drop (Δp∼1%, centre-to-background contrast 0.85) is obtained from MHD snapshots plus radiative transfer assuming constant grain alignment efficiency and p_max=20%. The contrast ratio is scale-free in p_max because p scales linearly, so no fitted parameter is renamed as a prediction, and the synthetic value is not adjusted to match the observations. The clump extraction pipeline mirrors the PGCC method, so similarities in size and temperature are partly definitional, but the paper states this explicitly and does not present those similarities as independent predictions. The only substantial circularity concern is the final RAT inference: the observed PGCC contrast, ∼0.60, is cited from an unpublished paper by one of the coauthors, and the paper's own Appendix B provides only a preliminary, differently defined contrast trend. The conclusion is worded cautiously ('suggests', 'may be affected'), and the simulation part would stand alone, but the decisive observational benchmark is not independently established in this paper. No equation reduces to its own input by construction; the issue is a load-bearing self-citation, hence a moderate score of 4 rather than a higher construction-level circularity score.
Assumptions & free parameters
free parameters (3)
- Maximum polarisation fraction p_max =
20%
- Dust spectral index beta =
2.0
- Dust opacity model (default and modified thresholds) =
Compiègne et al. (2011) diffuse medium model; M1/M5 thresholds n0=1000 and 5000 cm^-3
assumptions (5)
- domain assumption MHD simulation snapshots represent the density structure of Galactic cold clump environments
- domain assumption Constant grain alignment efficiency throughout the volume
- domain assumption The Compiègne et al. (2011) dust model is valid for the simulated clumps
- ad hoc to paper Galactic magnetic field is azimuthal with pitch angle 14 degrees for PGCC gamma estimates
- standard math Radiative transfer and source extraction methods are implemented correctly
Cite this review
Pith. "Pith review of Synthetic observations of dust emission and polarisation of Galactic cold clumps." pith.science (2026). https://pith.science/paper/PW2RJNZP
@misc{pith2026190803421,
  author       = {Pith},
  title        = {Pith review of: Synthetic observations of dust emission and polarisation of Galactic cold clumps},
  year         = {2026},
  howpublished = {\url{https://pith.science/paper/PW2RJNZP}},
  note         = {Machine review of arXiv:1908.03421}
}
abstract
The Planck Catalogue of Galactic Cold Clumps (PGCC) contains over 13000 sources detected based on their cold dust signature. They are believed to consist of a mixture of quiescent, pre-stellar, and already star-forming objects. We extracted PGCC-type objects from cloud simulations and examined their physical and polarisation properties. The comparison with the PGCC catalogue helps to characterise the PGCC sample and provides valuable tests for numerical simulations of interstellar medium. We used several MHD snapshots to define the density field of our models. Sub-millimetre images of the surface brightness and polarisation were obtained with radiative transfer calculations. We examined the statistics of synthetic cold clump catalogues and examined the variations of the clump polarisation fraction p. The clump sizes, aspect ratios, and temperatures in the synthetic catalogue are similar to the PGCC. The fluxes and column densities are smaller by a factor of a few. Rather than with an increased dust opacity, this could be explained by increasing the average column density of the models by a factor of two to three, close to N(H2)= 10^22 cm-2. When the line of sight is parallel to the mean magnetic field, the polarisation fraction tends to increase towards the clump centres, contrary to observations. When the field is perpendicular, the polarisation fraction tends to decrease towards the clumps, but the drop in $p$ is small (e.g. from p~8% to p~7%). Magnetic field geometry reduces the polarisation fraction in the simulated clumps by only \Delta p~1% on average. The larger drop seen towards the actual PGCC clumps suggests some loss of grain alignment in the dense medium, such as predicted by the radiative torque mechanism. The statistical study is not able to quantify dust opacity changes at the scale of the PGCC clumps.
Figures
Figures from the paper (14 more)
Reference graph
Works this paper leans on
-
[1]
2019, , 485, 2825
Alina , D., Ristorcelli , I., Montier , L., et al. 2019, , 485, 2825
2019
-
[2]
O., Franco , G
Alves , F. O., Franco , G. A. P., & Girart , J. M. 2008, , 486, L13
2008
-
[3]
O., Frau , P., Girart , J
Alves , F. O., Frau , P., Girart , J. M., et al. 2014, , 569, L1
2014
-
[4]
Beckwith , S. V. W., Sargent , A. I., Chini , R. S., & Guesten , R. 1990, , 99, 924
1990
-
[5]
2016, Experimental Astronomy, 42, 199
Bernard , J.-P., Ade , P., Andr \'e , Y., et al. 2016, Experimental Astronomy, 42, 199
2016
-
[6]
J., Chepurnov , A., Lazarian , A., & Kim , J
Bethell , T. J., Chepurnov , A., Lazarian , A., & Kim , J. 2007, , 663, 1055
2007
-
[7]
2016, , 588, A129
Brauer , R., Wolf , S., & Reissl , S. 2016, , 588, A129
2016
-
[8]
Chapman , N. L., Goldsmith , P. F., Pineda , J. L., et al. 2011, , 741, 21
work page 2011
Show all 87 references
-
[9]
K., & Li , Z.-Y
Chen , C.-Y., King , P. K., & Li , Z.-Y. 2016, , 829, 84
2016
-
[10]
& Lazarian , A
Cho , J. & Lazarian , A. 2005, , 631, 361
2005
-
[11]
2011, , 525, A103+
Compi \`e gne , M., Verstraete , L., Jones , A., et al. 2011, , 525, A103+
2011
-
[12]
2019, , 877, 88
Coud \'e , S., Bastien , P., Houde , M., et al. 2019, , 877, 88
2019
-
[13]
Cox , N. L. J., Arzoumanian , D., Andr \'e , P., et al. 2016, , 590, A110
2016
-
[14]
2017, , 606, A102
Feh \'e r , O., Juvela , M., Lunttila , T., et al. 2017, , 606, A102
2017
-
[15]
M., Ade , P
Fissel , L. M., Ade , P. A. R., Angil \'e , F. E., et al. 2016, , 824, 134
2016
-
[16]
A., Whittet , D
Gerakines , P. A., Whittet , D. C. B., & Lazarian , A. 1995, , 455, L171
1995
-
[17]
A., Jones , T
Goodman , A. A., Jones , T. J., Lada , E. A., & Myers , P. C. 1995, , 448, 748
1995
-
[18]
Heyer , M. H. & Terebey , S. 1998, , 502, 265
1998
-
[19]
& Lazarian , A
Hoang , T. & Lazarian , A. 2014, , 438, 680
2014
-
[20]
2019, , 622, A79
Juvela , M. 2019, , 622, A79
2019
-
[21]
2015 a , , 584, A94
Juvela , M., Demyk , K., Doi , Y., et al. 2015 a , , 584, A94
2015
-
[22]
2018 a , , 620, A26
Juvela , M., Guillet , V., Liu , T., et al. 2018 a , , 620, A26
2018
-
[23]
2018 b , , 612, A71
Juvela , M., He , J., Pattle , K., et al. 2018 b , , 612, A71
2018
-
[24]
2018 c , , 614, A83
Juvela , M., Malinen , J., Montillaud , J., et al. 2018 c , , 614, A83
2018
-
[25]
J., et al
Juvela , M., Ristorcelli , I., Marshall , D. J., et al. 2015 b , , 584, A93
2015
-
[26]
2012, , 541, A12
Juvela , M., Ristorcelli , I., Pagani , L., et al. 2012, , 541, A12
2012
-
[27]
2018, , 857, 100
Kandori , R., Tamura , M., Nagata , T., et al. 2018, , 857, 100
2018
-
[28]
Kennicutt , Jr., R. C. 1998, , 498, 541
1998
-
[29]
M., Tang , Y.-W., Ho , P
Koch , P. M., Tang , Y.-W., Ho , P. T. P., et al. 2014, , 797, 99
2014
-
[30]
A., & Myers , P
Lazarian , A., Goodman , A. A., & Myers , P. C. 1997, , 490, 273
1997
-
[31]
2018 a , , 234, 28
Liu , T., Kim , K.-T., Juvela , M., et al. 2018 a , , 234, 28
2018
-
[32]
2018 b , , 869, L5
Liu , T., Kim , K.-T., Liu , S.-Y., et al. 2018 b , , 869, L5
2018
-
[33]
S., Juvela , M., et al
Liu , T., Li , P. S., Juvela , M., et al. 2018 c , , 859, 151
2018
-
[34]
2016, , 222, 7
Liu , T., Zhang , Q., Kim , K.-T., et al. 2016, , 222, 7
2016
-
[35]
C., Lunttila , T., & Padoan , P
Malinen , J., Juvela , M., Collins , D. C., Lunttila , T., & Padoan , P. 2011, , 530, A101+
2011
-
[36]
2016, , 460, 1934
Malinen , J., Montier , L., Montillaud , J., et al. 2016, , 460, 1934
2016
-
[37]
P., et al
Mangilli , A., Aumont , J., Bernard , J. P., et al. 2019, arXiv e-prints, arXiv:1901.06196
2019 arXiv
-
[38]
G., Roy , A., Bontemps , S., et al
Martin , P. G., Roy , A., Bontemps , S., et al. 2012, , 751, 28
2012
-
[39]
S., Mezger , P
Mathis , J. S., Mezger , P. G., & Panagia , N. 1983, , 128, 212
1983
-
[40]
G., Ade , P
Matthews , T. G., Ade , P. A. R., Angil \'e , F. E., et al. 2014, , 784, 116
2014
-
[41]
2013, , 209, 37
Meng , F., Wu , Y., & Liu , T. 2013, , 209, 37
2013
-
[42]
& Lagache , G
Miville-Desch \^e nes , M. & Lagache , G. 2005, ApJS, 157, 302
2005
-
[43]
A., Pelkonen , V.-M., Juvela , M., Ristorcelli , I., & Marshall , D
Montier , L. A., Pelkonen , V.-M., Juvela , M., Ristorcelli , I., & Marshall , D. J. 2010, , 522, A83+
2010
-
[44]
2015, , 584, A92
Montillaud , J., Juvela , M., Rivera-Ingraham , A., et al. 2015, , 584, A92
2015
-
[45]
Neha , S., Maheswar , G., Soam , A., & Lee , C. W. 2018, , 476, 4442
2018
-
[46]
J., van Duinen , R., et al
Neugebauer , G., Habing , H. J., van Duinen , R., et al. 1984, ApJ, 278, L1
1984
-
[47]
& Henning , T
Ossenkopf , V. & Henning , T. 1994, A&A, 291, 943
1994
-
[48]
2017, , 840, 48
Padoan , P., Haugb lle , T., Nordlund , ., & Frimann , S. 2017, , 840, 48
2017
-
[49]
2016 a , , 826, 140
Padoan , P., Juvela , M., Pan , L., Haugb lle , T., & Nordlund , . 2016 a , , 826, 140
2016
-
[50]
2016 b , , 822, 11
Padoan , P., Pan , L., Haugb lle , T., & Nordlund , . 2016 b , , 822, 11
2016
-
[51]
2015, , 577, A69
Parikka , A., Juvela , M., Pelkonen , V.-M., Malinen , J., & Harju , J. 2015, , 577, A69
2015
-
[52]
2017, , 846, 122
Pattle , K., Ward-Thompson , D., Berry , D., et al. 2017, , 846, 122
2017
-
[53]
M., Juvela , M., & Padoan , P
Pelkonen , V. M., Juvela , M., & Padoan , P. 2007, , 461, 551
2007
-
[54]
2009, , 502, 833
Pelkonen , V.-M., Juvela , M., & Padoan , P. 2009, , 502, 833
2009
-
[55]
& Magalh \ a es , A
Pereyra , A. & Magalh \ a es , A. M. 2004, , 603, 584
2004
-
[56]
Planck Collaboration , Abergel , A., Ade , P. A. R., et al. 2014, , 571, A11
2014
-
[57]
Planck Collaboration , Abergel , A., Ade , P. A. R., et al. 2011 a , , 536, A25
2011
-
[58]
Planck Collaboration , Adam , R., Ade , P. A. R., et al. 2016 a , , 594, A10
2016
-
[59]
Planck Collaboration , Ade , P. A. R., Aghanim , N., et al. 2015 a , , 576, A105
2015
-
[60]
Planck Collaboration , Ade , P. A. R., Aghanim , N., et al. 2015 b , , 576, A104
2015
-
[61]
Planck Collaboration , Ade , P. A. R., Aghanim , N., et al. 2016 b , , 586, A136
2016
-
[62]
Planck Collaboration , Ade , P. A. R., Aghanim , N., et al. 2011 b , , 536, A22
2011
-
[63]
2011, , 536, A23
Planck Collaboration 2011W Planck Collaboration XXIII . 2011, , 536, A23
2011
-
[64]
2016, , 594, A1
Planck Collaboration 2015A Planck Collaboration I . 2016, , 594, A1
2016
-
[65]
2016, , 594, A28
Planck Collaboration 2015ZC Planck Collaboration XXVIII . 2016, , 594, A28
2016
-
[66]
2018, A&A submitted, arXiv:1807.06212
Planck Collaboration 2018L Planck Collaboration XII . 2018, A&A submitted, arXiv:1807.06212
2018 arXiv
-
[67]
Planck Collaboration IntS Planck Collaboration Int. XIX . 2015, , 576, A104
2015
-
[68]
Planck Collaboration IntS Planck Collaboration Int. XX . 2015, , 576, A105
2015
-
[69]
2014, , 439, 4048
Plaszczynski , S., Montier , L., Levrier , F., & Tristram , M. 2014, , 439, 4048
2014
-
[70]
Reissl , S., Seifried , D., Wolf , S., Banerjee , R., & Klessen , R. S. 2017, , 603, A71
2017
-
[71]
M., Brauer , R., et al
Reissl , S., Stutz , A. M., Brauer , R., et al. 2018, ArXiv e-prints
2018
-
[72]
Ristorcelli et al. , I. 2019, in prep
2019
-
[73]
2016, , 591, A90
Rivera-Ingraham , A., Ristorcelli , I., Juvela , M., et al. 2016, , 591, A90
2016
-
[74]
G., Polychroni , D., et al
Roy , A., Martin , P. G., Polychroni , D., et al. 2013, , 763, 55
2013
-
[75]
Seifried , D., Walch , S., Reissl , S., & Ib \'a \ n ez-Mej \' a , J. C. 2019, , 482, 2697
2019
-
[76]
D., Alves , F., Boulanger , F., et al
Soler , J. D., Alves , F., Boulanger , F., et al. 2016, , 596, A93
2016
-
[77]
2003, , 398, 551
Stepnik , B., Abergel , A., Bernard , J., et al. 2003, , 398, 551
2003
-
[78]
2017, , 228, 12
Tatematsu , K., Liu , T., Ohashi , S., et al. 2017, , 228, 12
2017
-
[79]
2002, , 385, 337
Teyssier , R. 2002, , 385, 337
2002
-
[80]
Vall \'e e , J. P. 2017, The Astronomical Review, 13, 113
2017
-
[81]
J., Strom , S
Vrba , F. J., Strom , S. E., & Strom , K. M. 1976, , 81, 958
1976
-
[82]
M., Crutcher , R
Ward-Thompson , D., Kirk , J. M., Crutcher , R. M., et al. 2000, , 537, L135
2000
-
[83]
2017, , 842, 66
Ward-Thompson , D., Pattle , K., Bastien , P., et al. 2017, , 842, 66
2017
-
[84]
Whittet , D. C. B., Gerakines , P. A., Hough , J. H., & Shenoy , S. S. 2001, , 547, 872
2001
-
[85]
2012, , 756, 76
Wu , Y., Liu , T., Meng , F., et al. 2012, , 756, 76
2012
-
[86]
2018, , 236, 49
Zhang , C.-P., Liu , T., Yuan , J., et al. 2018, , 236, 49
2018
-
[87]
2016, , 224, 43
Zhang , T., Wu , Y., Liu , T., & Meng , F. 2016, , 224, 43
2016
Reviewed August 14, 2026 · model on record in the stance chip above.
Discussion (0). Continue with ORCID to comment.