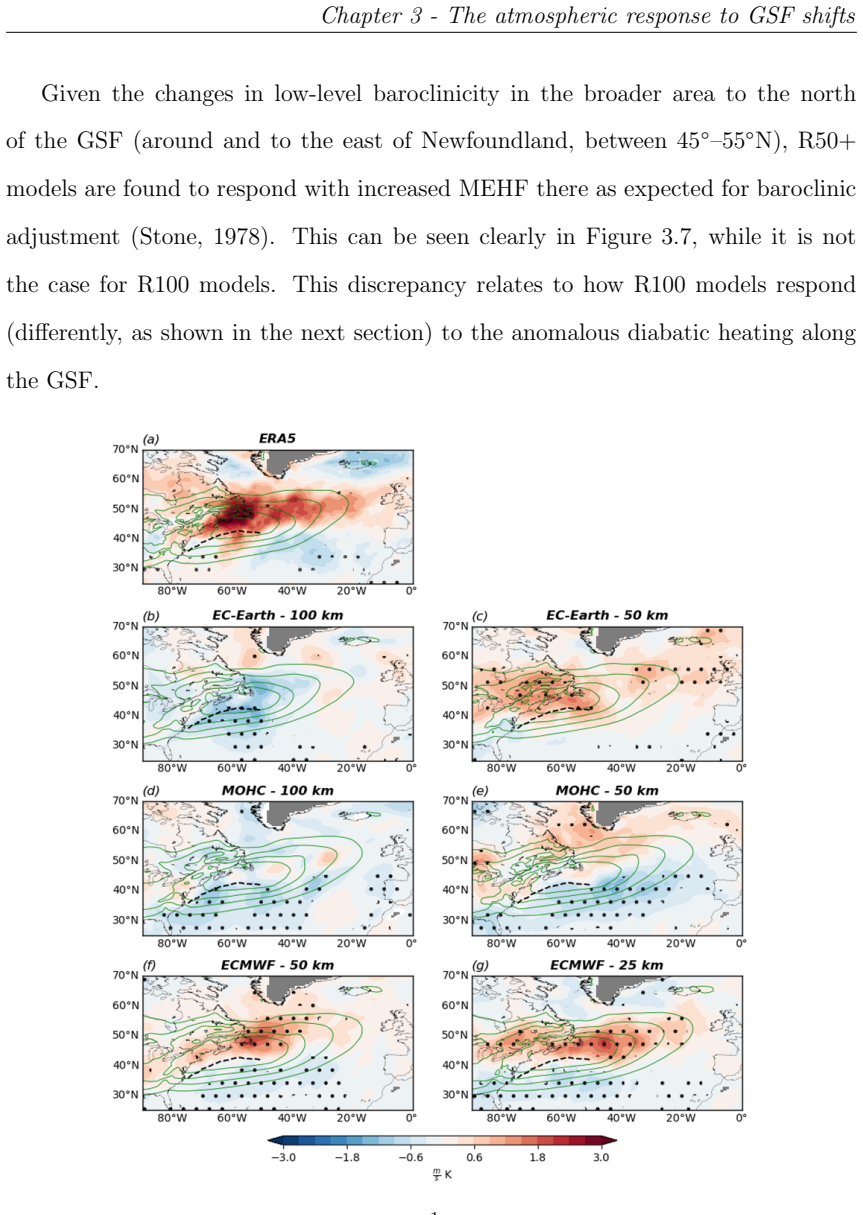
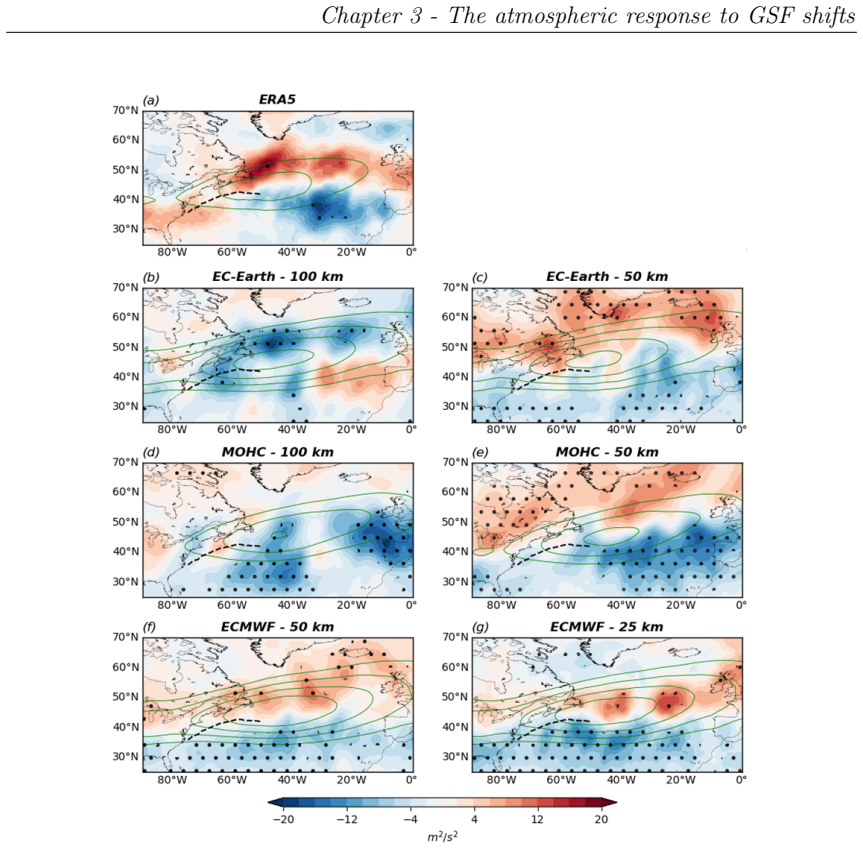
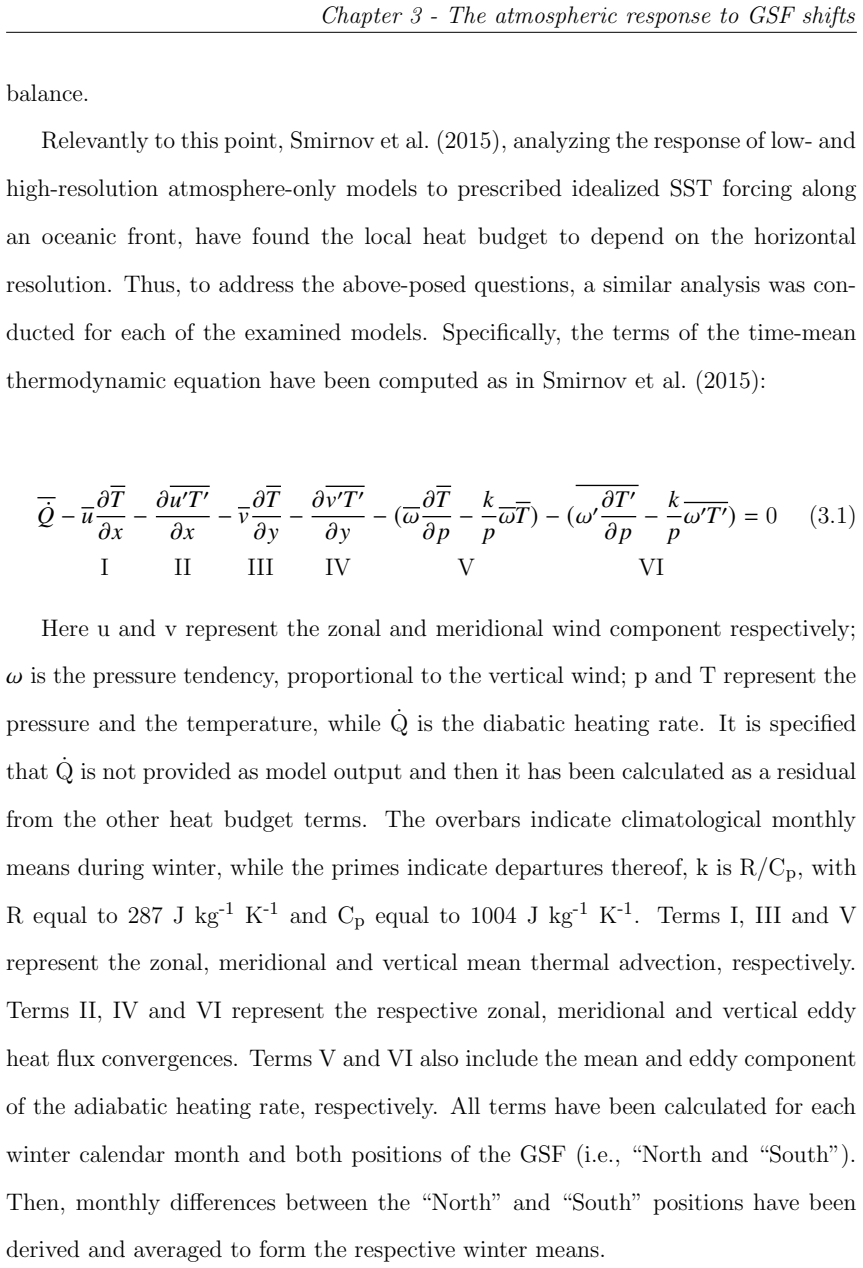
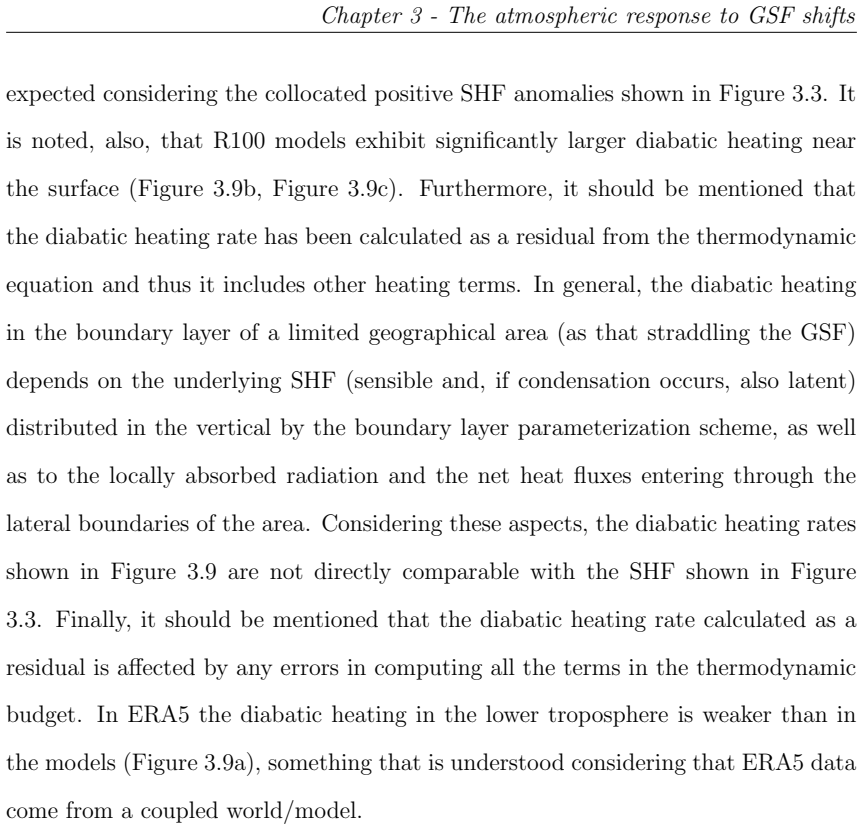
Ocean-atmosphere interaction at the Gulf Stream sea surface temperature front: variability and impacts on midlatitude atmospheric circulation
Pith reviewed 2026-06-29 02:19 UTC · model grok-4.3
The pith
Atmospheric response to Gulf Stream front shifts appears only in models finer than 50 km and shows non-stationary decadal covariance with the NAO.
A machine-rendered reading of the paper's core claim, the machinery that carries it, and where it could break.
Core claim
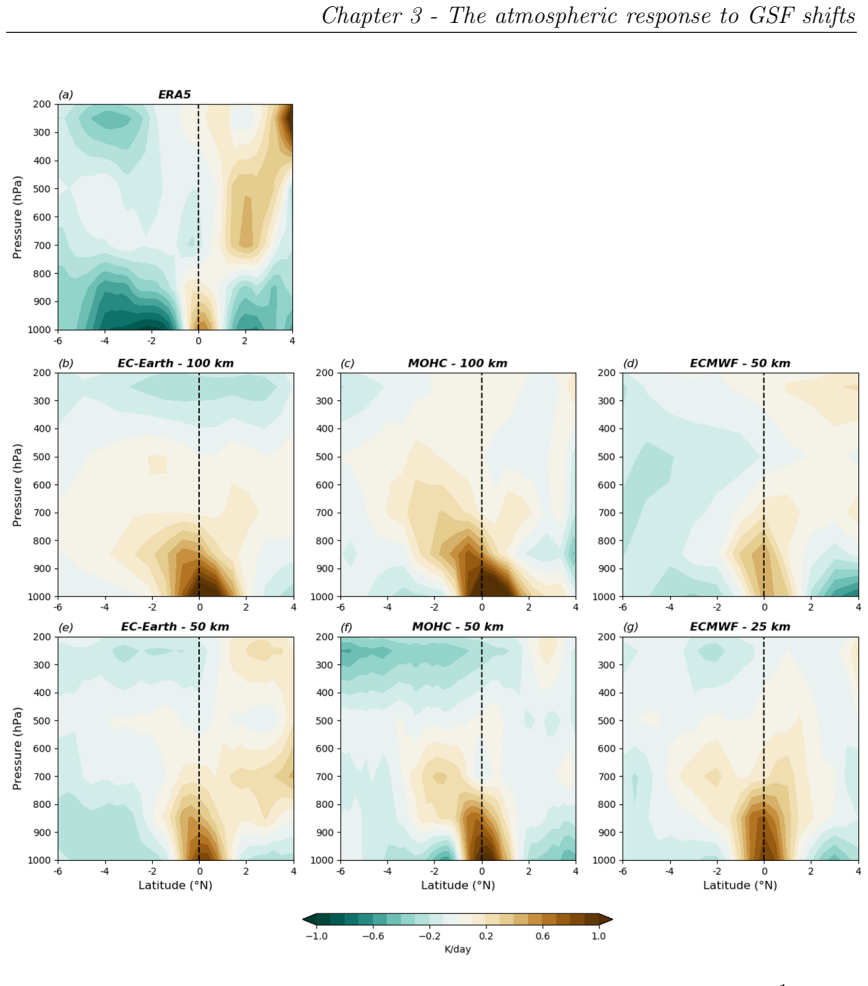
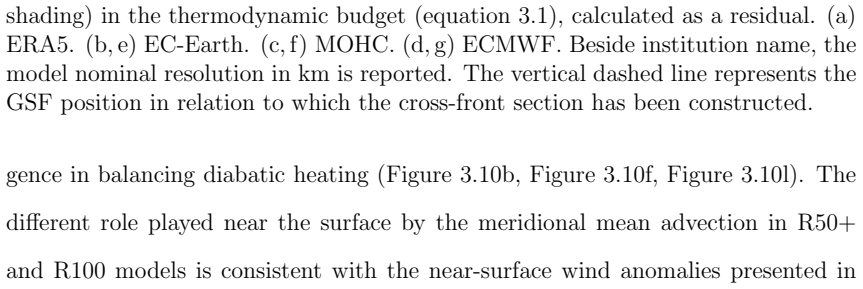
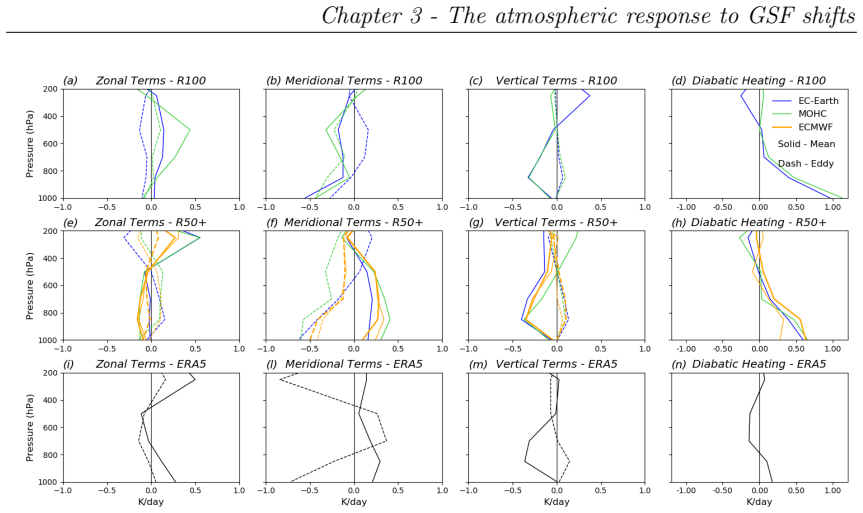
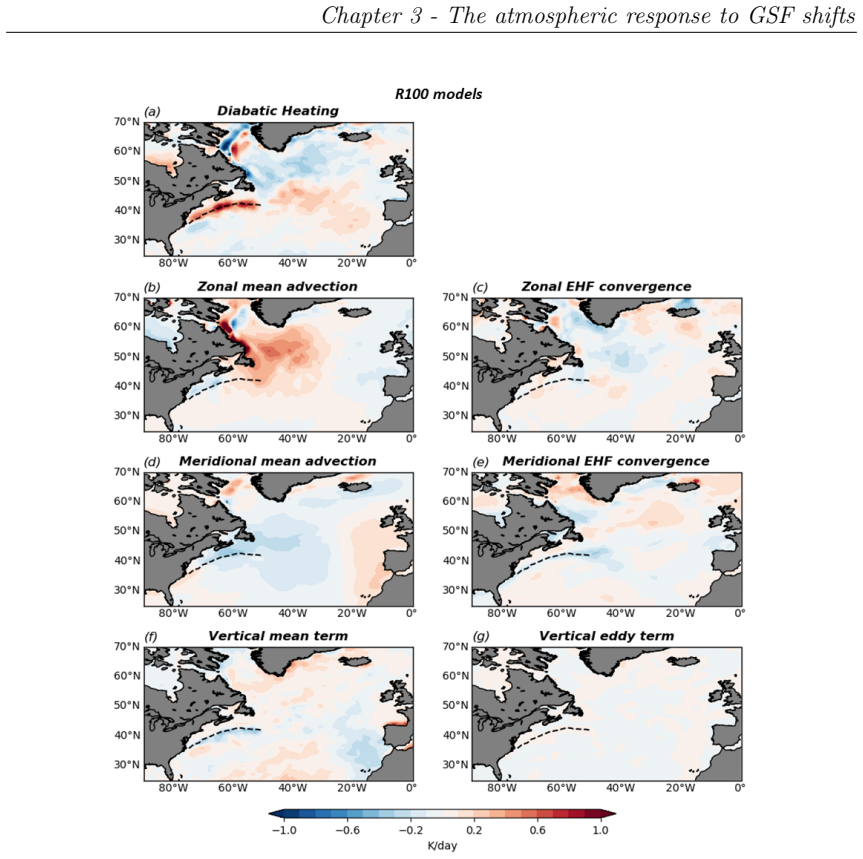
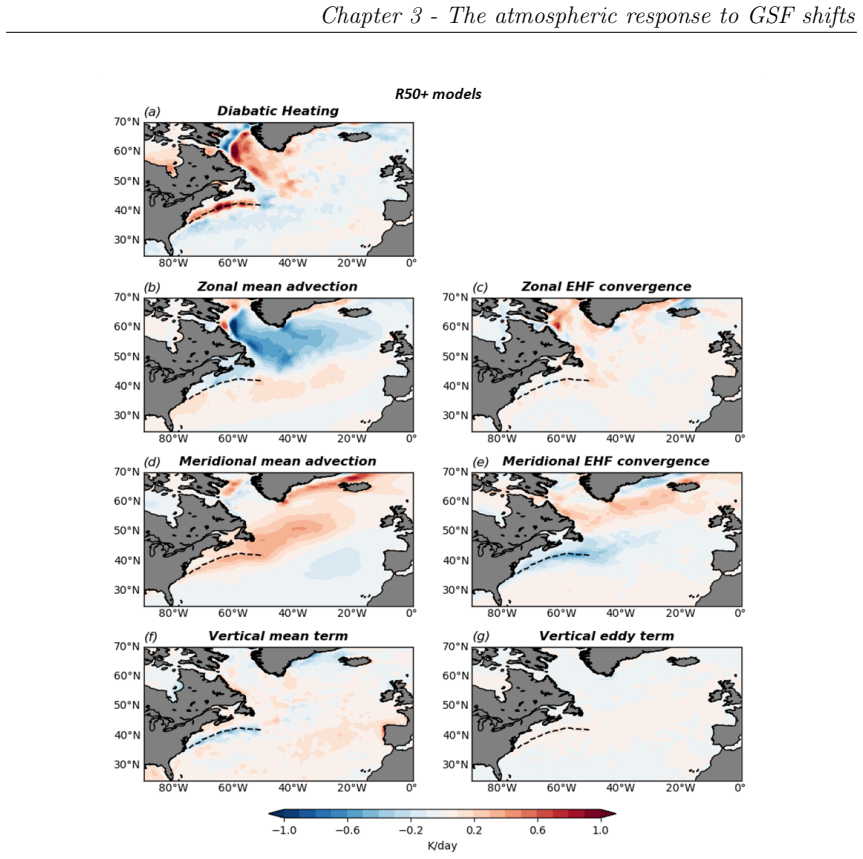
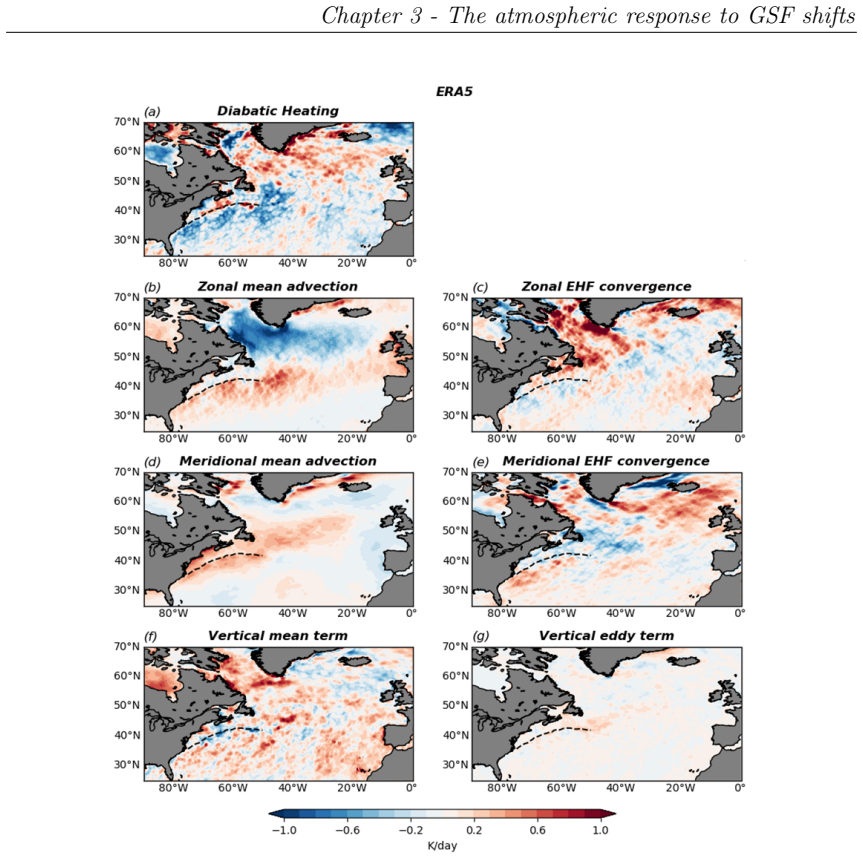
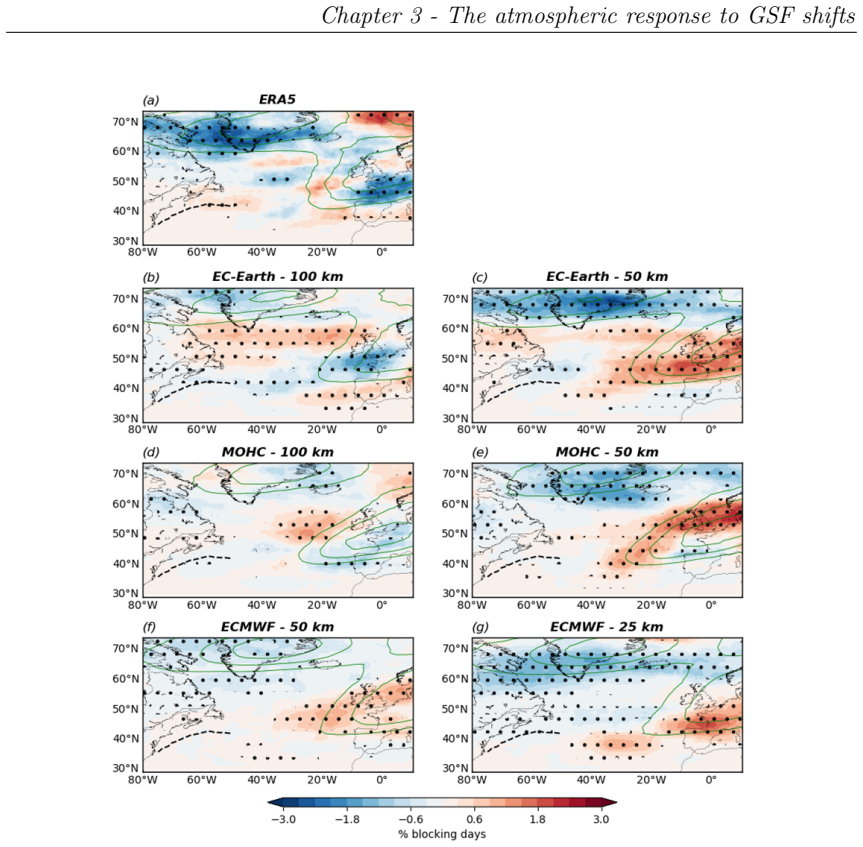
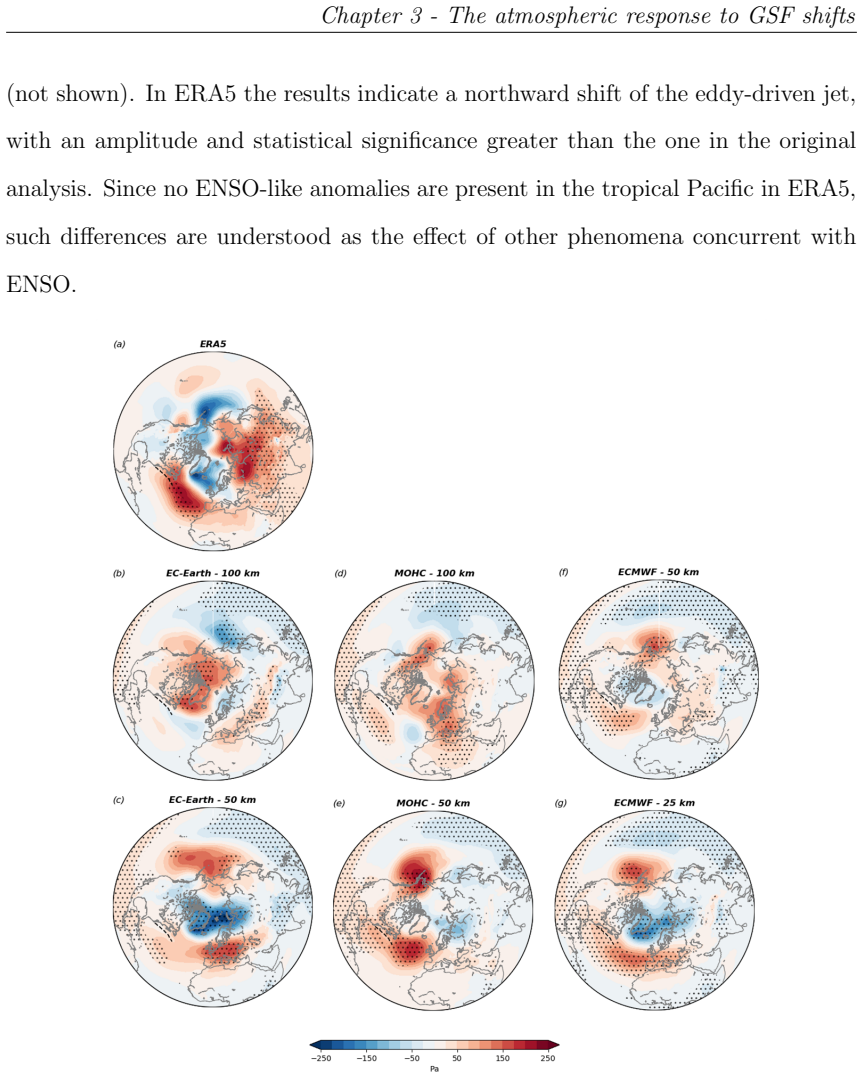
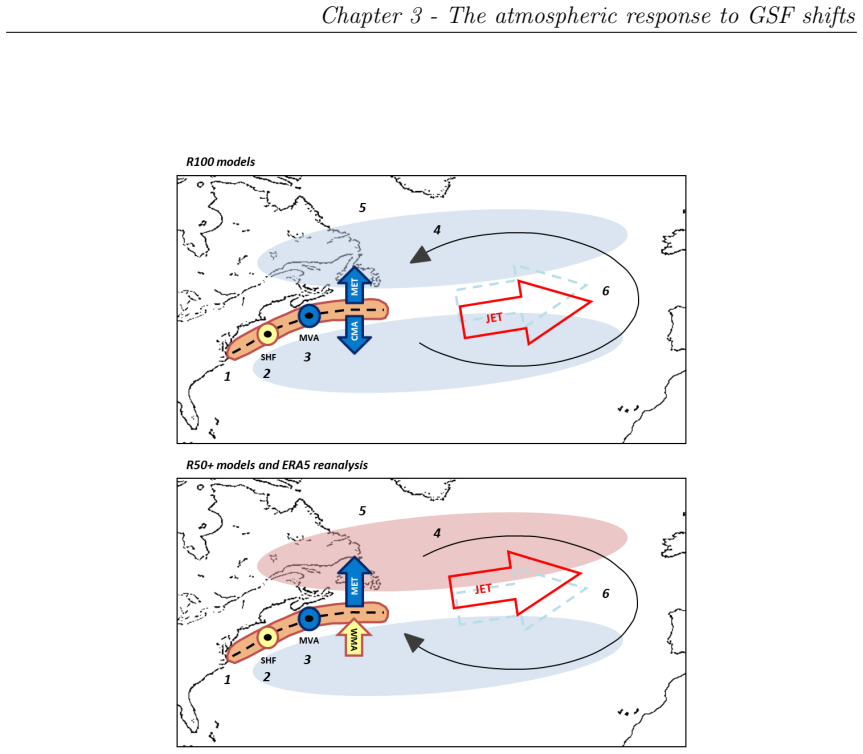
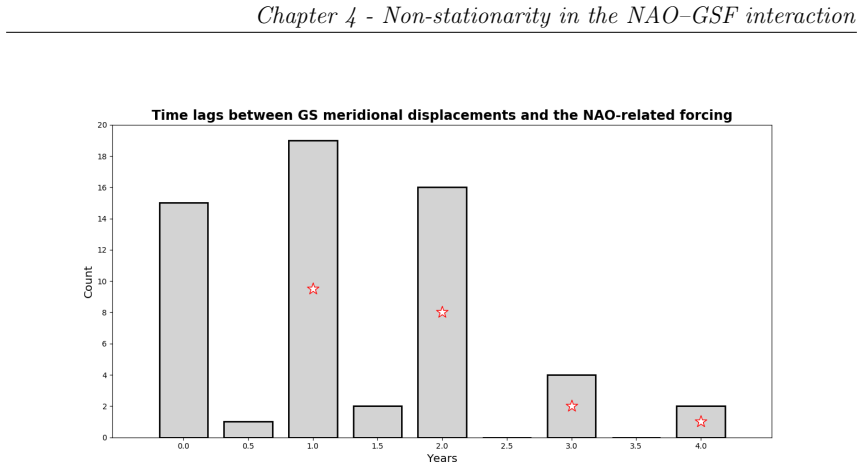
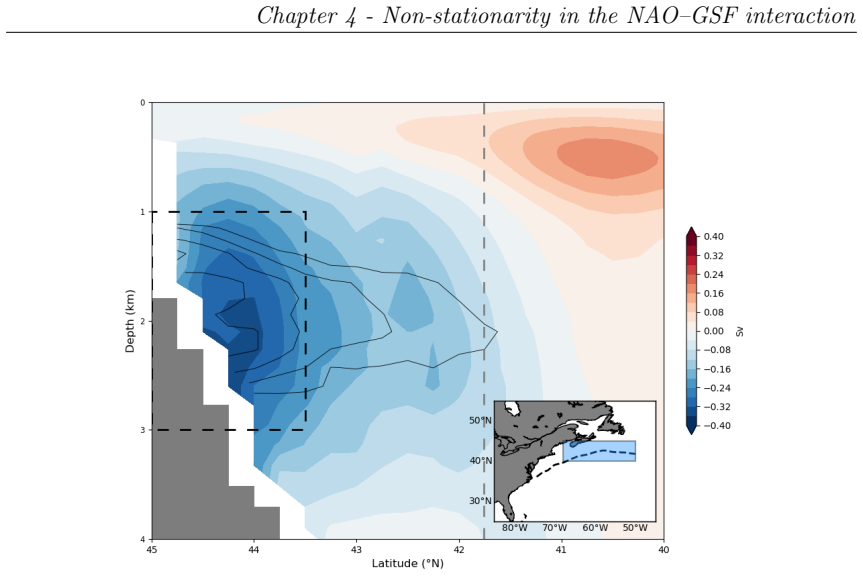
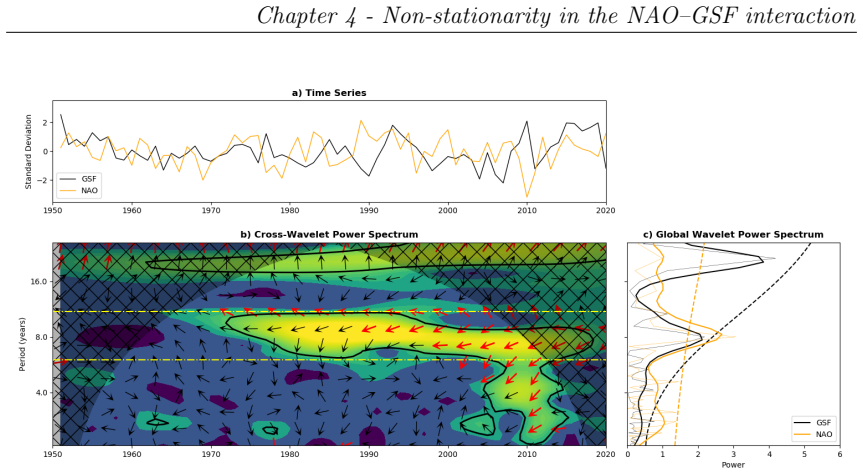
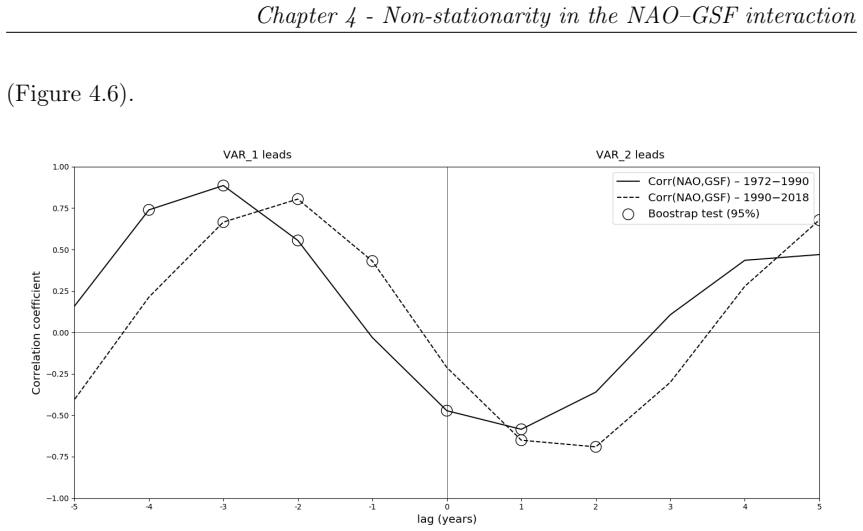
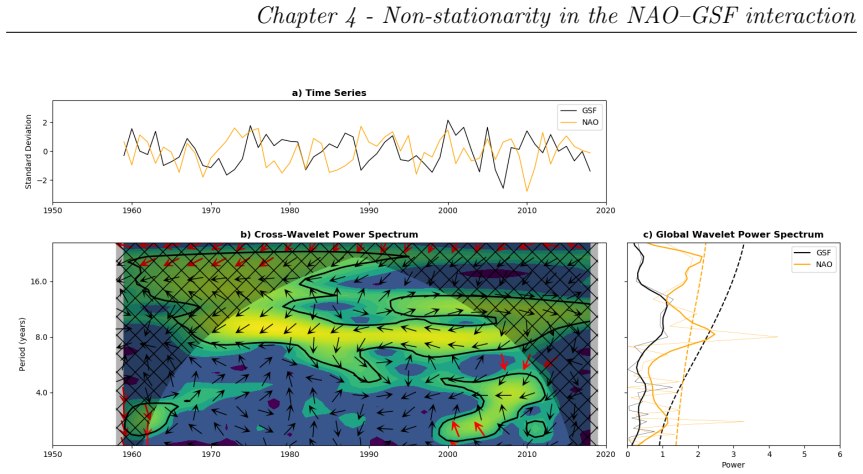
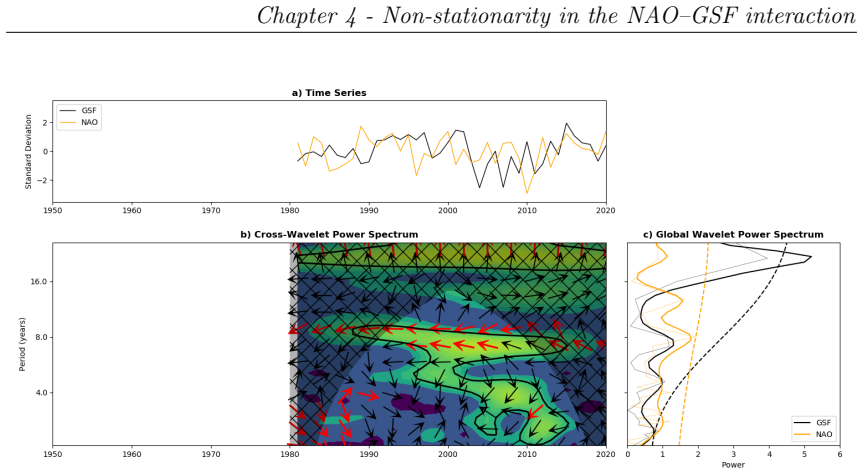
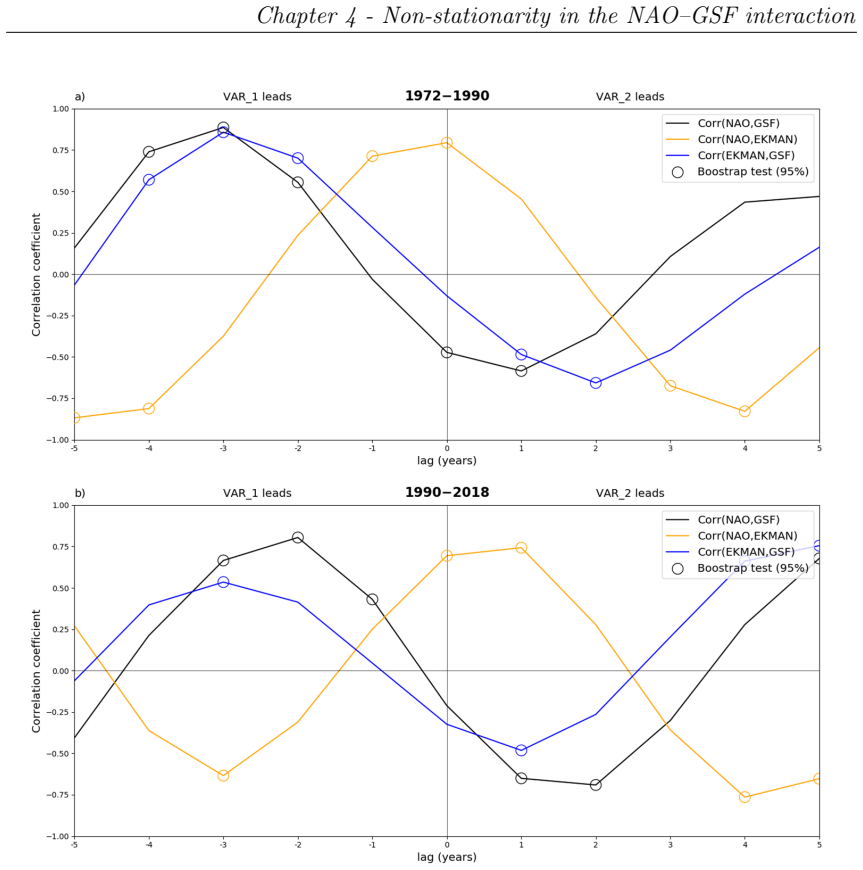
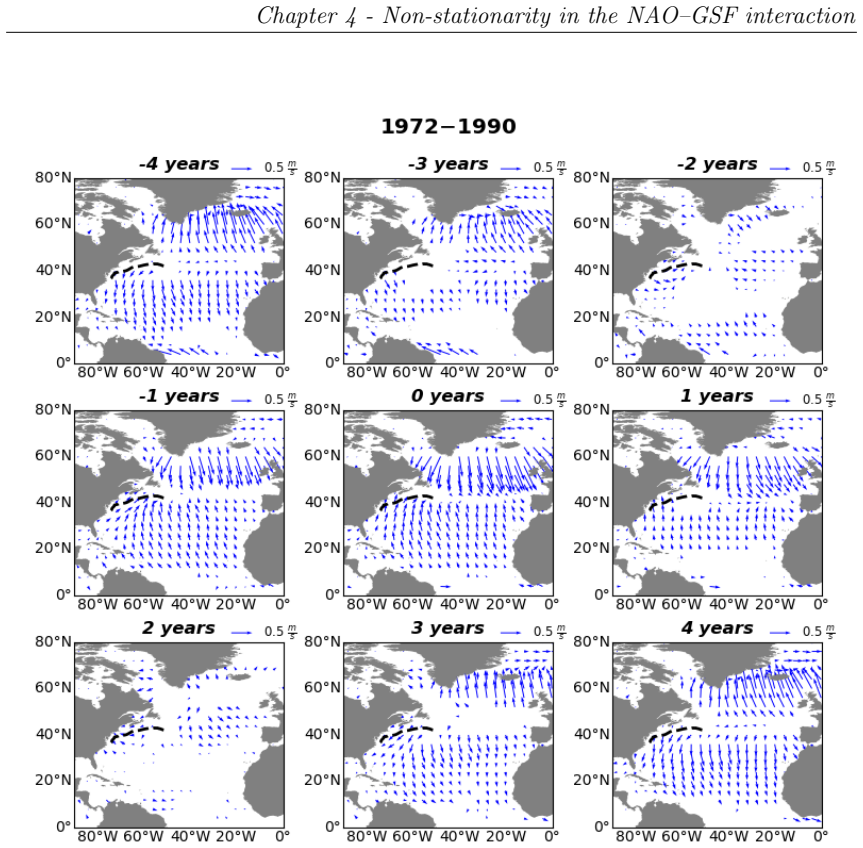
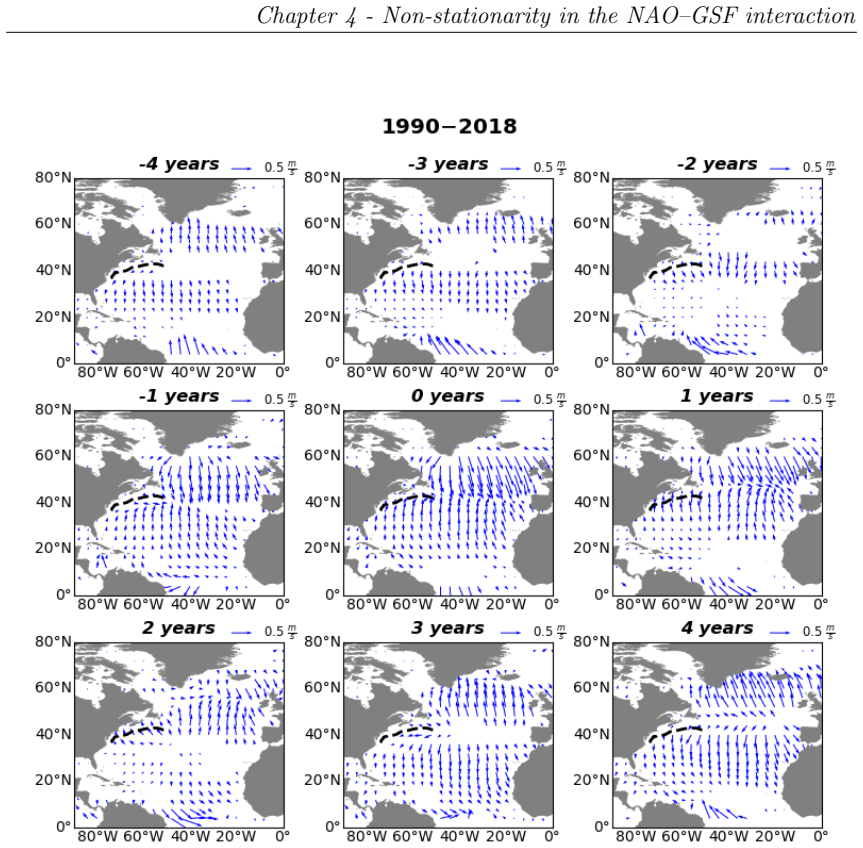
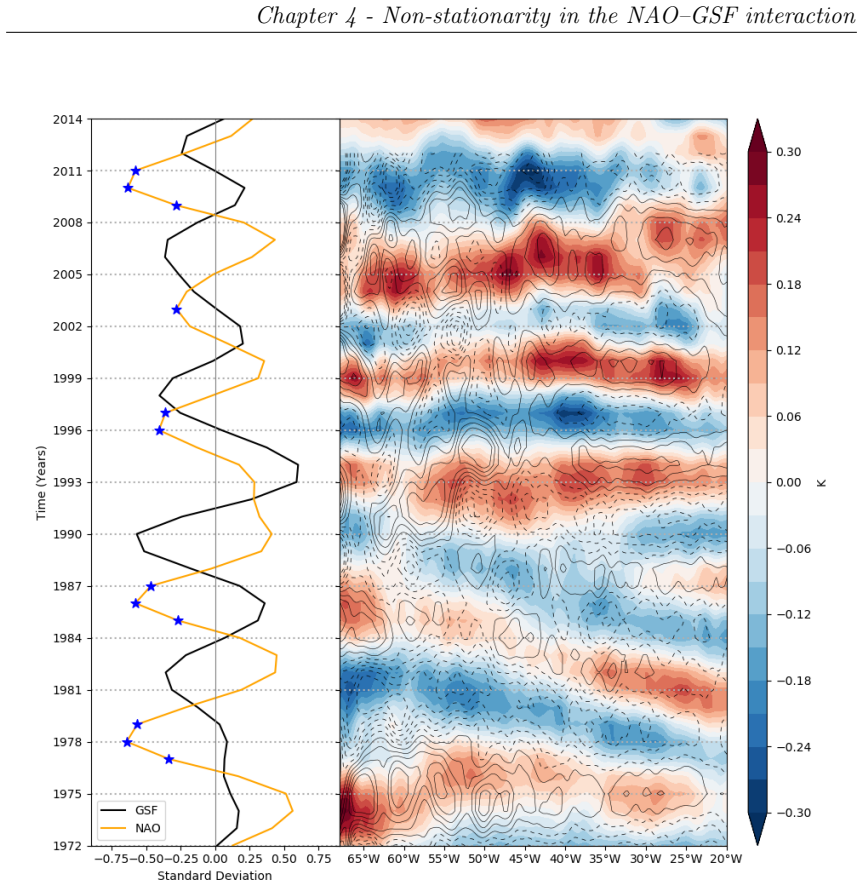
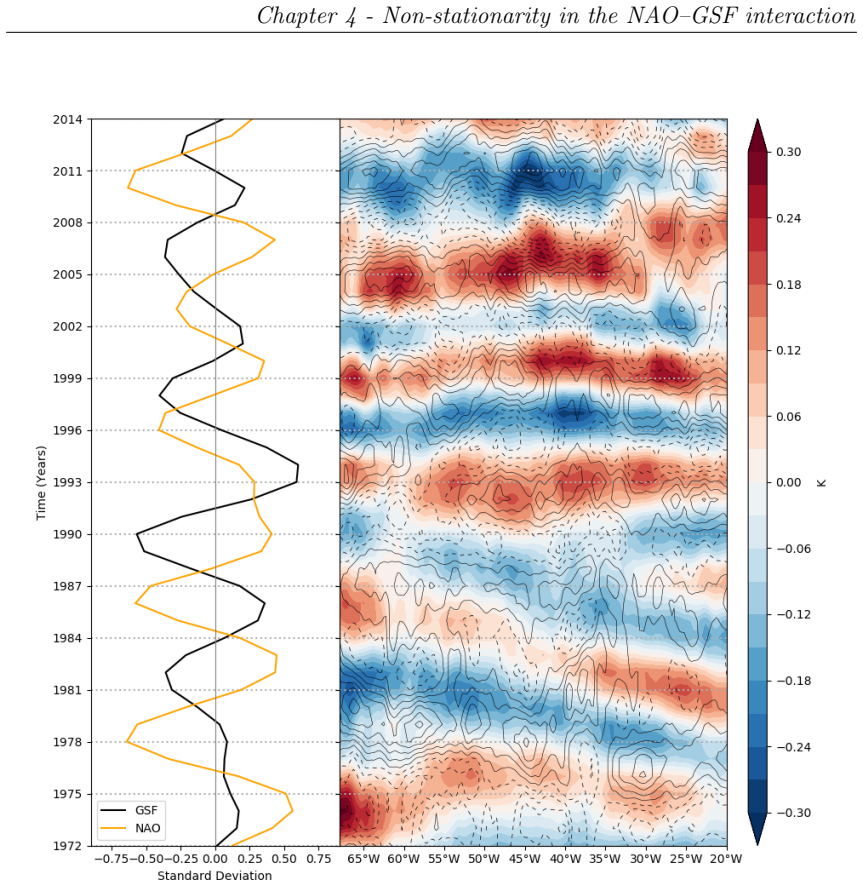
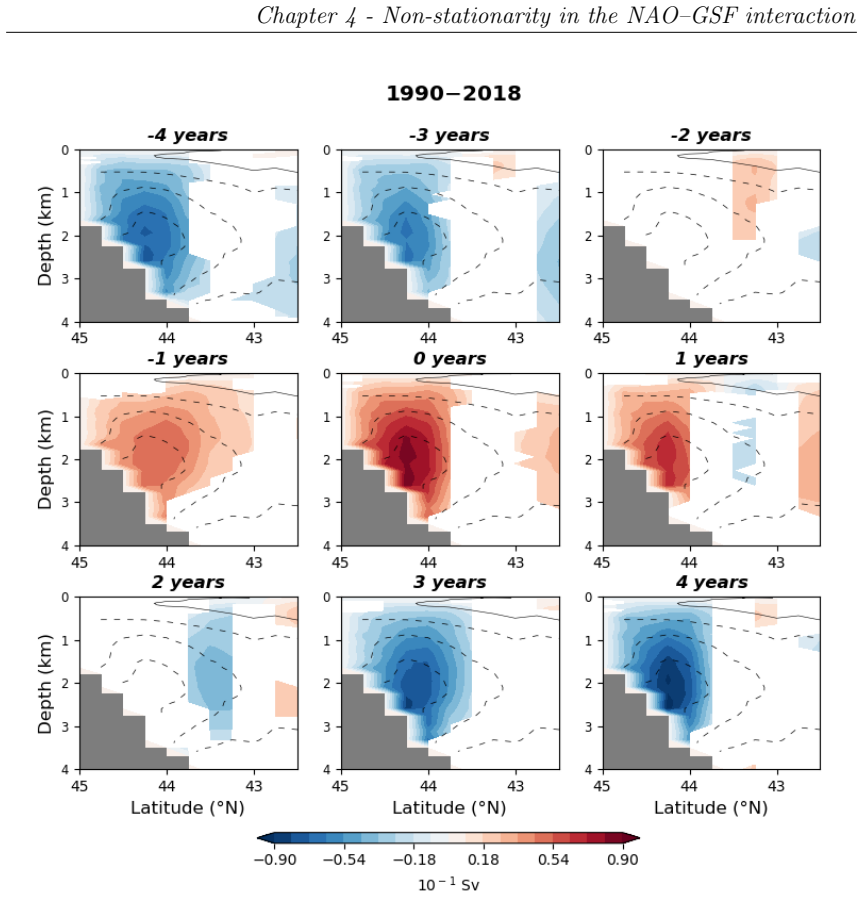
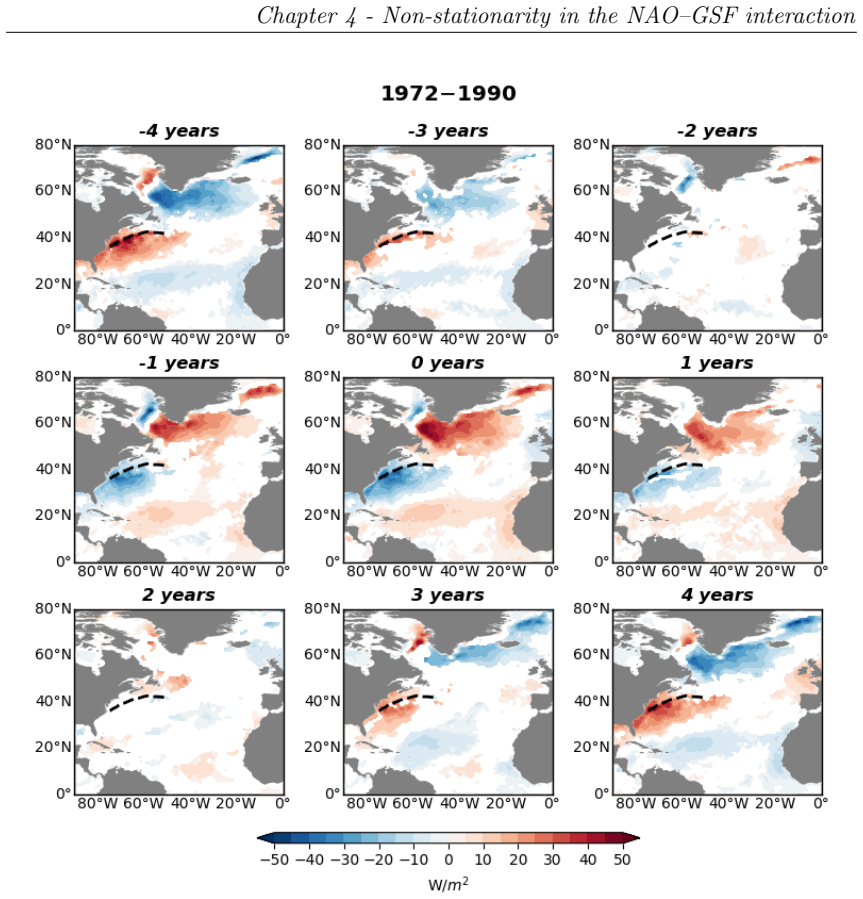
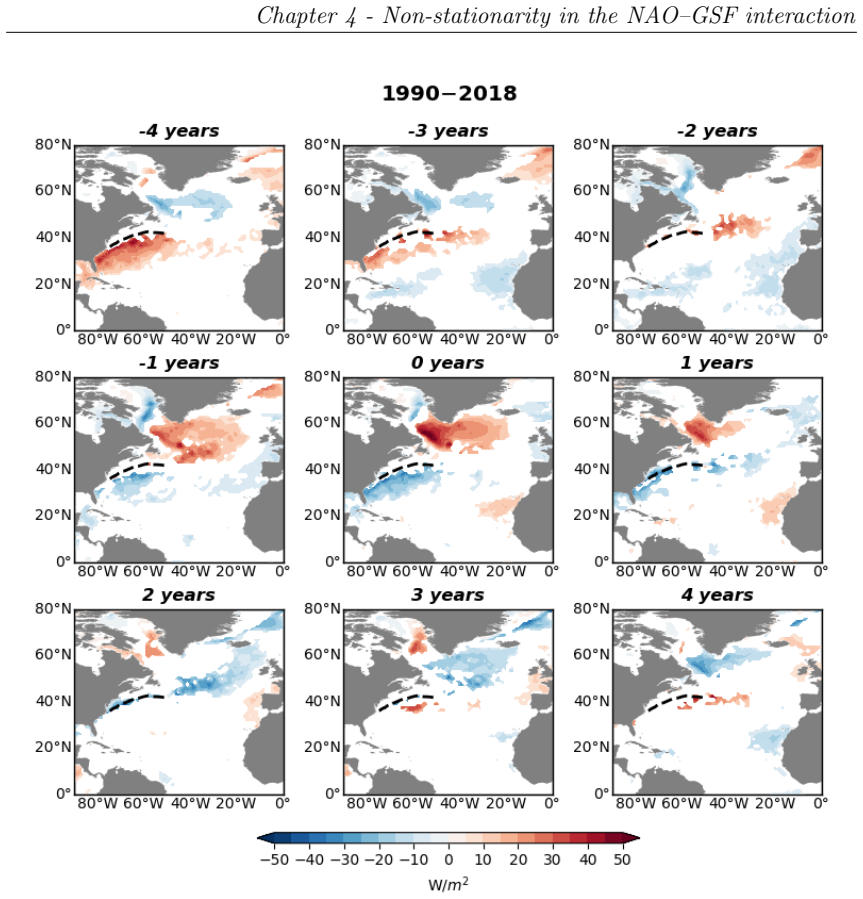
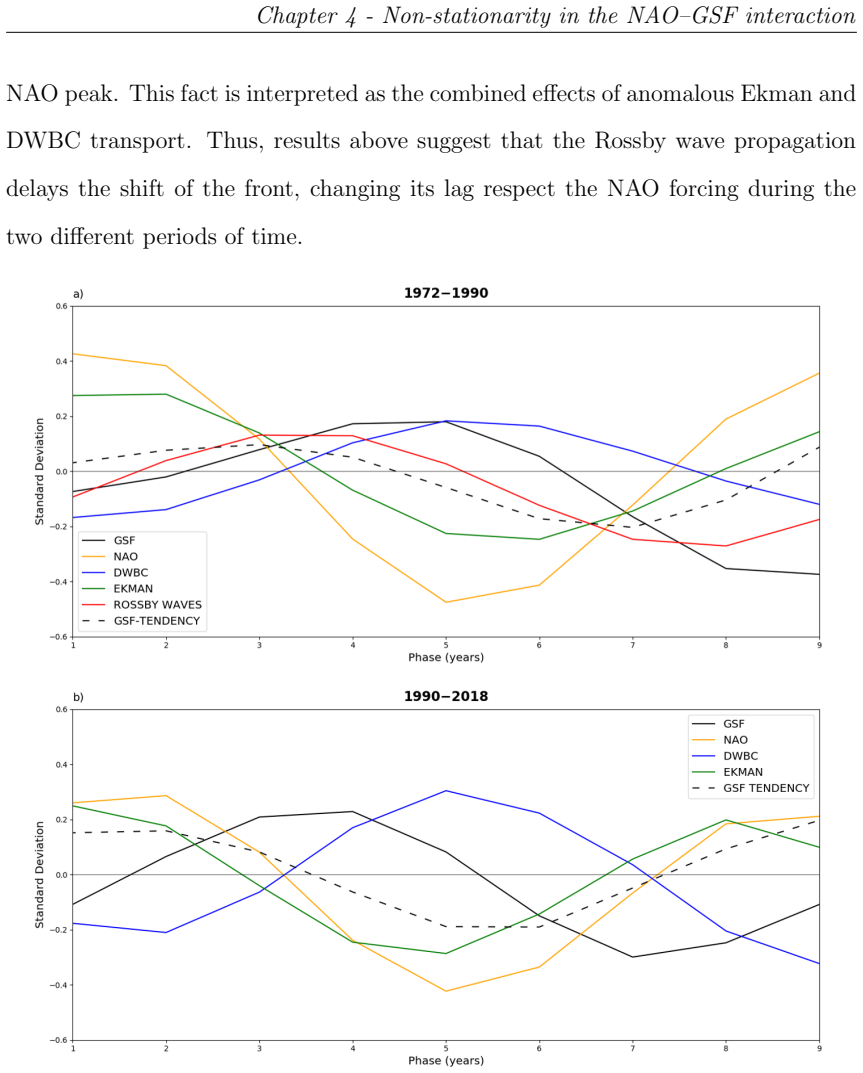
The central claim is that the atmospheric response to interannual meridional shifts of the Gulf Stream SST front is strongly resolution-dependent, reproducing observed anomalies only in simulations finer than 50 km, with local diabatic heating balanced by vertical motion and transient eddy transport, and large-scale homo-directional shifts of the eddy-driven jet and storm track mediated by low-level baroclinicity changes. The NAO and front exhibit decadal covariance exclusively in the 1972-2018 interval, with the NAO leading the front by three years in 1972-1990 and two years in 1990-2018, explained by the fast wind-driven oceanic response, the lagged deep oceanic response, and Rossby-wave p
What carries the argument
Resolution-dependent response to GSF meridional shifts together with the non-stationary NAO-GSF lead-lag relationship driven by wind-driven circulation, deep circulation, and Rossby waves.
If this is right
- Atmosphere-only models coarser than 50 km systematically under-represent the response of the jet and storm track to GSF variability.
- GSF shifts produce same-direction displacements of the North Atlantic eddy-driven jet and storm track via altered low-level baroclinicity.
- The NAO forces GSF shifts through a combination of rapid wind-driven ocean adjustment and slower deep-ocean adjustment, producing a 2-3 year lag.
- Rossby-wave propagation contributes to the NAO-GSF lag only in the earlier sub-period, implying a change in the dominant forcing pathway after 1990.
Where Pith is reading between the lines
- Climate models that remain coarser than 50 km will continue to miss a key pathway linking western-boundary-current variability to mid-latitude circulation.
- The reported non-stationarity raises the possibility that background-state changes alter the relative roles of wind-driven versus wave-mediated ocean responses over time.
- If the resolution threshold holds, then any future assessment of Gulf Stream influence on European climate will require ensembles that resolve fronts below 50 km.
Load-bearing premise
The chosen time intervals reflect genuine non-stationarity rather than post-hoc selection, and the reanalysis products accurately capture the true lead-lag relationships and mechanism balances without major observational or processing artifacts.
What would settle it
Performing atmosphere-only simulations at 25 km or finer resolution and checking whether the match to observed anomalies strengthens, weakens, or saturates, or testing whether NAO-GSF covariance and the reported lags appear in any interval outside 1972-2018.
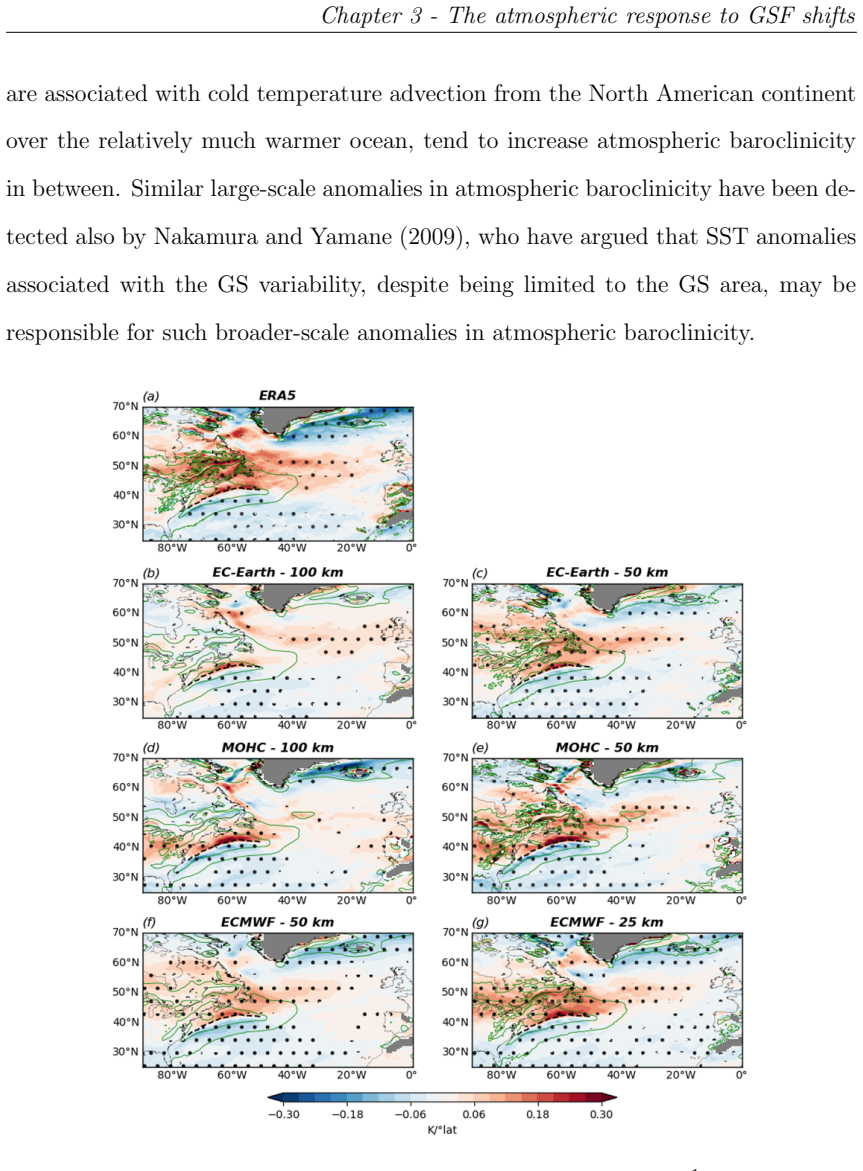
Figures
read the original abstract
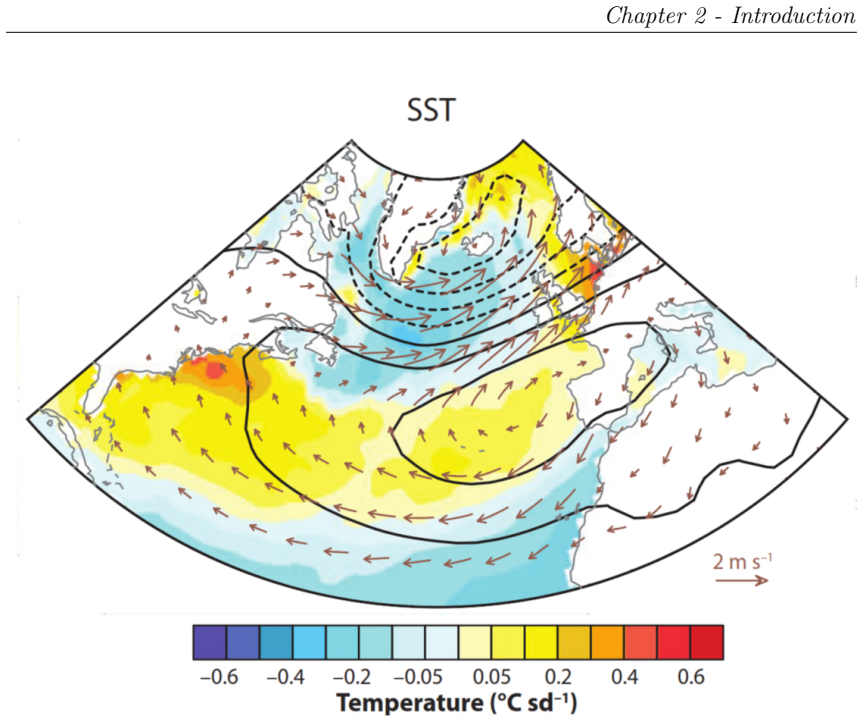
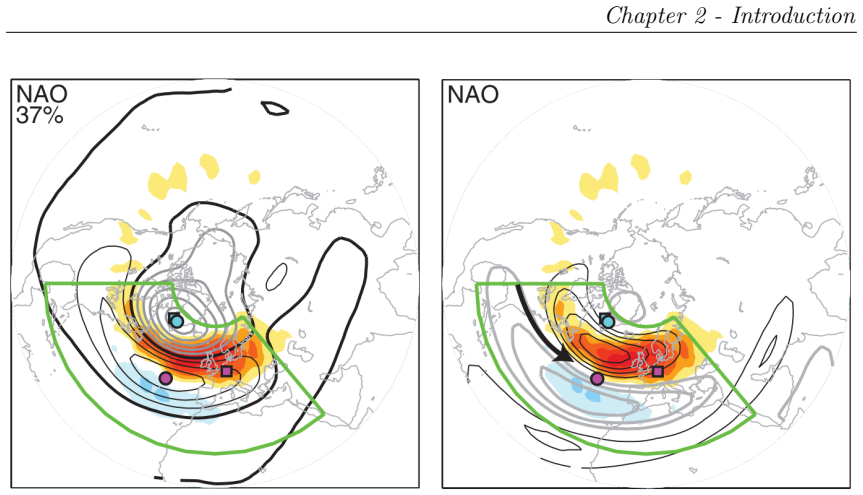
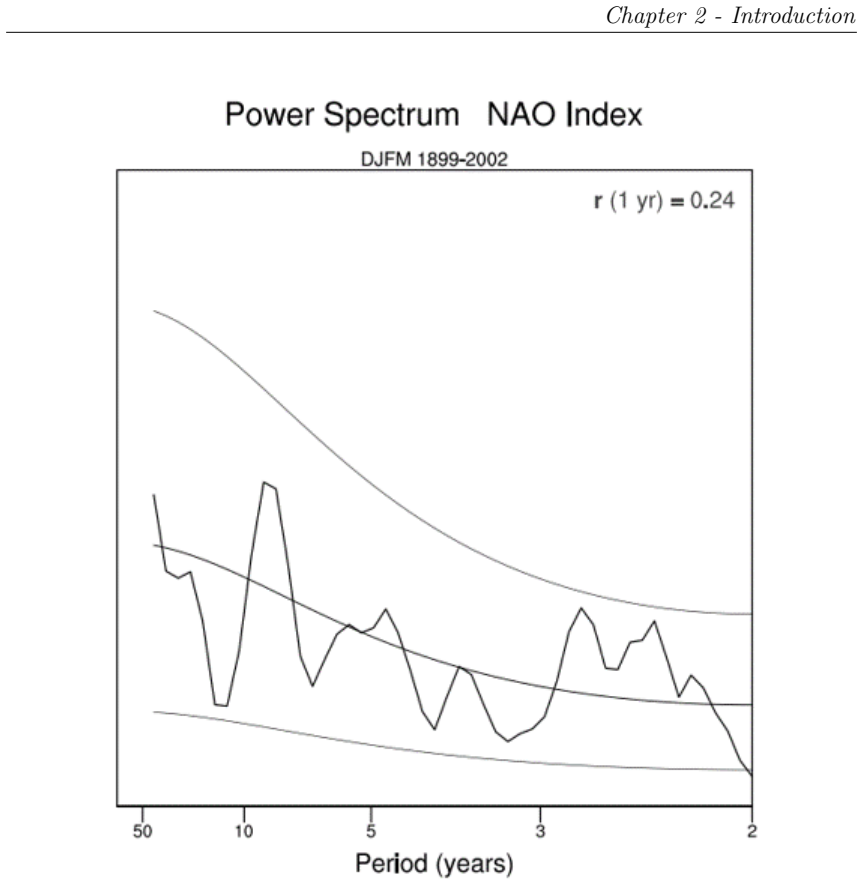
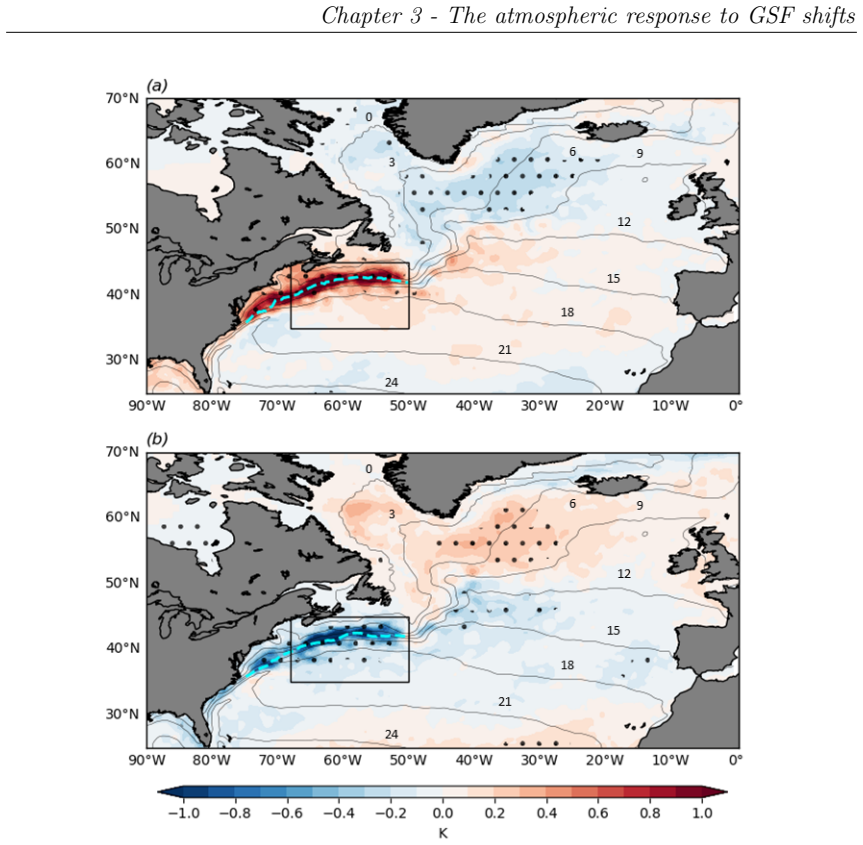
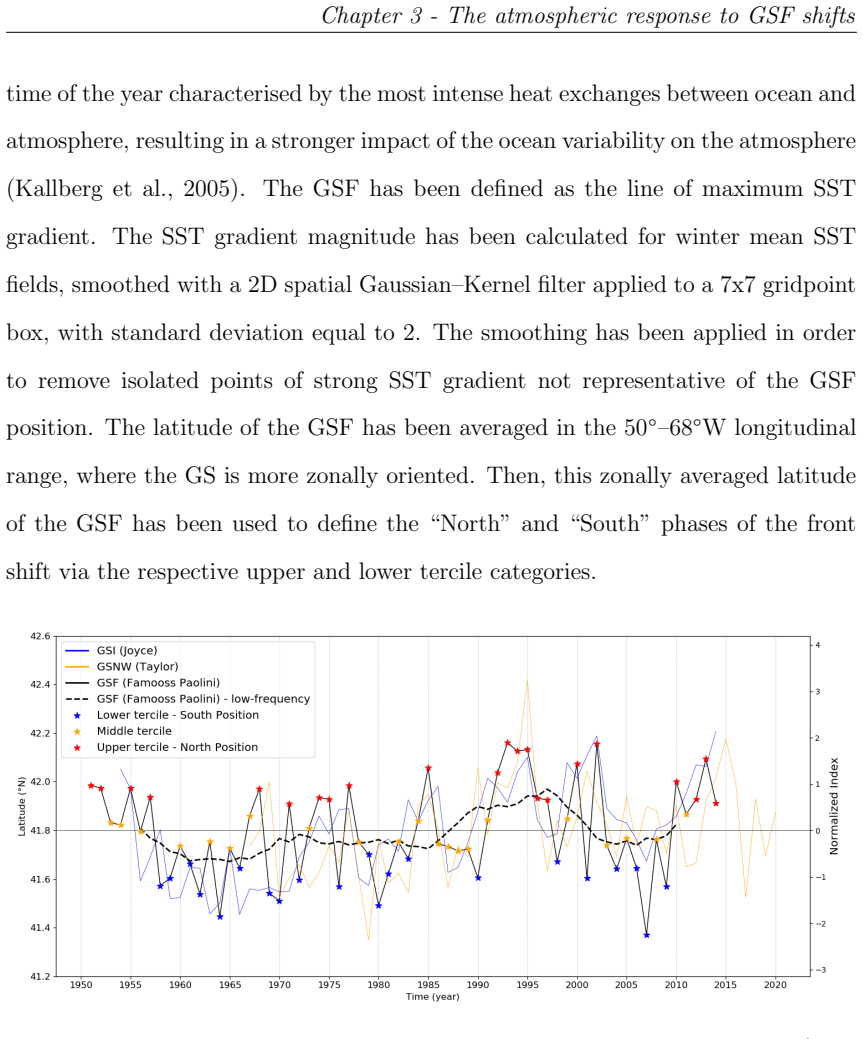
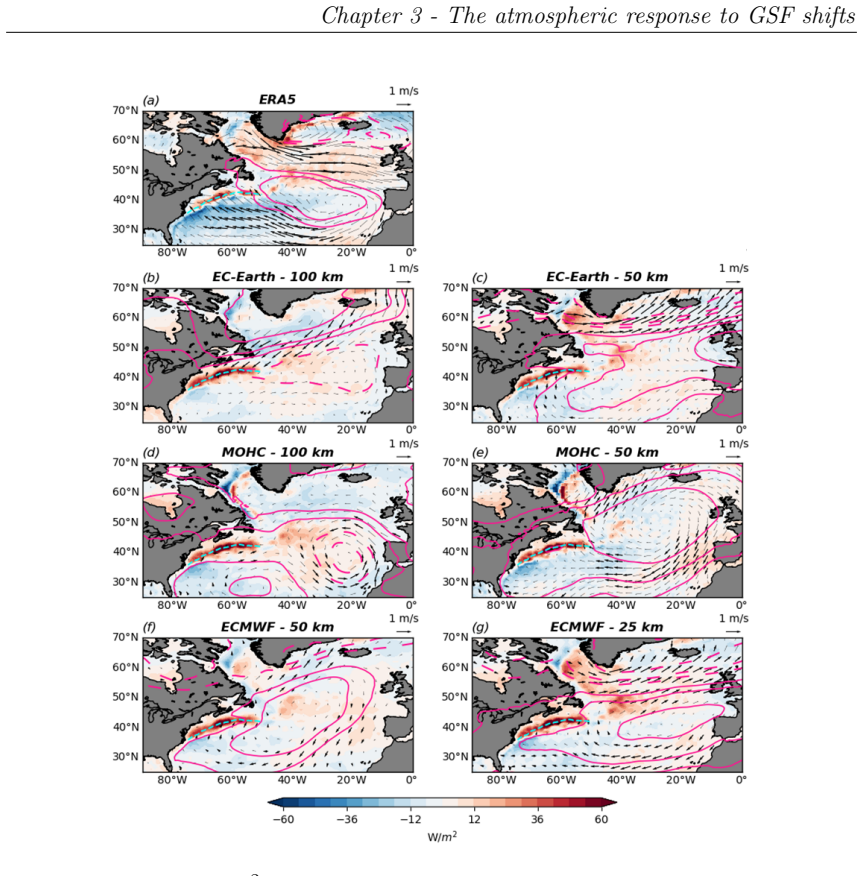
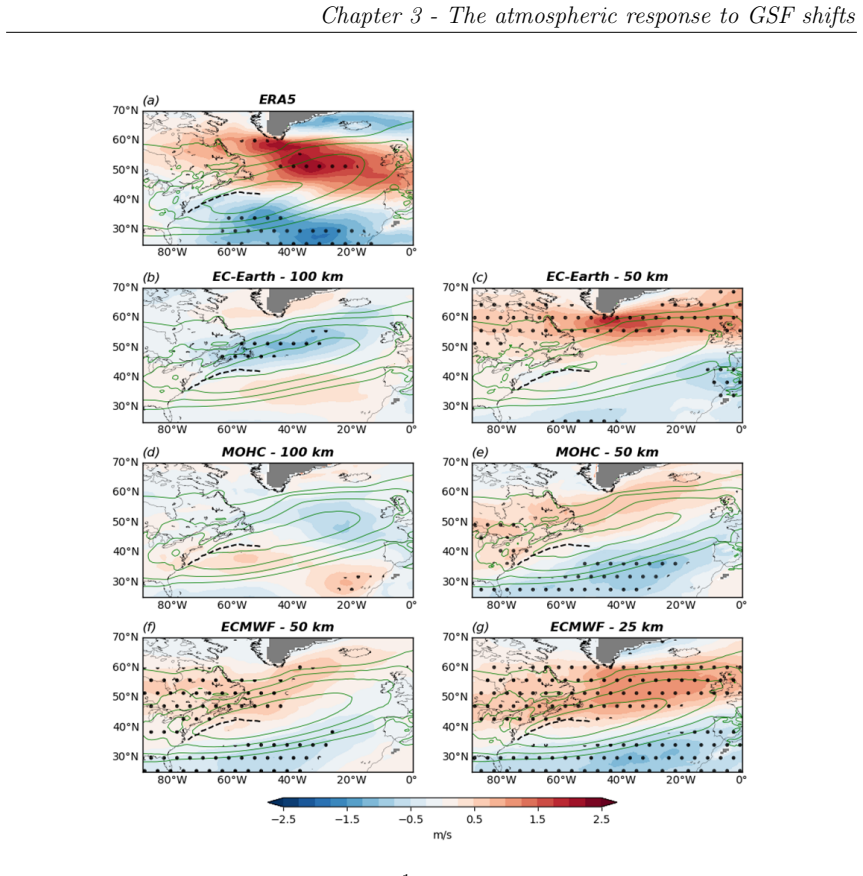
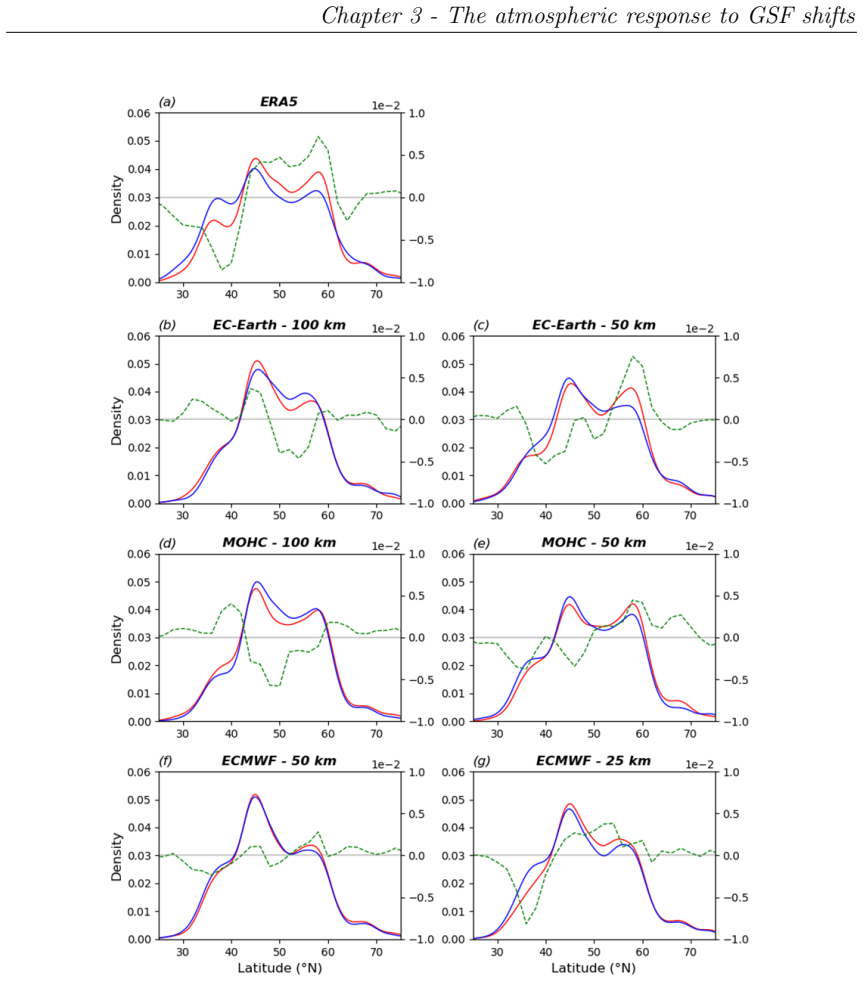
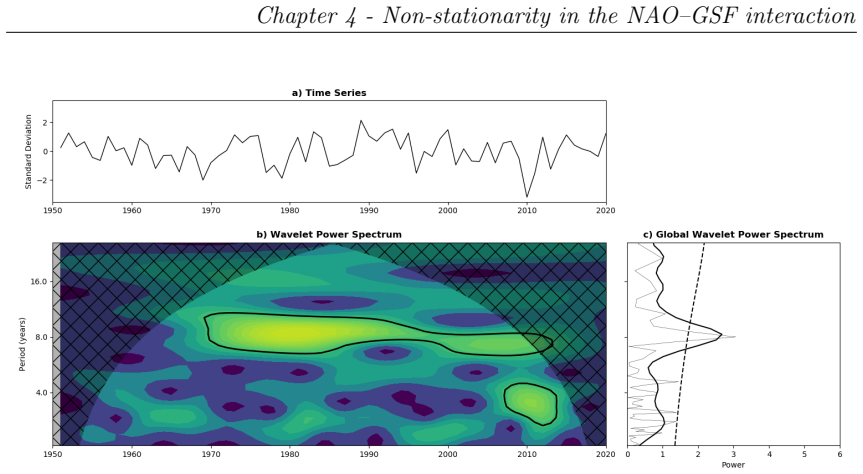
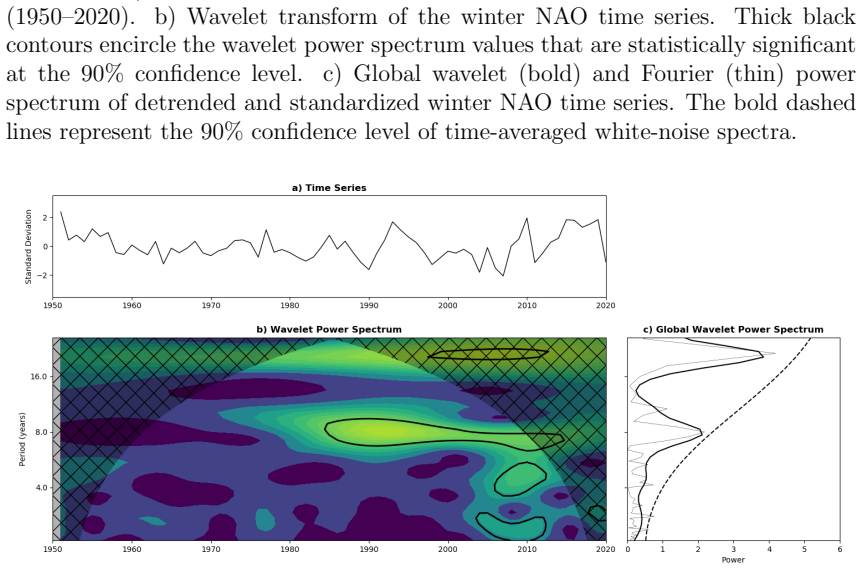
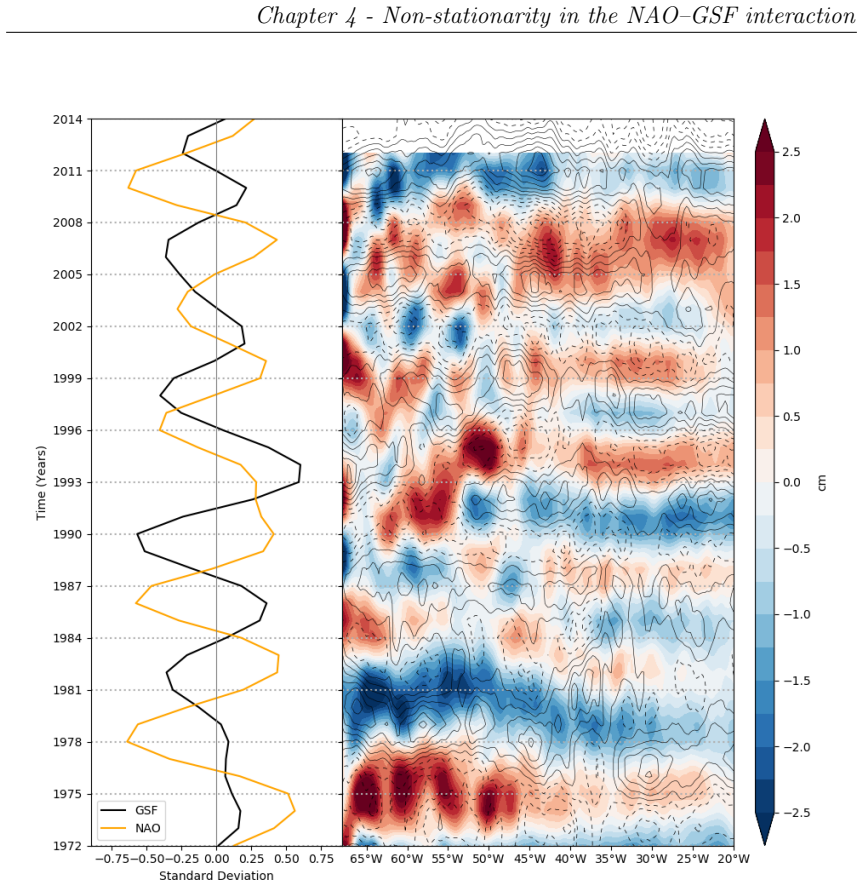
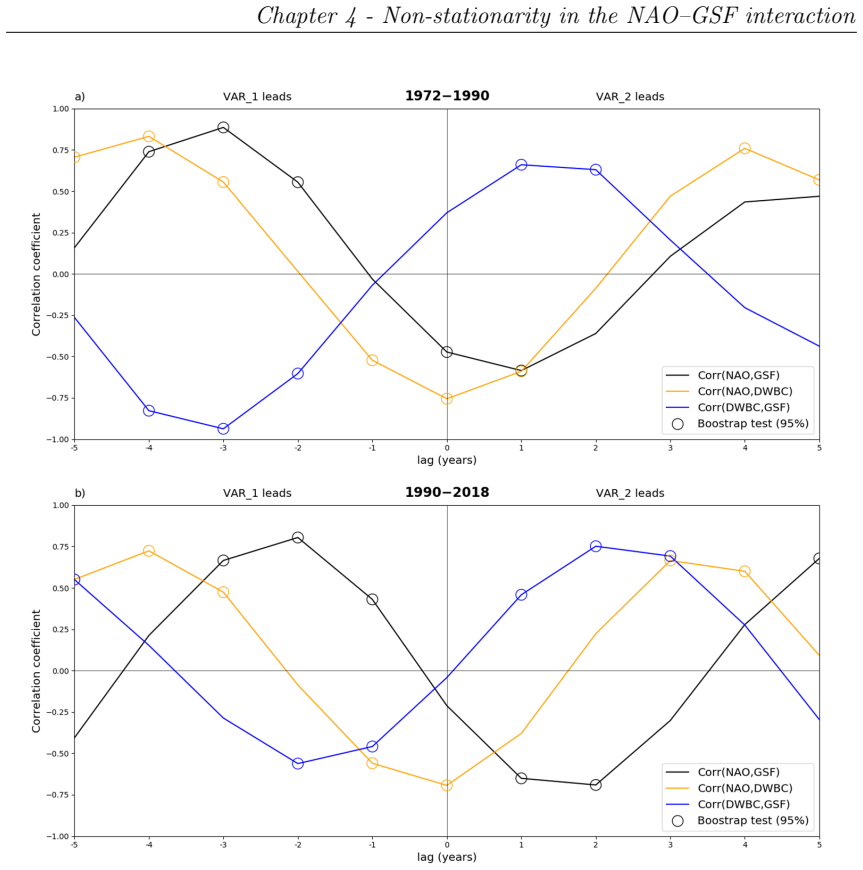
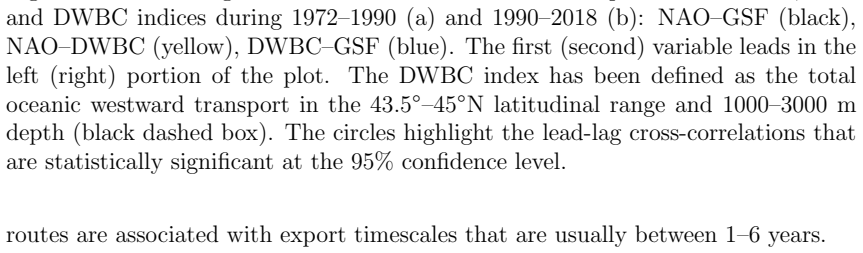
Sea surface temperature (SST) gradients associated with western boundary currents affect the atmospheric circulation across a range of spatial and temporal scales. Yet, several aspects of ocean-atmosphere interactions linked to oceanic fronts remain unclear. This PhD thesis analyses such interactions for the Gulf Stream SST front (GSF). The first part assesses the atmospheric response to the interannual GSF meridional shifts and its dependence on model horizontal resolution, using ERA5 reanalysis and atmosphere-only simulations forced by observed SST. Results show that the response is strongly resolution dependent, with only simulations finer than 50km resembling observed anomalies. Locally, diabatic heating near the GSF is mainly balanced by vertical motion and transient eddy heat transport. At large-scale, the GSF shifts is associated with a homo-directional shift in the North Atlantic eddy-driven jet and storm track, mediated by changes in low-level baroclinicity. The second part assesses the North Atlantic Oscillation (NAO)-GSF interaction and the mechanisms through which the NAO forces the GSF shifts on decadal timescale, using atmosphere and ocean reanalyses. The NAO and GSF covary on decadal timescales only during 1972-2018. This non-stationarity is also reflected in their lead-lag relationship: the NAO leads the GSF shifts by 3 years during 1972-1990 and by 2 years during 1990-2018. The lag is interpreted as the joint effect of the fast response of wind-driven oceanic circulation, the lagged response of deep oceanic circulation, and the propagation of Rossby waves. However, Rossby wave propagation is evident only before 1990, suggesting that its non-stationarity may explain the different NAO-GSF time lag before and after 1990. Overall, the thesis improves understanding of GSF variability and its role in North Atlantic and extratropical climate variability.
Editorial analysis
A structured set of objections, weighed in public.
Referee Report
Summary. The manuscript is a PhD thesis examining ocean-atmosphere interactions at the Gulf Stream SST front (GSF). Using ERA5 reanalysis and atmosphere-only simulations forced by observed SST, the first part shows that the atmospheric response to interannual GSF meridional shifts is strongly resolution-dependent, with only simulations finer than 50 km resembling observed anomalies. Locally, diabatic heating near the GSF is mainly balanced by vertical motion and transient eddy heat transport; at large scales, GSF shifts are associated with homo-directional shifts in the North Atlantic eddy-driven jet and storm track, mediated by low-level baroclinicity changes. The second part uses atmosphere and ocean reanalyses to assess NAO-GSF interactions on decadal timescales, finding covariance only during 1972-2018, with the NAO leading GSF shifts by 3 years (1972-1990) and 2 years (1990-2018). The lag is interpreted as the joint effect of fast wind-driven circulation, lagged deep circulation, and Rossby wave propagation (the latter evident only pre-1990).
Significance. If the results hold, particularly the resolution dependence of the atmospheric response and the non-stationary NAO-GSF relationship with its mechanistic interpretation, the work would improve understanding of how oceanic fronts influence midlatitude circulation and extratropical climate variability. Strengths include the direct comparison of reanalysis with simulations across resolutions and the multi-process explanation linking wind-driven, deep-ocean, and wave mechanisms. The findings have implications for climate model fidelity in the North Atlantic region.
major comments (2)
- [Section on NAO-GSF decadal covariance and lead-lag relationships] The division of the record into 1972-1990 and 1990-2018 for the lead-lag analysis and attribution of differing mechanisms (including Rossby wave influence only pre-1990) lacks a priori justification, pre-specified protocol, sensitivity tests to alternative split years, or formal change-point statistics. This selection is load-bearing for the non-stationarity claim and the interpretation of the lag difference in the second part of the thesis.
- [Results on resolution dependence of atmospheric response] The claim that the response is 'strongly resolution dependent, with only simulations finer than 50km resembling observed anomalies' requires quantitative support (e.g., pattern correlations, RMSE, or anomaly amplitude ratios) across the tested resolutions to establish the 50 km threshold as robust rather than qualitative.
minor comments (2)
- [Abstract] The abstract should explicitly list all reanalysis products and simulation configurations (number of runs, exact resolutions tested) used in each part.
- [Throughout manuscript] Notation for GSF shifts and NAO indices should be defined consistently at the start of each major section to aid readability.
Simulated Author's Rebuttal
We thank the referee for the constructive comments, which highlight areas where additional rigor will strengthen the manuscript. We will revise to incorporate quantitative metrics for the resolution dependence and to provide formal justification, sensitivity tests, and change-point analysis for the 1972-2018 period split and associated mechanisms. These changes address both major points directly.
read point-by-point responses
-
Referee: [Section on NAO-GSF decadal covariance and lead-lag relationships] The division of the record into 1972-1990 and 1990-2018 for the lead-lag analysis and attribution of differing mechanisms (including Rossby wave influence only pre-1990) lacks a priori justification, pre-specified protocol, sensitivity tests to alternative split years, or formal change-point statistics. This selection is load-bearing for the non-stationarity claim and the interpretation of the lag difference in the second part of the thesis.
Authors: We acknowledge that the period split was identified by inspecting the full-record covariance rather than via a pre-specified protocol. In revision we will add: (i) formal change-point detection (e.g., PELT or binary segmentation on the NAO-GSF cross-covariance time series), (ii) sensitivity tests repeating the lead-lag analysis for split years 1985-1995, and (iii) explicit reporting of how the Rossby-wave signature and lag values vary with these choices. These additions will place the non-stationarity claim on a statistically justified footing. revision: yes
-
Referee: [Results on resolution dependence of atmospheric response] The claim that the response is 'strongly resolution dependent, with only simulations finer than 50km resembling observed anomalies' requires quantitative support (e.g., pattern correlations, RMSE, or anomaly amplitude ratios) across the tested resolutions to establish the 50 km threshold as robust rather than qualitative.
Authors: We agree that the present comparison is largely qualitative. The revised manuscript will include, for the principal response fields (500 hPa geopotential height, surface wind, precipitation), (i) spatial pattern correlations with ERA5, (ii) domain RMSE, and (iii) anomaly-amplitude ratios, all computed for every resolution tested. These metrics will be shown in a new table and will objectively support the 50 km threshold. revision: yes
Circularity Check
No circularity: results are direct outputs of reanalysis and simulation comparisons with no derivations or fitted parameters
full rationale
The thesis contains no mathematical derivations, equations, or parameter-fitting steps that could reduce outputs to inputs by construction. All reported findings (resolution dependence, local balances, jet/storm-track shifts, and NAO-GSF lead-lag relationships) are presented as direct empirical results from ERA5 reanalysis and forced simulations. Time-period choices (1972-2018, split at 1990) are stated without any self-referential fitting or uniqueness theorem that would qualify as circular under the enumerated patterns; any concerns about post-hoc selection fall outside the circularity criteria. The analysis is therefore self-contained against external benchmarks.
Axiom & Free-Parameter Ledger
Reference graph
Works this paper leans on
-
[1]
Kallberg and P
P. Kallberg and P. Berrisford and B. J. Hoskins and A. Simmons and S. Uppala and S. Lamy-Thepaut and R. Hine , title =. ERA-40 Project Report Series. 19 , publisher =. 2005 , series =
2005
-
[2]
H. U. Sverdrup , title =. Proceedings of the National Academy of Sciences , volume =. 1947 , doi =
1947
-
[3]
Eos, Transactions American Geophysical Union , volume =
The westward intensification of wind-driven ocean currents , author =. Eos, Transactions American Geophysical Union , volume =. doi:https://doi.org/10.1029/TR029i002p00202 , url =. https://agupubs.onlinelibrary.wiley.com/doi/pdf/10.1029/TR029i002p00202 , abstract =
-
[4]
Walter H. Munk. ON THE WIND-DRIVEN OCEAN CIRCULATION. Journal of Atmospheric Sciences. 1950. doi:10.1175/1520-0469(1950)007<0080:OTWDOC>2.0.CO;2
-
[5]
Brayshaw, DJ. and Hoskins, B. and Blackburn, M. The. 2011. doi:10.1175/2011JAS3674.1
-
[6]
The B asic I ngredients of the N orth A tlantic S torm T rack
David James Brayshaw and Brian Hoskins and Michael Blackburn. The B asic I ngredients of the N orth A tlantic S torm T rack. P art I : L and– S ea C ontrast and O rography. Journal of the Atmospheric Sciences. 2009. doi:10.1175/2009JAS3078.1
-
[7]
Hoskins, B. J. and Valdes, P. J. O n the E xistence of S torm- T racks. 1990. doi:10.1175/1520-0469(1990)047<1854:OTEOST>2.0.CO;2
-
[8]
Novak, Lenka and Ambaum, Maarten H. P. and Tailleux, Rémi. The. 2015. doi:10.1175/JAS-D-14-0082.1
-
[9]
Nakamura, H. and Sampe, T. and Tanimoto, Y. and Shimpo, A. , publisher = AGU, isbn =. Observed. Earth's Climate , pages =. doi:10.1029/147GM18 , year =
-
[10]
Hotta, D. and Nakamura, H. On the. 2011. doi:10.1175/2010JCLI3910.1
-
[11]
Timothy , title =
Pan, Jiayi and Yan, Xiao-Hai and Zheng, Quanan and Liu, W. Timothy , title =. Geophysical Research Letters , volume =. 2002 , doi =
2002
-
[12]
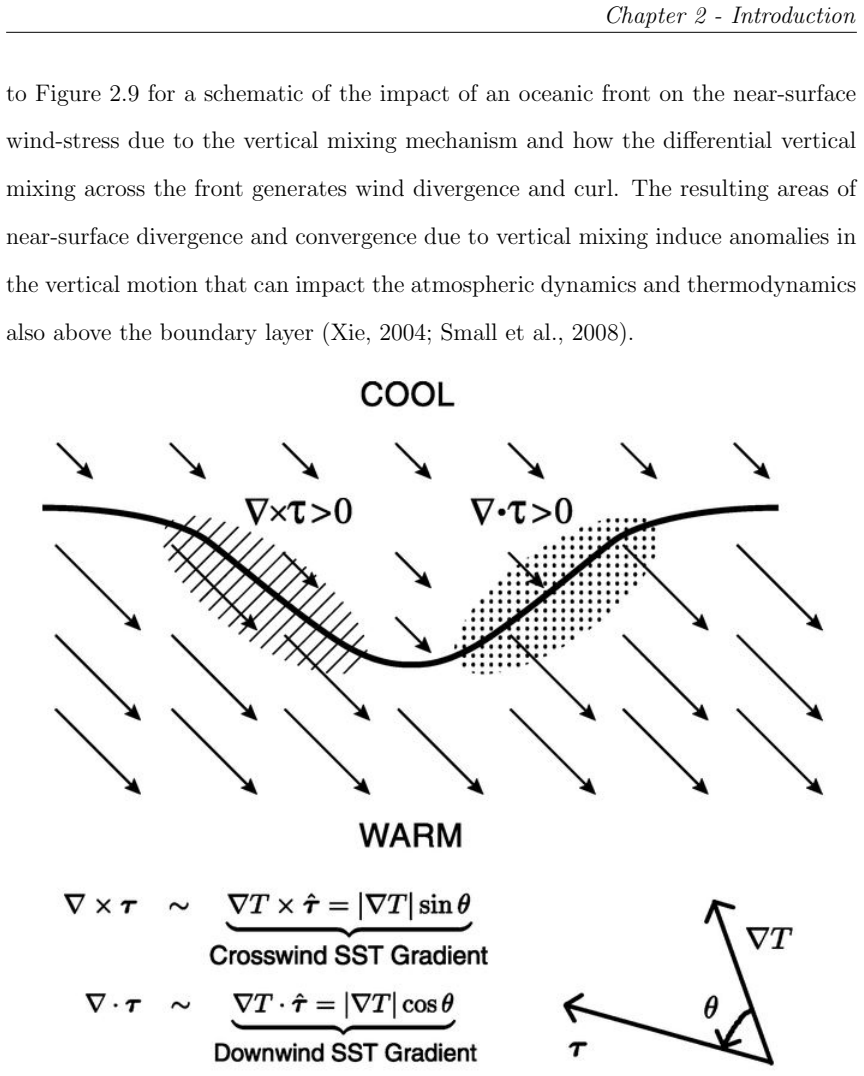
R.J. Small and S.P. deSzoeke and S.P. Xie and L. O’Neill and H. Seo and Q. Song and P. Cornillon and M. Spall and S. Minobe , keywords =. Air–sea interaction over ocean fronts and eddies , journal =. 2008 , note =. doi:https://doi.org/10.1016/j.dynatmoce.2008.01.001 , url =
-
[14]
Atmospheric Response to the Gulf Stream: Seasonal Variations
Shoshiro Minobe and Masato Miyashita and Akira Kuwano-Yoshida and Hiroki Tokinaga and Shang-Ping Xie. Atmospheric Response to the Gulf Stream: Seasonal Variations. Journal of Climate. 2010. doi:10.1175/2010JCLI3359.1
-
[15]
Hoskins, B. J. and Karoly, D. J. The. 1981. doi:10.1175/1520-0469(1981)038<1179:TSLROA>2.0.CO;2
-
[16]
Geophysical Research Letters , volume =
Parfitt, Rhys and Seo, Hyodae , title =. Geophysical Research Letters , volume =. doi:10.1029/2018GL080135 , year =
-
[17]
Quarterly Journal of the Royal Meteorological Society , volume =
Parfitt, Rhys and Czaja, Arnaud , title =. Quarterly Journal of the Royal Meteorological Society , volume =. doi:https://doi.org/10.1002/qj.2689 , url =. https://rmets.onlinelibrary.wiley.com/doi/pdf/10.1002/qj.2689 , abstract =
-
[18]
Takeaki Sampe and Hisashi Nakamura and Atsushi Goto and Wataru Ohfuchi. Significance of a Midlatitude SST Frontal Zone in the Formation of a Storm Track and an Eddy-Driven Westerly Jet. Journal of Climate. 2010. doi:10.1175/2009JCLI3163.1
-
[19]
Geophysical Research Letters , volume =
Nakamura, Hisashi and Sampe, Takeaki and Goto, Atsushi and Ohfuchi, Wataru and Xie, Shang-Ping , title =. Geophysical Research Letters , volume =. doi:https://doi.org/10.1029/2008GL034010 , url =. https://agupubs.onlinelibrary.wiley.com/doi/pdf/10.1029/2008GL034010 , abstract =
-
[20]
Ambaum, Maarten H. P. and Novak, Lenka , title =. Quarterly Journal of the Royal Meteorological Society , volume =. doi:10.1002/qj.2352 , year =
-
[21]
and Minobe, Shoshiro and Kuwano-Yoshida, Akira , title =
O'Reilly, Christopher H. and Minobe, Shoshiro and Kuwano-Yoshida, Akira , title =. Climate Dynamics , volume =. 2016 , doi =
2016
-
[22]
and Minobe, Shoshiro and Kuwano-Yoshida, Akira and Woollings, Tim , title =
O'Reilly, Christopher H. and Minobe, Shoshiro and Kuwano-Yoshida, Akira and Woollings, Tim , title =. Quarterly Journal of the Royal Meteorological Society , volume =. 2017 , doi =
2017
-
[23]
Omrani, Nour-Eddine and Ogawa, Fumiaki and Nakamura, Hisashi and Keenlyside, Noel and Lubis, Sandro W. and Matthes, Katja , title=. Scientific Reports , year=. doi:10.1038/s41598-019-39392-y , url=
-
[24]
and Czaja, A
Sheldon, L. and Czaja, A. and Vannière, B. and Morcrette, C. and Sohet, B. and Casado, M. and Smith, D. , title =. Tellus A: Dynamic Meteorology and Oceanography , volume =. 2017 , publisher =
2017
-
[25]
Geophysical Research Letters , volume =
Parfitt, Rhys and Czaja, Arnaud and Minobe, Shoshiro and Kuwano-Yoshida, Akira , title =. Geophysical Research Letters , volume =. doi:https://doi.org/10.1002/2016GL067723 , url =. https://agupubs.onlinelibrary.wiley.com/doi/pdf/10.1002/2016GL067723 , abstract =
-
[26]
Sandro W. Lubis and Clare S. Y. Huang and Noboru Nakamura and Nour-Eddine Omrani and Martin Jucker. Role of Finite-Amplitude Rossby Waves and Nonconservative Processes in Downward Migration of Extratropical Flow Anomalies. Journal of the Atmospheric Sciences. 2018. doi:10.1175/JAS-D-17-0376.1
-
[27]
Geophysical Research Letters , volume =
Ogawa, Fumiaki and Omrani, Nour-Eddine and Nishii, Kazuaki and Nakamura, Hisashi and Keenlyside, Noel , title =. Geophysical Research Letters , volume =. doi:https://doi.org/10.1002/2015GL066538 , url =. https://agupubs.onlinelibrary.wiley.com/doi/pdf/10.1002/2015GL066538 , abstract =
-
[28]
Frankignoul, C. and Hasselmann, K. , title =. doi:10.1111/j.2153-3490.1977.tb00740.x , year=
-
[29]
J. Bjerknes , abstract =. Atlantic Air-Sea Interaction , editor =. 1964 , issn =. doi:https://doi.org/10.1016/S0065-2687(08)60005-9 , url =
-
[31]
D. S. Battisti and U. S. Bhatt and M. A. Alexander. A Modeling Study of the Interannual Variability in the Wintertime North Atlantic Ocean. Journal of Climate. 1995. doi:10.1175/1520-0442(1995)008<3067:AMSOTI>2.0.CO;2
-
[32]
Climate Dynamics , pages=
Air-Sea interaction over the Gulf Stream in an ensemble of HighResMIP present climate simulations , author=. Climate Dynamics , pages=. 2021 , doi =
2021
-
[34]
Vivier, F. and Kelly, K. A. and Thompson, L. A. Heat Budget in the. 2002. doi:10.1175/1520-0485(2002)032<3436:HBITKE>2.0.CO;2
-
[36]
Deser, C. and Alexander, M. A. and Xie, S. P. and Phillips, A. S. , title =. Annual review of marine science , volume =. doi:10.1146/annurev-marine-120408-151453 , year =
-
[37]
Timothy and Takeuchi, Kensuke , title =
Hashizume, Hiroshi and Xie, Shang-Ping and Liu, W. Timothy and Takeuchi, Kensuke , title =. Journal of Geophysical Research: Atmospheres , volume =. doi:https://doi.org/10.1029/2000JD900684 , url =. https://agupubs.onlinelibrary.wiley.com/doi/pdf/10.1029/2000JD900684 , abstract =
-
[38]
and Inoue, J
Sato, K. and Inoue, J. and Watanabe, M. , title =. Environmental Research Letters , doi =
-
[39]
Mototaka Nakamura and Shozo Yamane. Dominant A nomaly P atterns in the N ear- S urface B aroclinicity and A ccompanying A nomalies in the A tmosphere and O ceans. P art I : N orth A tlantic B asin. 2009. doi:10.1175/2008JCLI2297.1
-
[40]
Joyce, T. M. and Kwon, Y.-O. and Yu, L. On the. 2009. doi:10.1175/2008JCLI2690.1
-
[41]
Joyce, T. M. and Kwon, Y.-O. and Seo, H. and Ummenhofer, C. C. Meridional. 2019. doi:10.1029/2018GL081087
-
[42]
and Alexander, M
Kwon, Y. and Alexander, M. and Bond, N. and Frankignoul, C. and Nakamura, H. and Qiu, B. and Thompson, L. Role of the. 2010
2010
-
[43]
Young-Oh Kwon and Terrence M. Joyce. Northern. 2013. doi:10.1175/JCLI-D-12-00647.1
-
[44]
Peter H. Stone. Baroclinic A djustment. 1978. doi:10.1175/1520-0469(1978)035<0561:BA>2.0.CO;2
-
[45]
Andrews, D. G. and Holton, J. R. and Leovy, C. B. , title =. Academic Press , pages =
-
[46]
and Pierini, S
Quattrocchi, G. and Pierini, S. and Dijkstra, H. A. , TITLE =. Nonlinear Processes in Geophysics , VOLUME =. 2012 , NUMBER =
2012
-
[47]
O'Reilly, C. H. and Czaja, A. , title =. Quarterly Journal of the Royal Meteorological Society , volume =. 2015 , doi =
2015
-
[48]
Ma, X. and Ping Chang, P. and Saravanan, R. and Montuoro, R. and Nakamura, H. and Wu, D. and Lin, X. and Wu L. Importance of. 2017. doi:10.1175/JCLI-D-16-0154.1
-
[49]
and Yeager, S
Athanasiadis, P.J. and Yeager, S. and Kwon, YO. and others , title =. npj Climate and Atmospheric Science , year =
-
[50]
Hyodae Seo and Young-Oh Kwon and Terrence M. Joyce and Caroline C. Ummenhofer. On the Predominant Nonlinear Response of the Extratropical Atmosphere to Meridional Shifts of the Gulf Stream. Journal of Climate. 2017. doi:10.1175/JCLI-D-16-0707.1
-
[52]
Claude Frankignoul and Gaelle de Coëtlogon and Terrence M. Joyce and Shenfu Dong. Gulf. 2001. doi:10.1175/1520-0485(2002)031<3516:GSVAOA>2.0.CO;2
-
[53]
Samantha M. Wills and David W. J. Thompson and Laura M. Ciasto. On the. 2016. doi:10.1175/JCLI-D-15-0820.1
-
[54]
Czaja, A. and Frankignoul, C. and Minobe, S. and other. Simulating the. Current Climate Change Reports. 2019. doi:10.1007/s40641-019-00148-5
-
[55]
Smirnov, D. and Newman, M. and Alexander, M. A. and Kwon, Y.-O. and Frankignoul, C. Investigating the. 2015. doi:10.1175/JCLI-D-14-00285.1
-
[56]
Feliks, Y. and Ghil, M. and Simonnet, E. Low-. 2004. doi:10.1175/1520-0469(2004)061<0961:LVITMA>2.0.CO;2
-
[57]
Willison, J. and Robinson, W. A. and Lackmann, G. M. The. 2013. doi:10.1175/JAS-D-12-0226.1
-
[58]
Yang, Haijun and Li, Qing and Wang, Kun and Sun, Yu and Sun, Daoxun , title=. Climate Dynamics , year=. doi:10.1007/s00382-014-2380-5 , url=
-
[59]
John T. Fasullo and Kevin E. Trenberth. The Annual Cycle of the Energy Budget. Part II: Meridional Structures and Poleward Transports. Journal of Climate. 2008. doi:10.1175/2007JCLI1936.1
-
[60]
Ducet, N. and Le Traon, P. Y. and Reverdin, G. , title =. Journal of Geophysical Research: Oceans , volume =. doi:https://doi.org/10.1029/2000JC900063 , url =. https://agupubs.onlinelibrary.wiley.com/doi/pdf/10.1029/2000JC900063 , abstract =
-
[61]
Lisan Yu and Robert A. Weller. Objectively Analyzed Air–Sea Heat Fluxes for the Global Ice-Free Oceans (1981–2005). Bulletin of the American Meteorological Society. 2007. doi:10.1175/BAMS-88-4-527
-
[62]
Nelson G. Hogg and Robert S. Pickart and Ross M. Hendry and William J. Smethie , abstract =. The northern recirculation gyre of the gulf Stream , journal =. 1986 , issn =. doi:https://doi.org/10.1016/0198-0149(86)90017-8 , url =
-
[63]
Worthington, L. V. , publisher =. On the. John Hopkins Oceanographic Studies , year =
-
[64]
On the transport of the gulf stream between cape hatteras and the grand banks , journal =
Nelson G Hogg , abstract =. On the transport of the gulf stream between cape hatteras and the grand banks , journal =. 1992 , issn =. doi:https://doi.org/10.1016/0198-0149(92)90066-3 , url =
-
[65]
Holland, W. R. and Harrison, D. E. and Semtner, A. J. Eddy-Resolving Numerical Models of Large-Scale Ocean Circulation. Eddies in Marine Science. 1983
1983
-
[66]
and Mellor, G
Ezer, T. and Mellor, G. L. numerical study of the variability and the separation of the Gulf Stream, induced by surface atmospheric forcing and lateral boundary flows. Journal of physical oceanography. 1992
1992
-
[67]
Daniel Halkin and T. Rossby. The Structure and Transport of the Gulf Stream at 73°W. Journal of Physical Oceanography. 1985. doi:10.1175/1520-0485(1985)015<1439:TSATOT>2.0.CO;2
-
[69]
Michael A. Spall. Dynamics of the Gulf Stream/Deep Western Boundary Current Crossover. Part II: Low-Frequency Internal Oscillations. Journal of Physical Oceanography. 1996. doi:10.1175/1520-0485(1996)026<2169:DOTGSW>2.0.CO;2
-
[70]
Parsons, A. T. , title=. Journal of Fluid Mechanics , year=. doi:10.1017/S0022112069002308 , url=
-
[71]
Model of world ocean circulation: I
Veronis, G. Model of world ocean circulation: I. Wind-driven, two layer. Journal of Marine Research. 1973
1973
-
[72]
Rong Zhang and Geoffrey K. Vallis. The Role of Bottom Vortex Stretching on the Path of the North Atlantic Western Boundary Current and on the Northern Recirculation Gyre. Journal of Physical Oceanography. 2007. doi:10.1175/JPO3102.1
-
[73]
Tansley, Claire E. and Marshall, David P. On the influence of bottom topography and the Deep Western Boundary Current on Gulf Stream separation. Journal of Marine Research. 2000. doi:doi:10.1357/002224000321511179
-
[74]
J. Dana Thompson and W. J. Schmitz. A Limited-Area Model of the Gulf Stream: Design, Initial Experiments, and Model-Data Intercomparison. Journal of Physical Oceanography. 1989. doi:10.1175/1520-0485(1989)019<0791:ALAMOT>2.0.CO;2
-
[75]
Krauss, W. and KäSe, R. H. and Hinrichsen, H.-H. , title =. Journal of Geophysical Research: Oceans , volume =. doi:https://doi.org/10.1029/JC095iC08p13089 , url =. https://agupubs.onlinelibrary.wiley.com/doi/pdf/10.1029/JC095iC08p13089 , abstract =
-
[77]
Johns, W. E. and Shay, T. J. and Bane, J. M. and Watts, D. R. , title =. Journal of Geophysical Research: Oceans , volume =. doi:https://doi.org/10.1029/94JC02497 , url =. https://agupubs.onlinelibrary.wiley.com/doi/pdf/10.1029/94JC02497 , abstract =
-
[78]
Journal of Geophysical Research: Oceans , volume =
Lee, Tong and Cornillon, Peter , title =. Journal of Geophysical Research: Oceans , volume =. doi:https://doi.org/10.1029/95JC01219 , url =. https://agupubs.onlinelibrary.wiley.com/doi/pdf/10.1029/95JC01219 , abstract =
-
[79]
Otis B. Brown and Peter C. Cornillon and Steven R. Emmerson and H.Mark Carle , abstract =. Gulf Stream warm rings: a statistical study of their behavior , journal =. 1986 , issn =. doi:https://doi.org/10.1016/0198-0149(86)90062-2 , url =
-
[80]
Peter Cornillon. The Effect of the New England Seamounts on Gulf Stream Meandering as Observed from Satellite IR Imagery. Journal of Physical Oceanography. 1986. doi:10.1175/1520-0485(1986)016<0386:TEOTNE>2.0.CO;2
-
[81]
Journal of Geophysical Research: Oceans , volume =
Cornillon, Peter and Gilman, Craig and Stramma, Lothar and Brown, Otis and Evans, Robert and Brown, James , title =. Journal of Geophysical Research: Oceans , volume =. doi:https://doi.org/10.1029/JC092iC12p12993 , url =. https://agupubs.onlinelibrary.wiley.com/doi/pdf/10.1029/JC092iC12p12993 , abstract =
-
[82]
Reviews of Geophysics , volume =
Marshall, John and Schott, Friedrich , title =. Reviews of Geophysics , volume =. doi:https://doi.org/10.1029/98RG02739 , url =. https://agupubs.onlinelibrary.wiley.com/doi/pdf/10.1029/98RG02739 , abstract =
-
[83]
Chapter 5.5 Deep convection , editor =
John Lazier and Robert Pickart and Peter Rhines , abstract =. Chapter 5.5 Deep convection , editor =. 2001 , booktitle =. doi:https://doi.org/10.1016/S0074-6142(01)80130-3 , url =
-
[84]
Krauss, W. , title =. Journal of Geophysical Research: Oceans , volume =. doi:https://doi.org/10.1029/JC091iC04p05061 , url =. https://agupubs.onlinelibrary.wiley.com/doi/pdf/10.1029/JC091iC04p05061 , abstract =
-
[85]
M. Susan Lozier , title =. Science , volume =. 2010 , doi =. https://www.science.org/doi/pdf/10.1126/science.1189250 , abstract =
-
[86]
Bower, Amy S. and Lozier, M. Susan and Gary, Stefan F. and B. Interior pathways of the North Atlantic meridional overturning circulation , journal=. 2009 , month=. doi:10.1038/nature07979 , url=
-
[87]
Export of Labrador Sea Water from the subpolar North Atlantic: A Lagrangian perspective , journal =
Amy Bower and Susan Lozier and Stefan Gary , keywords =. Export of Labrador Sea Water from the subpolar North Atlantic: A Lagrangian perspective , journal =. 2011 , note =. doi:https://doi.org/10.1016/j.dsr2.2010.10.060 , url =
discussion (0)
Sign in with ORCID, Apple, or X to comment. Anyone can read and Pith papers without signing in.