REVIEW 3 major objections 7 minor 60 references
Peering into the heart of darkness with VLBA : Radio Quiet AGN in the JWST North Ecliptic Pole Time-Domain Field
T0 review · 3 major / 7 minor · reviewed 2026-08-15 · deepseek-v4-flash
Pith's one-line read The paper reports that 4.8 GHz VLBA observations of 106 VLA radio sources in the JWST North Ecliptic Pole Time-Domain Field detect 12 compact parsec-scale AGN cores, and argues that in most of these radio-quiet AGN star formation…
desk verdict A solid VLBA catalog paper with robust AGN detections, but the SF-fraction headline is overreaching and one internal inconsistency (z=0 in Tb despite known redshifts) needs fixing. read the letter →
The pith
A machine-rendered reading of the paper's core claim, the machinery that carries it, and where it could break.
The reading
What carries the argument
The central observational tool is the VLBA at 4.8 GHz with about 4 mas resolution and $\sim3.3\,\mu$Jy/beam rms sensitivity, which separates compact nuclear emission from extended disk emission. The two quantitative handles are the brightness temperature $T_\mathrm{B} > 10^5$ K, which excludes star formation as the dominant emission mechanism, and the VLBA/VLA flux density ratio, which measures how much of the arcsecond-scale VLA emission is recovered in the compact core. The VLA 3 GHz spectral index completes the picture: sources with flat spectra ($\alpha \gtrsim -0.5$) lie close to equality in the VLBA-versus-VLA plot, identifying them as self-absorbed AGN cores, while steeper-spectrum sources are more extended and retain a larger star-forming component.
What would settle it
Image the 12 VLBA-detected sources at a resolution between the VLA's 0.7 arcsecond and the VLBA's 4 mas (for example, at roughly 0.1 arcsecond) and measure the spectral index and morphology of the flux the VLBA resolves out; if that missing flux shows steep-spectrum extended lobes or a jet rather than a star-forming disk, the assumption that it is star formation is wrong and the inferred star-formation fractions would need revision.
Extended reading notes
Core claim
Most of the 12 VLBA detections harbor compact parsec-scale radio sources with brightness temperatures exceeding $10^5$ K and VLBA/VLA flux ratios that place the emission in the AGN-dominated regime. The paper concludes that star formation contributes less than 50% of the total VLBA radio emission in the majority of these sources, and in a few cases the emission is almost entirely AGN-driven. The compact emission is confined to regions smaller than about 40 pc, consistent with the base of a jet or the accretion-disk corona, and flatter-spectrum sources ($\alpha \gtrsim -0.5$) show higher VLBA/VLA ratios, indicating optically thick, self-absorbed synchrotron cores. Eight detections with JWST/NIRCam counterparts lie in early-type, bulge-dominated galaxies with low JWST-based star formation rates, and WISE colors of the detections are AGN-like or intermediate-disk rather than purely star-forming.
Load-bearing premise
The load-bearing premise is that the arcsecond-scale VLA flux the VLBA does not recover is star formation resolved out at 4 mas resolution, not diffuse AGN jet or lobe emission, and if some of that missing flux is AGN-related the claim that star formation contributes less than half of the radio emission in most detections would overstate AGN dominance.
Editorial extensions
If this is right
- Arcsecond-scale radio surveys that classify radio-quiet AGN by spectral index alone may systematically miss the compact AGN component, so VLBI follow-up is needed to reveal it.
- The detection rate rises from about 11% overall to roughly 35% for VLA sources brighter than 50 microJy at 3 GHz, implying that deeper or longer VLBA observations should recover many more compact cores in this field.
- JWST-based star formation rates for the VLBA detections are lower than SCUBA-2 estimates, indicating that radio-inclusive spectral energy distribution fits can overestimate star formation when an AGN contributes to the radio flux.
- The host galaxies of the VLBA detections are predominantly early-type, bulge-dominated systems, linking compact AGN cores to massive bulges rather than to actively star-forming disks.
- The absence of kpc-scale radio emission from most of the compact AGN cores raises the open question of why these jets or coronae do not produce larger-scale radio structures.
Reading between the lines
- If compact AGN cores are common in radio-quiet AGN, the label 'radio-quiet' may describe low jet power or orientation rather than the absence of jet launching; a larger sample at similar sensitivity could test whether flat-spectrum cores appear in all such AGN.
- The paper's star-formation fraction argument assumes the VLA flux that the VLBA does not recover is star formation resolved out at 4 mas resolution; imaging the same sources at intermediate resolution (about 0.1 arcsecond) would directly test whether any of that missing flux is diffuse AGN lobe emission.
- Extending the same survey to 1.4 GHz would test how much synchrotron self-absorption shapes the 4.8 GHz detections, since self-absorbed cores are relatively brighter at higher frequencies and lower-frequency observations might reveal additional extended AGN components.
Signed reviews
Editorial analysis
A structured set of objections, weighed in public.
Referee Report
Summary. The paper reports a 4.8 GHz VLBA survey of 106 compact VLA sources in the JWST North Ecliptic Pole Time-Domain Field, detecting 12 sources at roughly 3.3 uJy rms sensitivity and 4 mas resolution. The authors derive parsec-scale sizes, brightness temperatures, spectral indices, and VLBA/VLA flux ratios, and they match the detections to WISE, SCUBA-2, JWST/NIRCam, and SDSS counterparts. They conclude that most detections contain AGN-driven compact radio emission, that the VLBA/VLA flux ratio correlates with flat spectral indices, and that star formation contributes less than 50% of the radio emission in the majority of the sources. They also compare SCUBA-2-based and JWST-based star formation rates and discuss the resulting discrepancies.
Significance. If the central claims hold, this work demonstrates that deep, high-frequency VLBI observations can identify compact AGN components in a radio-quiet AGN population where star formation has often been assumed to dominate, and the JWST-based SFR comparison is a useful step toward AGN/SF decomposition. The survey is among the most sensitive VLBI deep fields at 4.8 GHz, and the detailed calibration and imaging description, together with the catalog in Tables 3 and A1, makes the observational result reproducible and valuable as a reference sample. The high brightness temperatures are a robust observational signature of non-thermal AGN activity. The main weaknesses are that the spectral-index/compactness correlation is not quantified statistically and that the SF-fraction claim rests on an unstated assumption about the origin of the VLA flux not recovered by the VLBA.
major comments (3)
- [§4.4, Figures 7–8] The claimed correlation between VLA spectral index and VLBA/VLA flux-density ratio, and the associated compactness trend, is not quantified. The figures show no error bars on the ratio even though the ratio is formed by extrapolating the 3 GHz VLA fluxes to 4.8 GHz using spectral indices whose uncertainties reach about ±0.33 in Table 3, and the sample contains only 12 sources. Before the sharp rise at α≳−0.5 is interpreted as evidence for two accretion regimes, the authors should report a rank correlation coefficient with a significance estimate (for example Spearman or Kendall with bootstrap). As presented, the visual trend is not established at the claimed level.
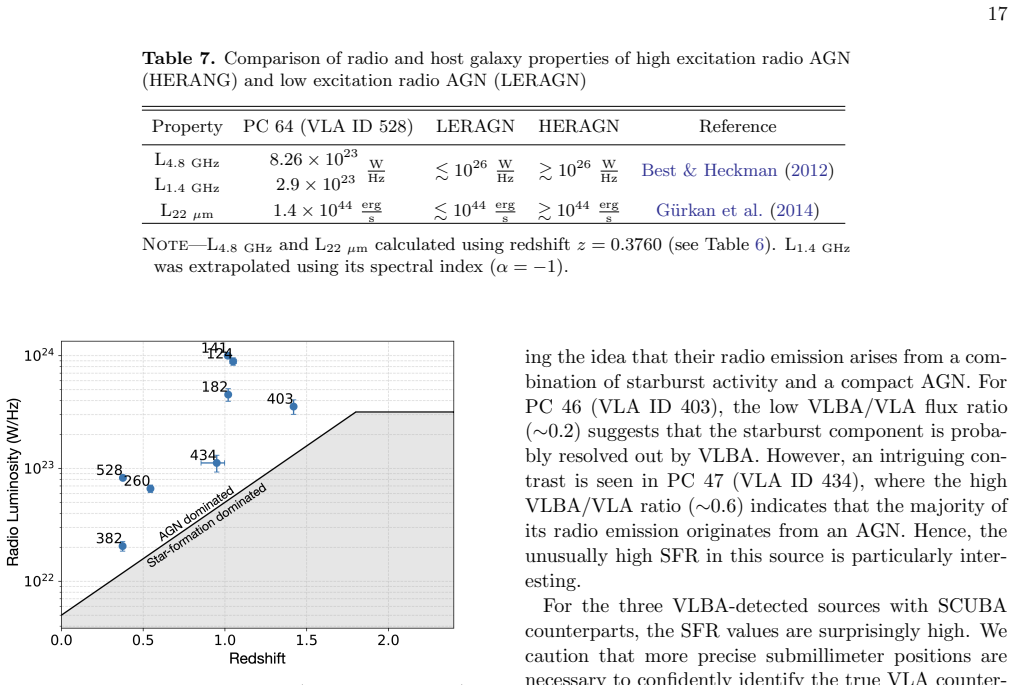
- [§5.2 and Abstract] The central statement that star formation contributes less than 50% of the radio emission in the majority of detections rests on interpreting the VLBA/VLA flux ratio as an AGN/SF decomposition. This assumes that the VLA emission missing from the 4 mas VLBA images is star formation resolved out at VLBA resolution; unresolved low-surface-brightness AGN jet or lobe emission would make the inferred SF fraction an upper limit rather than a measurement, and the 0.7-arcsecond VLA data could themselves miss extended star-forming emission. The independent JWST SFRs in Table 6 support the conclusion for at least five of the seven sources with measurements, but the abstract's claim covers all 12 detections, four of which lack JWST constraints, and the two high-SFR sources PC 46 and PC 47 complicate the picture. The ratio argument should be presented as suggestive, supported by the SFR check for the subset with JWST data, rather than as a direct measurement for the full sample.
- [§5.1 and Figure 12] The use of the P_cross criterion to conclude that all VLBA detections are AGN-dominated appears to mix radio frequencies. The P_cross threshold of Magliocchetti et al. (2018) is built on 1.4 GHz radio luminosity functions, while Figure 12 and the text plot 4.8 GHz luminosities. Since L_4.8/L_1.4 = (4.8/1.4)^α, with α in the range roughly −1 to −0.5 for these sources, the threshold must be converted to 4.8 GHz before comparison. The paper does not state such a conversion, so the statement that all VLBI sources lie above this threshold is not currently established; a borderline source such as PC 41 could change classification.
minor comments (7)
- [Table 2 vs. Abstract and §4.1] Table 2 lists a detection fraction of 20% for the NEP field, while the abstract and §4.1 report 12/106 ≈ 11%; these numbers should be reconciled.
- [§4.3, Equation (1)] The brightness temperature is computed with z=0 for all sources even though redshifts are known for eight sources in Table 6. Since the (1+z) factor only increases T_b, this is conservative, but Table 5 should either use the measured redshifts or explicitly state that all values are lower limits evaluated at z=0.
- [Table 5] The table note says that for unresolved sources the deconvolved size is set to the beam size, but the listed deconvolved major/minor axes for PC 24, PC 64, PC 67, and PC 71 are smaller than or different from the 4.0×3.5 mas beam; please clarify whether these are fitted deconvolved values or beam-size lower limits.
- [§4.4] The text refers to 'flux densities above 200 mJy' for PC 6 and PC 33, but Table A1 gives 340 and 324 µJy; the unit should be µJy, not mJy.
- [§5.4] The descriptions of PC 3 and PC 7 report only 0.24% and 0.21% AGN contributions, which conflicts with §4.7's statement that the median fractional AGN contribution is approximately 0.21–0.25; if the latter is a fraction, the former should read 21–25%.
- [§5.1 vs. Table 1] The text says flat or inverted AGN spectra have α≳0.7, while Table 1 and the rest of the paper use α≳−0.5 as the flat/inverted boundary; this threshold should be made consistent.
- [§5.1 and Figure 12] The statement that all VLBI sources lie above the P_cross threshold should be restricted to the eight sources with redshifts; the four sources without redshifts cannot be placed in Figure 12.
Circularity Check
No significant circularity: the VLBA detections and AGN classification rest on independent measurements and external physical thresholds.
full rationale
The paper's central claim—that most of the 12 VLBA detections contain compact parsec-scale AGN emission with star formation contributing less than 50% of the radio emission—is supported by new VLBA measurements (flux densities, brightness temperatures, spectral indices) combined with external physical criteria (T_b > 10^5 K, spectral-index thresholds, WISE color diagnostics, and the Magliocchetti et al. 2018 P_cross luminosity threshold). No parameter is fitted to the VLBA data and then renamed as a prediction. The VLBA/VLA flux-density ratio is an observed quantity, and the statement that a ratio of 0.7–0.8 implies 70–80% AGN-driven emission is an interpretation of that ratio, not a circular reduction. The paper's reliance on Hyun et al. (2023), Willner et al. (2023), and Ortiz et al. (2024) involves some author overlap, but those works provide independent multi-wavelength catalogs and classifications that are not derived from the VLBA result. The SFR comparison between SCUBA-2 and JWST is a comparison of independent datasets, and the methodological caveat that SCUBA SED fits include VLA radio flux is a critique of those fits, not a circular argument. The unresolved-VLA-flux completeness concern raised in the skeptic view affects the robustness of the SF-fraction inference but is not a case of the paper deriving X from Y where X is defined in terms of Y. Overall, no derivation step reduces to its own inputs, and the finding is a normal, self-contained observational analysis.
Assumptions & free parameters
assumptions (4)
- domain assumption The VLA flux not detected by the VLBA at 4 mas resolution is dominated by star formation rather than diffuse AGN emission.
- domain assumption Brightness temperatures above 10^5 K at z>0.1 uniquely indicate AGN-related emission.
- domain assumption The radio spectral index measured from VLA 3 GHz subbands remains valid for extrapolating to 4.8 GHz.
- domain assumption Redshift z=0 assumed in brightness temperature calculation (Eq. 1).
Cite this review
Pith. "Pith review of Peering into the heart of darkness with VLBA : Radio Quiet AGN in the JWST North Ecliptic Pole Time-Domain Field." pith.science (2026). https://pith.science/paper/PXG4AHCH
@misc{pith2026250618112,
  author       = {Pith},
  title        = {Pith review of: Peering into the heart of darkness with VLBA : Radio Quiet AGN in the JWST North Ecliptic Pole Time-Domain Field},
  year         = {2026},
  howpublished = {\url{https://pith.science/paper/PXG4AHCH}},
  note         = {Machine review of arXiv:2506.18112}
}
abstract
We present initial results from the 4.8 GHz Very Long Baseline Array (VLBA) survey of the JWST North Ecliptic Pole Time-Domain Field (TDF). From 106 radio sources found in the Karl G. Jansky Very Large Array observations in the TDF, we detected 12 sources (11% detection rate) at 3.3 $\mu$Jy rms sensitivity and 4 mas resolution. Most detections exhibit pc-scale emission (less than 40 pc) with high VLBA/VLA flux density ratios and brightness temperatures exceeding 10$^5$ K, confirming non-thermal AGN activity. Spectral indices ($>$ -0.5) correlate with higher VLBA/VLA flux ratios, consistent with synchrotron emission from AGN coronae or jets. In the majority of our sources star formation contributes less than 50% of the total VLBA radio emission, with a few cases where the emission is almost entirely AGN-driven. Although the radio emission from radio quiet AGN is thought to be primarily driven by star formation, our VLBA observations confirm that there is also often a contribution at various levels from black hole driven AGN. Eight VLBA detections have JWST/NIRCam counterparts, predominantly early-type, bulge-dominated galaxies, which we use to get an estimate of the redshift and star formation rate (SFR). WISE colors indicate that VLBA detections are either AGN or intermediate-disk-dominated systems, while VLBA non-detections correspond to extended, star-forming galaxies. We compare SFRs derived from previous SCUBA-2 850 $\mu$m observations with new JWST-based estimates, and discuss the observed discrepancies, highlighting JWST's improved capability to disentangle AGN activity from star formation.
Figures


Figures from the paper (7 more)


Reference graph
Works this paper leans on
-
[1]
, " * write output.state after.block = add.period write newline
ENTRY address archivePrefix author booktitle chapter doi edition editor eprint howpublished institution journal key month number organization pages publisher school series title misctitle type volume year version url label extra.label sort.label short.list INTEGERS output.state before.all mid.sentence after.sentence after.block FUNCTION init.state.consts ...
-
[2]
write newline
" write newline "" before.all 'output.state := FUNCTION format.url url empty "" new.block "" url * "" * if FUNCTION format.eprint eprint empty "" archivePrefix empty "" archivePrefix "arXiv" = new.block " " eprint * " " * new.block " " eprint * " " * if if if FUNCTION format.doi doi empty "" " " doi * " " * if FUNCTION format.pid doi empty eprint empty ur...
-
[3]
bC]ueQe. ʛ @ ss C ZI! )lR * B ` l^\ g -
thebibliography [1] 20pt to REFERENCES 6pt =0pt 10pt plus 3pt =0pt =0pt =1pt plus 1pt =0pt =0pt -12pt =13pt plus 1pt =20pt =13pt plus 1pt \@M =10000 =-1.0em =0pt =0pt 0pt =0pt =1.0em @enumiv\@empty 10000 10000 `\.\@m \@noitemerr \@latex@warning Empty `thebibliography' environment \@ifnextchar \@reference \@latexerr Missing key on reference command Each re...
arXiv 2019
-
[4]
Best , P. N., & Heckman , T. M. 2012, , 421, 1569, 10.1111/j.1365-2966.2012.20414.x
arXiv 2012
-
[5]
Brasseur , C. E., Phillip , C., Fleming , S. W., Mullally , S. E., & White , R. L. 2019, Astrocut: Tools for creating cutouts of TESS images , Astrophysics Source Code Library, record ascl:1905.007
work page 2019
-
[6]
Chi , S., Barthel , P. D., & Garrett , M. A. 2013, , 550, A68, 10.1051/0004-6361/201220783
-
[7]
Condon , J. J. 1992, , 30, 575, 10.1146/annurev.aa.30.090192.003043
arXiv 1992
-
[8]
Conroy , C., & Gunn , J. E. 2010, FSPS: Flexible Stellar Population Synthesis , Astrophysics Source Code Library, record ascl:1010.043
work page 2010
Show all 60 references
-
[9]
D., Condon , J
Cotton , W. D., Condon , J. J., Kellermann , K. I., et al. 2018, , 856, 67, 10.3847/1538-4357/aaaec4
2018 doi
-
[10]
T., Brisken , W
Deller , A. T., Brisken , W. F., Phillips , C. J., et al. 2011, , 123, 275, 10.1086/658907
2011 doi
-
[11]
J., Lang , D., et al
Dey , A., Schlegel , D. J., Lang , D., et al. 2019, , 157, 168, 10.3847/1538-3881/ab089d
2019 doi
-
[12]
D'Silva , J. C. J., Driver , S. P., Lagos , C. D. P., et al. 2023, , 524, 1448, 10.1093/mnras/stad1974
2023 doi
-
[13]
2023, , 951, 115, 10.3847/1538-4357/acd4be
Estrada-Carpenter , V., Papovich , C., Momcheva , I., et al. 2023, , 951, 115, 10.3847/1538-4357/acd4be
2023 doi
-
[14]
A., Wrobel , J
Garrett , M. A., Wrobel , J. M., & Morganti , R. 2005, , 619, 105, 10.1086/426424
2005 doi
-
[15]
A., Muxlow , T
Garrett , M. A., Muxlow , T. W. B., Garrington , S. T., et al. 2001, , 366, L5, 10.1051/0004-6361:20000537
2001 doi
-
[16]
2000, , 539, L13, 10.1086/312840
Gebhardt , K., Bender , R., Bower , G., et al. 2000, , 539, L13, 10.1086/312840
2000 doi
-
[17]
Greisen , E. W. 2003, in Astrophysics and Space Science Library, Vol. 285, Information Handling in Astronomy - Historical Vistas, ed. A. Heck , 109, 10.1007/0-306-48080-8_7
2003 doi
-
[18]
J., & Jarvis , M
G \"u rkan , G., Hardcastle , M. J., & Jarvis , M. J. 2014, , 438, 1149, 10.1093/mnras/stt2264
2014 doi
-
[19]
J., Drury , J
Hancock , P. J., Drury , J. A., Bell , M. E., Murphy , T., & Gaensler , B. M. 2016, , 461, 3314, 10.1093/mnras/stw1486
2016 doi
-
[20]
Hern \'a n-Caballero , A., Willmer , C. N. A., Varela , J., et al. 2023, , 671, A71, 10.1051/0004-6361/202244759
2023 doi
-
[21]
2017, , 607, A132, 10.1051/0004-6361/201731163
Herrera Ruiz , N., Middelberg , E., Deller , A., et al. 2017, , 607, A132, 10.1051/0004-6361/201731163
2017 doi
-
[22]
2018, , 616, A128, 10.1051/0004-6361/201832969
---. 2018, , 616, A128, 10.1051/0004-6361/201832969
2018 doi
-
[23]
F., Cox , T
Hopkins , P. F., Cox , T. J., Kere s , D., & Hernquist , L. 2008, , 175, 390, 10.1086/524363
2008 doi
-
[24]
R., et al
Hyun , M., Im , M., Smail , I. R., et al. 2023, , 264, 19, 10.3847/1538-4365/ac9bf4
2023 doi
-
[25]
Iyer , K., & Gawiser , E. J. 2017, in American Astronomical Society Meeting Abstracts, Vol. 229, American Astronomical Society Meeting Abstracts \#229, 347.22
2017
-
[26]
A., & Windhorst , R
Jansen , R. A., & Windhorst , R. A. 2018, , 130, 124001, 10.1088/1538-3873/aae476
2018 doi
-
[27]
H., Cluver , M
Jarrett , T. H., Cluver , M. E., Brown , M. J. I., et al. 2019, , 245, 25, 10.3847/1538-4365/ab521a
2019 doi
-
[28]
H., Cluver , M
Jarrett , T. H., Cluver , M. E., Magoulas , C., et al. 2017, , 836, 182, 10.3847/1538-4357/836/2/182
2017 doi
-
[29]
Kellermann , K. I. 1964, , 140, 969, 10.1086/147998
1964 doi
-
[30]
I., & Pauliny-Toth , I
Kellermann , K. I., & Pauliny-Toth , I. I. K. 1981, , 19, 373, 10.1146/annurev.aa.19.090181.002105
1981
-
[31]
J., Heisler , C
Kewley , L. J., Heisler , C. A., Dopita , M. A., et al. 2000, , 530, 704, 10.1086/308397
2000 doi
-
[32]
2001, , 322, 231, 10.1046/j.1365-8711.2001.04022.x
Kroupa , P. 2001, , 322, 231, 10.1046/j.1365-8711.2001.04022.x
2001
-
[33]
D., & Behar , E
Laor , A., Baldi , R. D., & Behar , E. 2019, , 482, 5513, 10.1093/mnras/sty3098
2019 doi
-
[34]
P., Ricci , C., T \"u rler , M., Dorner , D., & Walter , R
Lenain , J. P., Ricci , C., T \"u rler , M., Dorner , D., & Walter , R. 2010, , 524, A72, 10.1051/0004-6361/201015644
2010 doi
-
[35]
2014, , 52, 415, 10.1146/annurev-astro-081811-125615
Madau , P., & Dickinson , M. 2014, , 52, 415, 10.1146/annurev-astro-081811-125615
2014 doi
-
[36]
2018, , 473, 2493, 10.1093/mnras/stx2424
Magliocchetti , M., Popesso , P., Brusa , M., & Salvato , M. 2018, , 473, 2493, 10.1093/mnras/stx2424
2018 doi
-
[37]
P., Giovannini , G., & Spitler , L
Maini , A., Prandoni , I., Norris , R. P., Giovannini , G., & Spitler , L. R. 2016, , 589, L3, 10.1051/0004-6361/201628305
2016 doi
-
[38]
J., & Bonfield , D
McAlpine , K., Jarvis , M. J., & Bonfield , D. G. 2013, , 436, 1084, 10.1093/mnras/stt1638
2013 doi
-
[39]
T., Norris , R
Middelberg , E., Deller , A. T., Norris , R. P., et al. 2013, , 551, A97, 10.1051/0004-6361/201220374
2013 doi
-
[40]
P., Hallinan , G., Bourke , S., et al
Mooley , K. P., Hallinan , G., Bourke , S., et al. 2016, , 818, 105, 10.3847/0004-637X/818/2/105
2016 doi
-
[41]
J., Radcliffe , J
Njeri , A., Beswick , R. J., Radcliffe , J. F., et al. 2023, , 519, 1732, 10.1093/mnras/stac3569
2023 doi
-
[42]
A., Grogin , N
O'Brien , R., Jansen , R. A., Grogin , N. A., et al. 2024, , 272, 19, 10.3847/1538-4365/ad3948
2024 doi
-
[43]
A., Cohen , S
Ortiz , R., Windhorst , R. A., Cohen , S. H., et al. 2024, , 974, 258, 10.3847/1538-4357/ad6d5e
2024 doi
-
[44]
Pacholczyk , A. G. 1970, Radio astrophysics. Nonthermal processes in galactic and extragalactic sources
1970
-
[45]
2016, , 24, 13, 10.1007/s00159-016-0098-6
Padovani , P. 2016, , 24, 13, 10.1007/s00159-016-0098-6
2016 doi
-
[46]
2017, Nature Astronomy, 1, 0194, 10.1038/s41550-017-0194
---. 2017, Nature Astronomy, 1, 0194, 10.1038/s41550-017-0194
2017 doi
-
[47]
D., Laor , A., et al
Panessa , F., Baldi , R. D., Laor , A., et al. 2019, Nature Astronomy, 3, 387, 10.1038/s41550-019-0765-4
2019 doi
-
[48]
P., Spoon , H
P \'e rez-Beaupuits , J. P., Spoon , H. W. W., Spaans , M., & Smith , J. D. 2011, , 533, A56, 10.1051/0004-6361/201117153
2011 doi
-
[49]
2020, , 641, A6, 10.1051/0004-6361/201833910
Planck Collaboration , Aghanim , N., Akrami , Y., et al. 2020, , 641, A6, 10.1051/0004-6361/201833910
2020 doi
-
[50]
F., Beswick , R
Radcliffe , J. F., Beswick , R. J., Thomson , A. P., et al. 2019, , 490, 4024, 10.1093/mnras/stz2748
2019 doi
-
[51]
F., Garrett , M
Radcliffe , J. F., Garrett , M. A., Muxlow , T. W. B., et al. 2018, , 619, A48, 10.1051/0004-6361/201833399
2018 doi
-
[52]
L., et al
Saikia , P., K \"o rding , E., Coppejans , D. L., et al. 2018, , 616, A152, 10.1051/0004-6361/201833233
2018 doi
-
[53]
2015, in Advancing Astrophysics with the Square Kilometre Array (AASKA14), 69
Smolcic , V., Padovani , P., Delhaize , J., et al. 2015, in Advancing Astrophysics with the Square Kilometre Array (AASKA14), 69. 1501.04820
2015 arXiv
-
[54]
J., Benford , D
Stern , D., Assef , R. J., Benford , D. J., et al. 2012, , 753, 30, 10.1088/0004-637X/753/1/30
2012 doi
-
[55]
Walker , R. C. 2014, Flux Density Calibration on the VLBA , NRAO. http://library.nrao.edu/public/memos/vlba/sci/VLBAS_37.pdf
2014
-
[56]
Willmer , C. N. A., Ly , C., Kikuta , S., et al. 2023, , 269, 21, 10.3847/1538-4365/acf57d
2023 doi
-
[57]
P., Gim , H
Willner , S. P., Gim , H. B., Polletta , M. d. C., et al. 2023, , 958, 176, 10.3847/1538-4357/acfdfb
2023 doi
-
[58]
L., Eisenhardt , P
Wright , E. L., Eisenhardt , P. R. M., Mainzer , A. K., et al. 2010, , 140, 1868, 10.1088/0004-6256/140/6/1868
2010 doi
- [59]
-
[60]
Zhao , X., Civano , F., Willmer , C. N. A., et al. 2024, , 965, 188, 10.3847/1538-4357/ad2b61
2024 doi
Reviewed August 15, 2026 · model on record in the stance chip above.
Discussion (0). Continue with ORCID to comment.