Spatial equity and decentralization trade-offs in deep decarbonization of the European power system
Pith reviewed 2026-06-28 23:54 UTC · model grok-4.3
The pith
Moderate decentralization at K=7 captures 76 percent of equity benefits at a 9 percent cost increase over full centralization.
A machine-rendered reading of the paper's core claim, the machinery that carries it, and where it could break.
Core claim
By embedding the novel K-parameter constraint in the PyPSA-EUR-based model, moderate decentralization levels deliver the bulk of spatial equity improvements in renewable siting during deep decarbonization while keeping the cost penalty small.
What carries the argument
The K-parameter: a linear load-weighted renewable capacity constraint applied per region that scales with total system renewable capacity.
If this is right
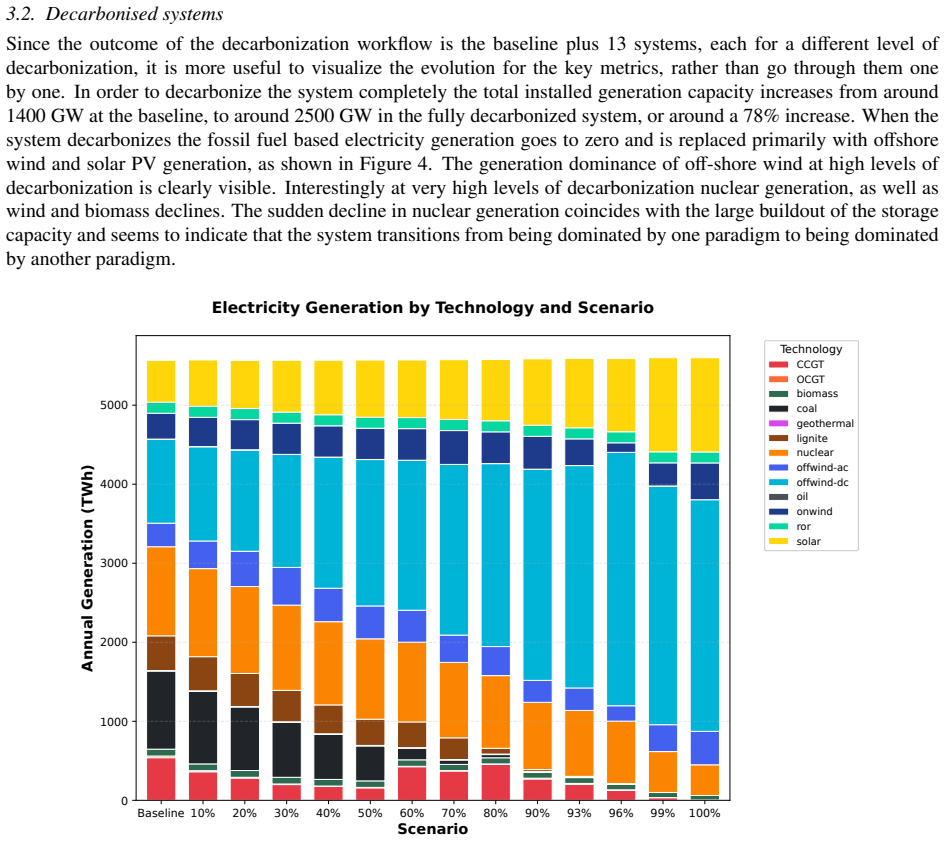
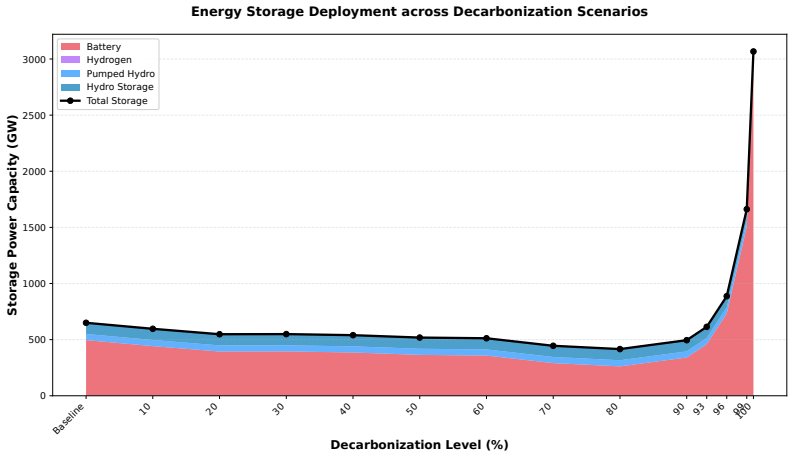
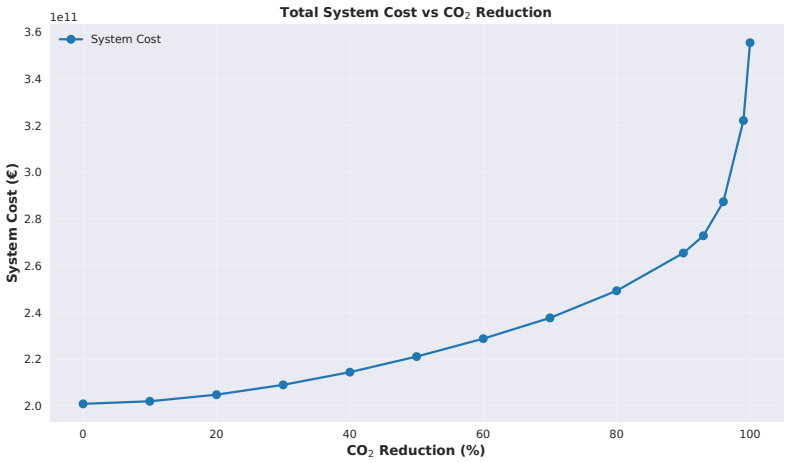
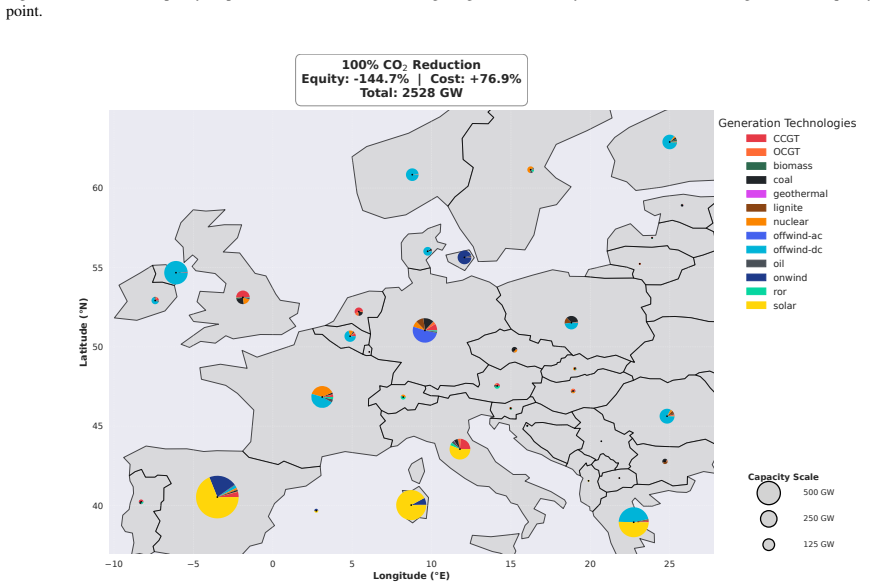
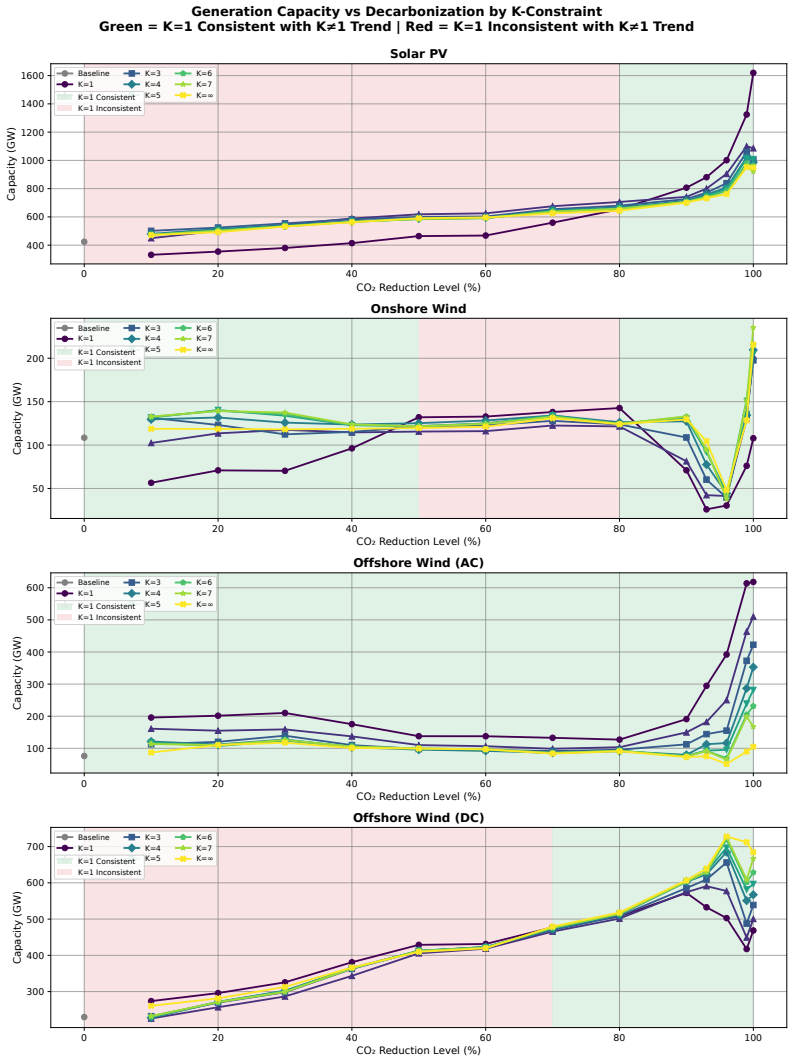
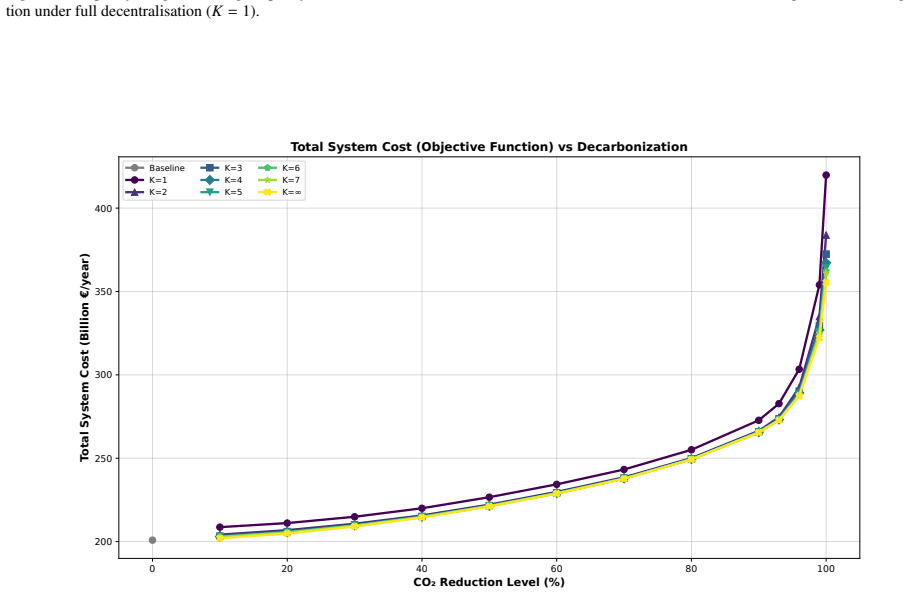
- Full decarbonization raises total system costs by 80 percent and requires 78 percent more generation capacity.
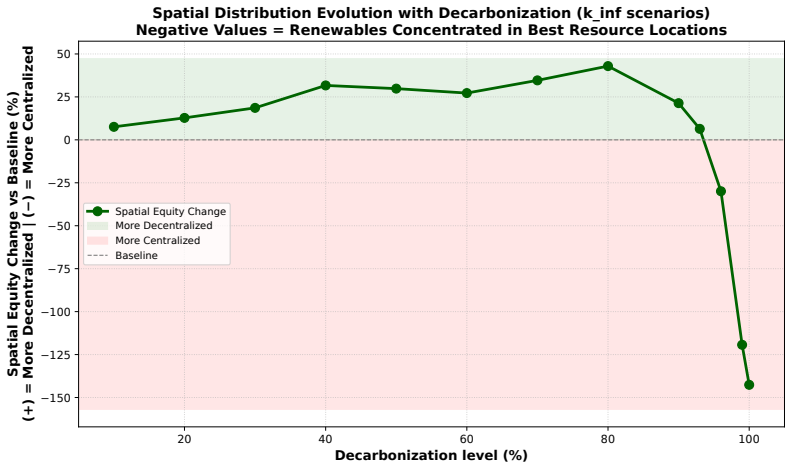
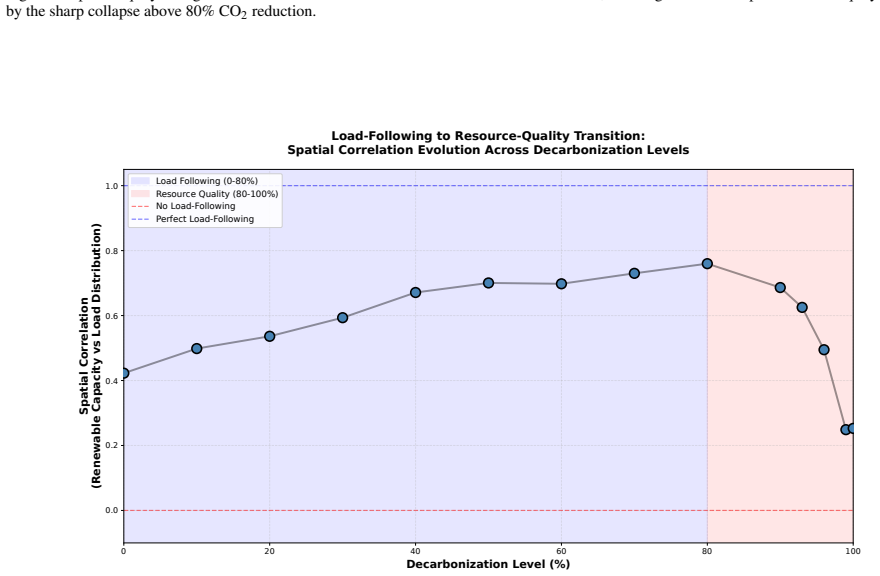
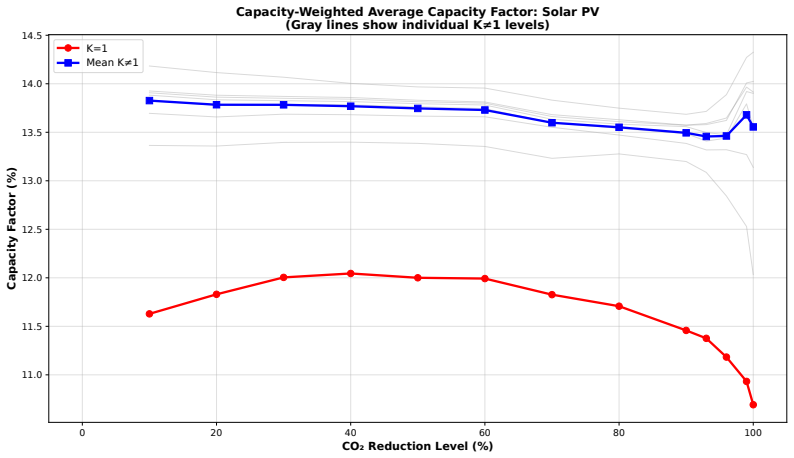
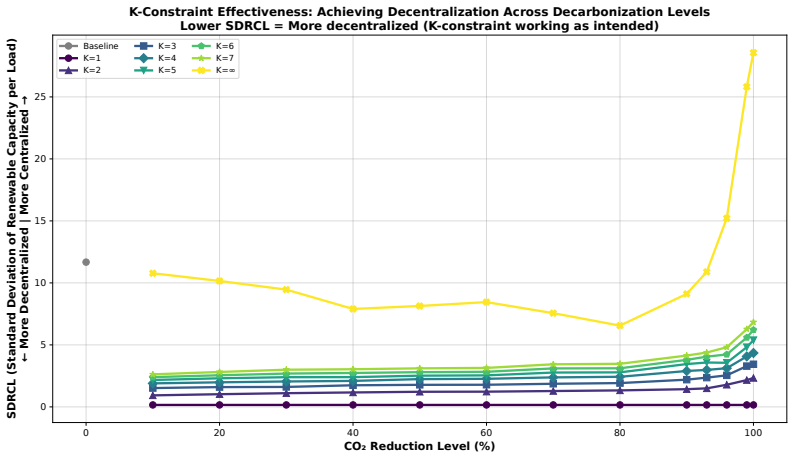
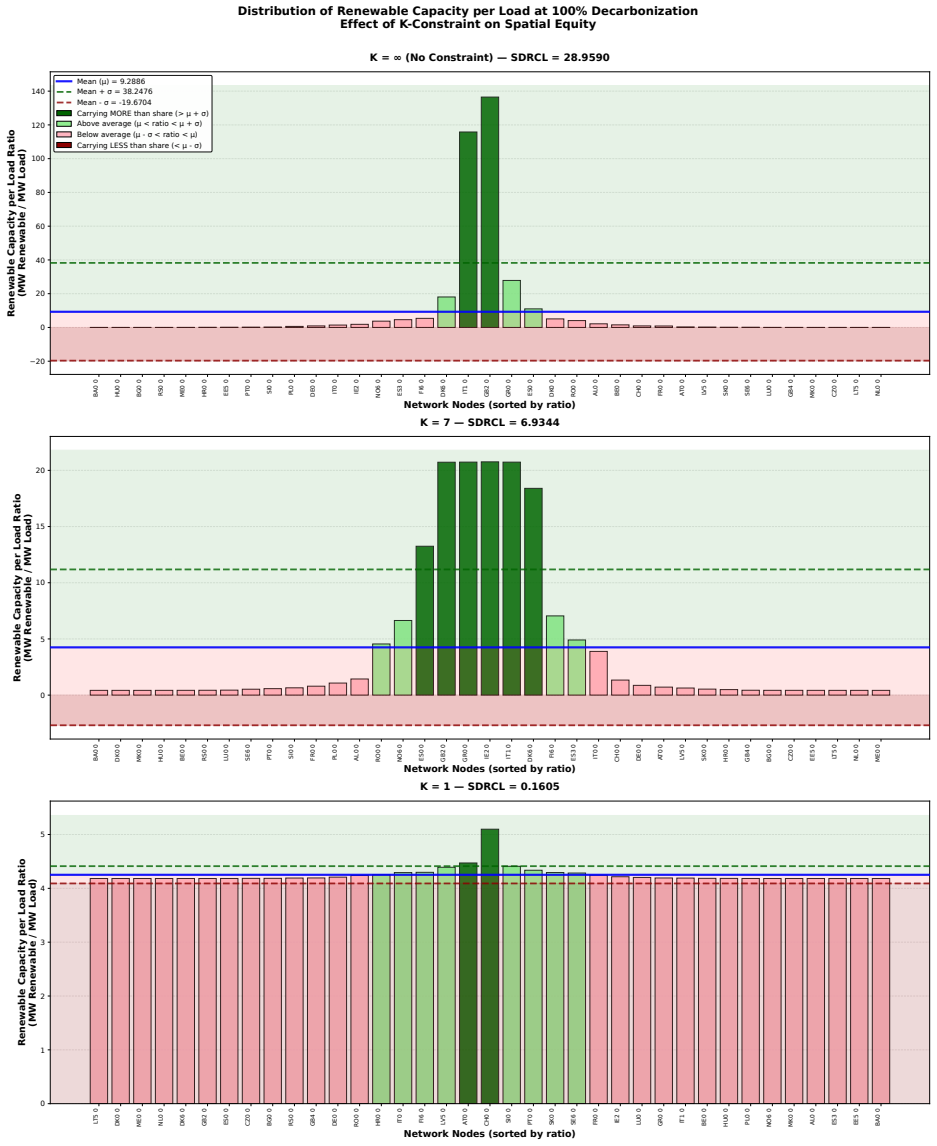
- Equity gains from renewables reverse at high decarbonization levels when capacity concentrates in the best resource regions.
- Moderate decentralization levels achieve most equity improvements without large cost penalties.
- The constraint can be added without altering the overall decarbonization trajectory.
Where Pith is reading between the lines
- National or EU planners could translate the K-parameter into siting rules or subsidy multipliers that favor load-proportional renewable placement.
- The same scaling approach could be tested on models that include transmission expansion or sector coupling to check robustness.
- Empirical calibration of K against actual political or security-driven decentralization targets would tighten the link between model and policy.
Load-bearing premise
The simple linear load-weighted K constraint correctly represents real-world decentralization preferences and does not interfere with decarbonization targets.
What would settle it
Compare modeled regional renewable capacity shares under different K values against observed deployment patterns or stated regional policy preferences in Europe.
Figures
read the original abstract
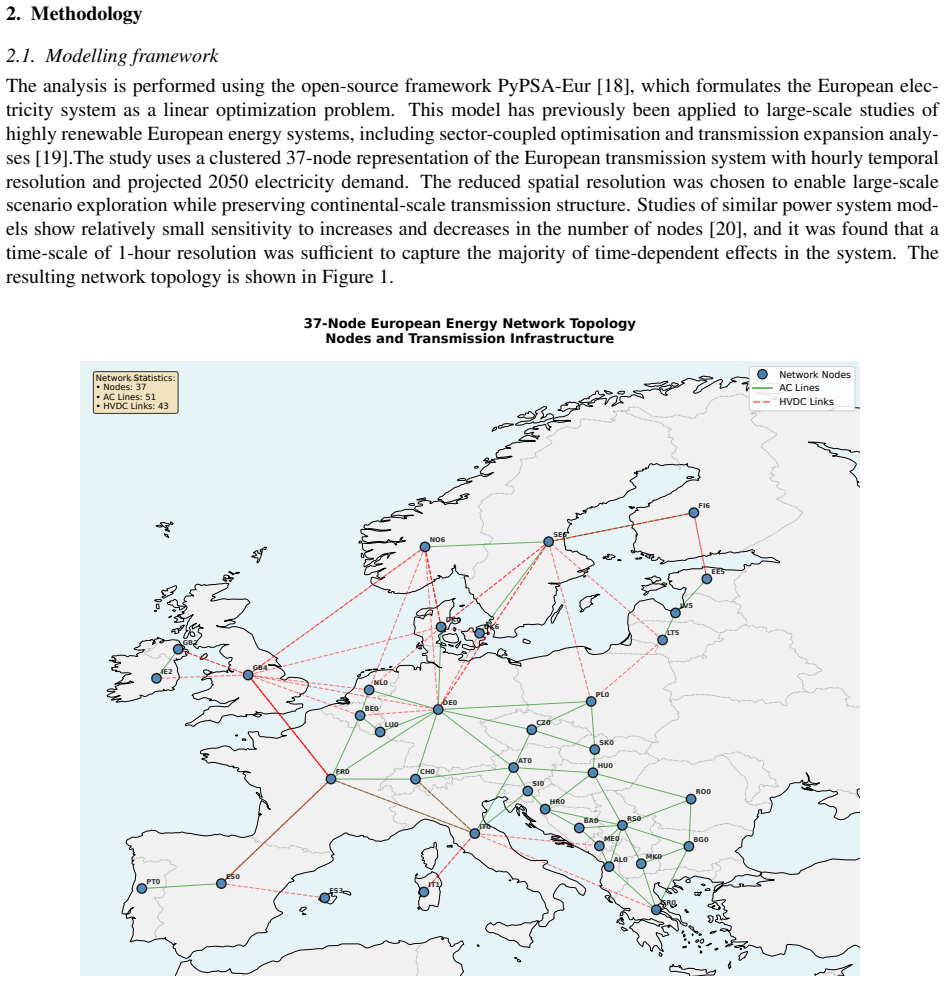
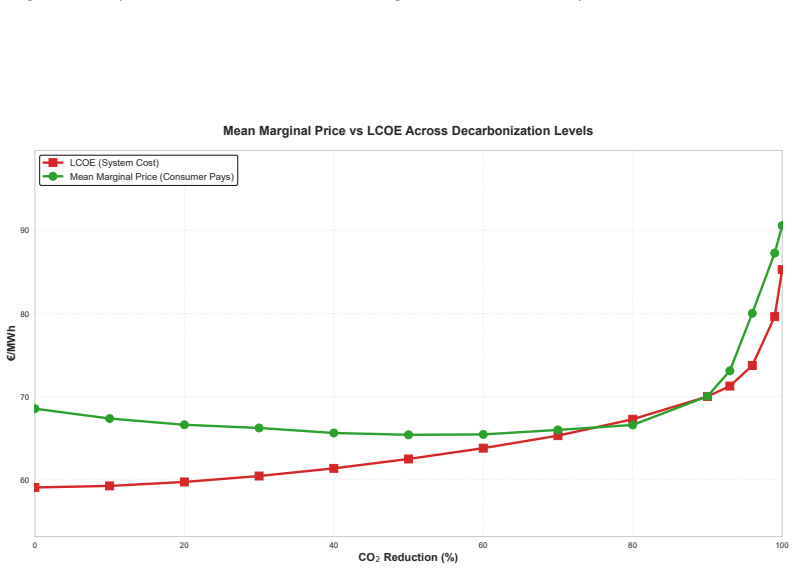
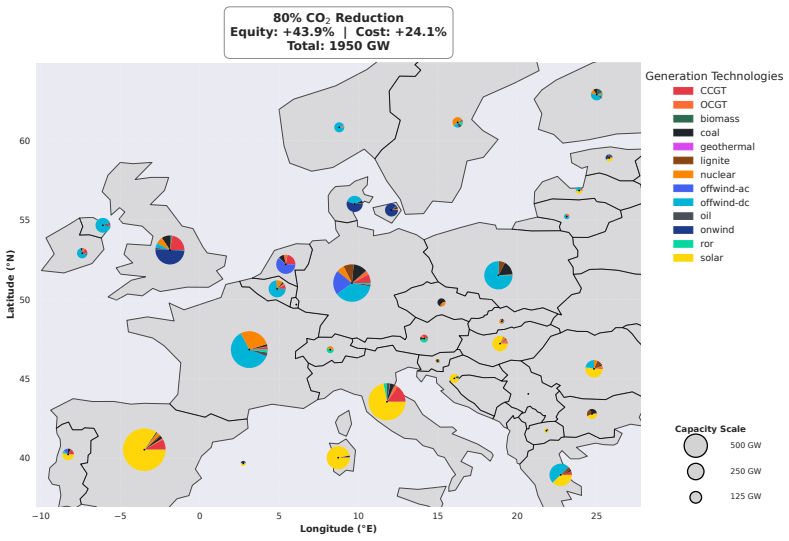
Standard EU energy system modelling approaches optimize for least-cost, leading to highly centralized systems, in conflict with political feasibility and physical security concerns. This paper incorporates decentralisation as a constraint in a European energy system model using a novel, linear load-weighted renewable capacity constraint, the K-parameter, which scales with total system renewable capacity to avoid interference with decarbonisation targets. The model is a 37-node electricity-only brownfield system based on the PyPSA-EUR framework, with projected 2050 loads and technology costs. A total of 105 optimized scenarios are analyzed at 14 levels of decarbonization and 8 levels of decentralization. Full decarbonization leads to an 80% cost increase due to, among other factors, a 78% increase in energy generation capacity. Without decentralisation constraints, system equity initially improves but collapses at high decarbonisation levels due to concentration in regions with optimal renewable resources. Moderate decentralization of K=7 achieves 76% of the equity benefits at only a 9% cost increase compared to K=1. This indicates that moderate decentralization can be a viable strategy to balance societal preferences and cost-efficiency in the European energy transition.
Editorial analysis
A structured set of objections, weighed in public.
Referee Report
Summary. The paper claims that a novel load-weighted K-parameter constraint for decentralization, implemented in a 37-node PyPSA-EUR electricity model with 2050 projections, enables analysis of 105 scenarios across 14 decarbonization levels and 8 decentralization levels. Full decarbonization raises system costs by 80% (driven partly by 78% higher generation capacity), while without decentralization constraints equity improves initially but collapses at high decarbonization due to resource concentration. Moderate decentralization at K=7 captures 76% of the equity gains of stronger constraints at only a 9% cost increase relative to K=1, suggesting moderate decentralization as a viable policy compromise.
Significance. If the non-interference assumption holds, the work offers a systematic, quantitative mapping of cost-equity trade-offs in European decarbonization that could inform policy on balancing least-cost optimization with political and security preferences for decentralization. The breadth of 105 scenarios across two dimensions is a clear strength, enabling direct comparison of pathways rather than isolated cases.
major comments (3)
- [Abstract and Methods] Abstract and Methods (constraint definition): The claim that the K-parameter 'scales with total system renewable capacity to avoid interference with decarbonisation targets' is load-bearing for attributing the 9% cost increase solely to decentralization preferences. No explicit verification (e.g., table or figure of total renewable capacity or achieved decarbonization level vs. K at fixed decarbonization targets) is referenced; a natural linear implementation capacity_i ≤ K × (load_i / total_load) × total_renewable_capacity could still force suboptimal siting and higher total capacity, so the central trade-off (76% equity at 9% cost) requires this check to be demonstrated.
- [Results] Results (equity and cost metrics): The reported 76% equity benefit and 9% cost penalty for K=7 vs. K=1 are presented without sensitivity to cost assumptions or load projections. Given that all results derive from external 2050 projections rather than being defined internally by K, the quantitative trade-off is not robust unless at least one sensitivity table (varying key costs or loads) is added to confirm the percentages are not artifacts of the base assumptions.
- [Methods] Methods (scenario design): The selection of 14 decarbonization and 8 decentralization levels appears post-hoc with no pre-specified criteria or validation against historical dispatch or capacity factors. This weakens confidence that the collapse in equity at high decarbonization (without K constraints) and the K=7 compromise are general rather than specific to the chosen grid.
minor comments (2)
- [Abstract] The abstract states '105 optimized scenarios' but does not clarify the exact distribution across the 14 × 8 grid or whether all combinations were solved to convergence.
- Notation for the equity metric (used to compute the 76% figure) should be defined explicitly with its formula in the main text rather than assumed from context.
Simulated Author's Rebuttal
We thank the referee for the constructive and detailed comments, which help clarify the robustness of our findings on decentralization-equity trade-offs. We respond to each major comment below, indicating planned revisions where appropriate.
read point-by-point responses
-
Referee: [Abstract and Methods] Abstract and Methods (constraint definition): The claim that the K-parameter 'scales with total system renewable capacity to avoid interference with decarbonisation targets' is load-bearing for attributing the 9% cost increase solely to decentralization preferences. No explicit verification (e.g., table or figure of total renewable capacity or achieved decarbonization level vs. K at fixed decarbonization targets) is referenced; a natural linear implementation capacity_i ≤ K × (load_i / total_load) × total_renewable_capacity could still force suboptimal siting and higher total capacity, so the central trade-off (76% equity at 9% cost) requires this check to be demonstrated.
Authors: We agree that empirical verification is necessary to substantiate the non-interference claim and support attribution of the cost increase to the decentralization constraint alone. Although the formulation uses the optimized total renewable capacity as the scaling factor (ensuring the constraint is proportional rather than absolute), we will add a supplementary table in the revised manuscript reporting achieved decarbonization levels and total renewable capacities across K values at each fixed target. This will demonstrate whether any deviation occurs. revision: yes
-
Referee: [Results] Results (equity and cost metrics): The reported 76% equity benefit and 9% cost penalty for K=7 vs. K=1 are presented without sensitivity to cost assumptions or load projections. Given that all results derive from external 2050 projections rather than being defined internally by K, the quantitative trade-off is not robust unless at least one sensitivity table (varying key costs or loads) is added to confirm the percentages are not artifacts of the base assumptions.
Authors: We recognize that the specific percentages depend on the chosen 2050 projections. In the revision we will include a sensitivity table (or figure) varying key inputs such as renewable capital costs (±20%) and load growth assumptions, recomputing the equity and cost metrics for the K=7 case relative to K=1 to test whether the 76% and 9% values remain qualitatively stable. revision: yes
-
Referee: [Methods] Methods (scenario design): The selection of 14 decarbonization and 8 decentralization levels appears post-hoc with no pre-specified criteria or validation against historical dispatch or capacity factors. This weakens confidence that the collapse in equity at high decarbonization (without K constraints) and the K=7 compromise are general rather than specific to the chosen grid.
Authors: The discretization was selected to provide even coverage across the full range of both parameters, revealing the non-monotonic equity behavior and the point of diminishing returns at moderate K. We will expand the Methods section to document this rationale explicitly and to describe how the levels were spaced. Direct validation against historical dispatch is not feasible given the brownfield 2050 setup with projected loads and costs; we will instead note the model's consistency with current installed capacities where applicable. revision: partial
Circularity Check
No significant circularity; central results are optimization outputs on external inputs
full rationale
The paper's derivation consists of running the PyPSA-EUR optimization model on projected 2050 loads and technology costs, with the K-parameter added as an exogenous linear constraint. Equity and cost metrics are computed after optimization from the resulting capacity allocations across 105 scenarios. No equation or claim reduces a reported prediction (such as the 76% equity / 9% cost trade-off) to a fitted parameter or self-citation by construction. The scaling property of K is presented as a modeling assumption to decouple from decarbonization targets, but this does not create a definitional loop. The chain remains self-contained against external data and the open-source framework.
Axiom & Free-Parameter Ledger
free parameters (1)
- K values
axioms (2)
- domain assumption Projected 2050 electricity loads and technology costs are taken as given inputs.
- domain assumption The 37-node spatial resolution and electricity-only scope are sufficient to capture spatial equity effects.
invented entities (1)
-
K-parameter
no independent evidence
Reference graph
Works this paper leans on
-
[1]
UNFCCC, The Paris agreement,https://unfccc.int/process-and-meetings/the-paris-agreement (2015)
2015
-
[2]
R. A. Rodriguez, S. Becker, M. Greiner, Cost-optimal design of a simplified, highly renewable pan-European electricity system, Energy 83 (2015) 658–668.doi:10.1016/j.energy.2015.02.066
-
[3]
S. Pfenninger, A. Hawkes, J. Keirstead, Energy systems modeling for twenty-first century energy challenges, Renewable and Sustainable Energy Reviews 33 (2014) 74–86.doi:10.1016/j.rser.2014.02.003
-
[4]
Henke, M
H. Henke, M. Dekker, F. Lombardi, et al., Comparing energy system optimization models and integrated as- sessment models: Relevance for energy policy advice, Open Research Europe 3 (2022) 69.doi:10.12688/ openreseurope.15590.2
2022
-
[5]
M. O. Dioha, M. Montgomery, R. Almada, P. Dato, L. Abrahams, Beyond dollars and cents: why socio-political factors matter in energy system modeling, Environmental Research Letters 18 (12) (2023) 121002
2023
-
[6]
E. H. Eriksen, L. J. Schwenk-Nebbe, B. Tranberg, T. Brown, M. Greiner, Optimal heterogeneity in a simplified highly renewable European electricity system, Energy 133 (2017) 913–928.doi:10.1016/j.energy.2017. 05.170
-
[7]
Neumann, Costs of regional equity and autarky in a renewable european power system, Energy strategy reviews 35 (2021) 100652
F. Neumann, Costs of regional equity and autarky in a renewable european power system, Energy strategy reviews 35 (2021) 100652. 17
2021
-
[8]
Kendziorski, L
M. Kendziorski, L. Göke, C. von Hirschhausen, C. Kemfert, P.-Y . Oei, Centralized and decentral approaches to succeed the 100% energiewende in germany in the european context – a model-based analysis of generation, network, and storage expansion, Energy Policy 165 (2022) 112947
2022
-
[9]
Cherp, J
A. Cherp, J. Jewell, The three perspectives on energy security: intellectual history, disciplinary roots and the potential for integration, Current opinion in environmental sustainability 3 (4) (2011) 202–212
2011
-
[10]
IISS, The scale of Russian sabotage operations against Europe’s critical infrastructure,https: //www.iiss.org/research-paper/2025/08/the-scale-of-russian-sabotage-operations- against-europes-critical-infrastructure/(2025)
2025
-
[11]
Heleno, B
M. Heleno, B. Sigrin, N. Popovich, J. Heeter, A. J. Figueroa, M. Reiner, T. Reames, Optimizing equity in energy policy interventions: A quantitative decision-support framework for energy justice, Applied Energy 325 (2022) 119771
2022
-
[12]
Vågerö, M
O. Vågerö, M. Zeyringer, Can we optimise for justice? reviewing the inclusion of energy justice in energy system optimisation models, Energy Research & Social Science 95 (2023) 102913
2023
-
[13]
Goforth, T
T. Goforth, T. Levin, D. Nock, Incorporating energy justice and equity objectives in power system models, Renewable and Sustainable Energy Reviews 210 (2025) 115155
2025
-
[14]
M. A. Rios-Ocampo, J. C. Romero, E. Centeno, S. Mora, A just energy transition is not just a transition: Framing energy justice for a quantitative assessment, Energy Research & Social Science 119 (2025) 103900
2025
-
[15]
K. E. Lonergan, N. Suter, G. Sansavini, Energy systems modelling for just transitions, Energy Policy 183 (2023) 113791
2023
-
[16]
Vågerö, T
O. Vågerö, T. H. Jackson Inderberg, M. Zeyringer, The effects of fair allocation principles on energy system model designs, Environmental Research: Energy 1 (4) (2024) 045011
2024
-
[17]
Lehmann, E
P. Lehmann, E. Gawel, J.-N. Meier, M. J. Reda, F. Reutter, S. Sommer, Spatial distributive justice has many faces: The case of siting renewable energy infrastructures, Energy Research & Social Science 118 (2024) 103769
2024
-
[18]
J. Hörsch, F. Neumann, F. Hofmann, D. Schlachtberger, et al., PyPSA-Eur: An open optimisation model of the European transmission system (dataset), Zenodo (2023).doi:10.5281/zenodo.7646728
-
[19]
Brown, D
T. Brown, D. Schlachtberger, A. Kies, S. Schramm, M. Greiner, Synergies of sector coupling and transmission reinforcement in a cost-optimised, highly renewable european energy system, Energy 160 (2018) 720–739
2018
-
[20]
B. U. Schyska, A. Kies, M. Schlott, L. von Bremen, W. Medjroubi, The sensitivity of power system expansion models, Joule 5 (10) (2021) 2606–2624.doi:10.1016/j.joule.2021.07.017
-
[21]
ENTSO-E, Transparency platform,https://transparency.entsoe.eu(2023)
2023
-
[22]
Carbon Free Europe, Carbon free Europe,https://www.carbonfreeeurope.org(2023)
2023
-
[23]
Danish Energy Agency, Technology data for generation of electricity and district heating,https: //ens.dk/en/analyses-and-statistics/technology-data-generation-electricity-and- district-heating(2023)
2023
-
[24]
Appendix A
IEA, The future of geothermal energy,https://www.iea.org/reports/the-future-of-geothermal- energy(2023). Appendix A. Technology cost assumptions Detailed techno-economic assumptions used in the optimisation model are shown in Tables A.2 and A.3. 18 Table A.2: Cost assumptions for generation technologies [23, 24]. Lignite is proxied with coal CAPEX. FOM re...
2023
discussion (0)
Sign in with ORCID, Apple, or X to comment. Anyone can read and Pith papers without signing in.