HST observations of chromospheric UV lines in the AGB star R Leo
Pith reviewed 2026-06-27 20:46 UTC · model grok-4.3
The pith
Pulsation-driven shocks shape the UV chromospheric emission lines in the Mira star R Leo.
A machine-rendered reading of the paper's core claim, the machinery that carries it, and where it could break.
Core claim
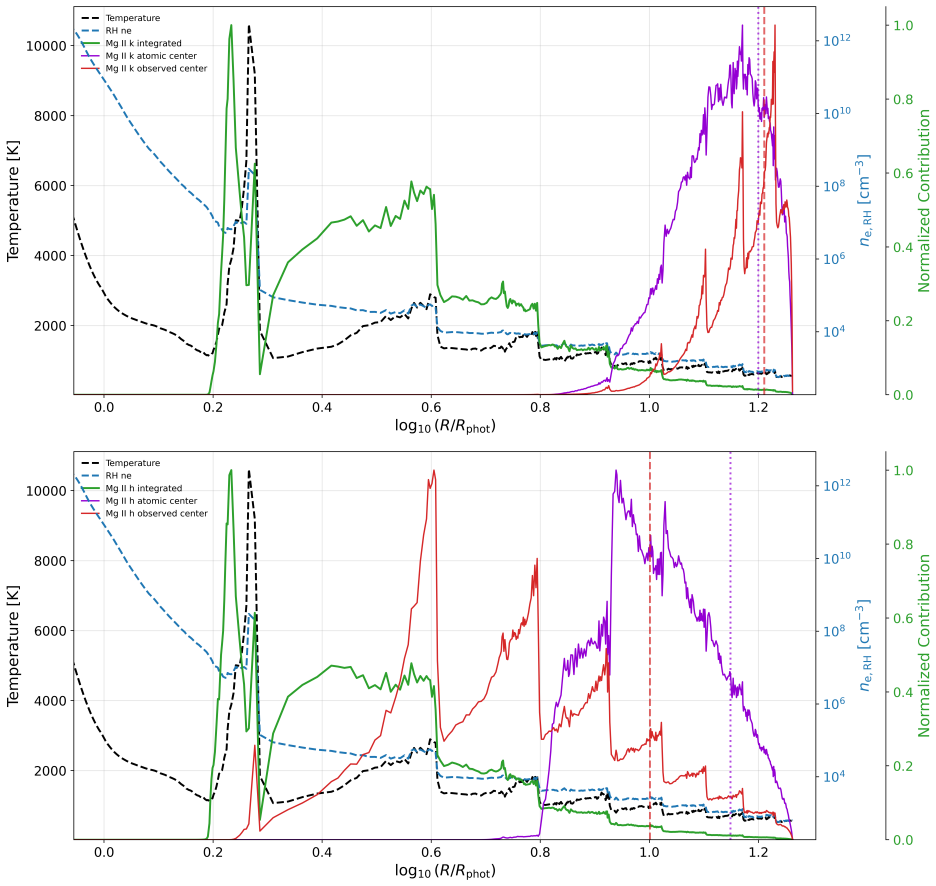
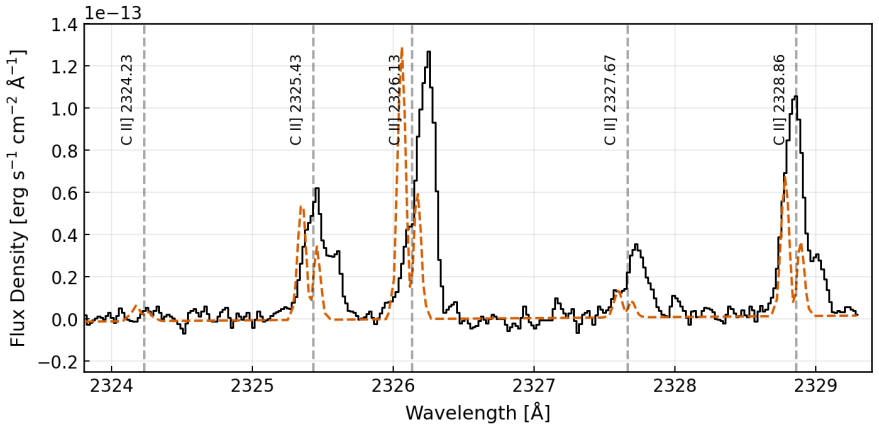
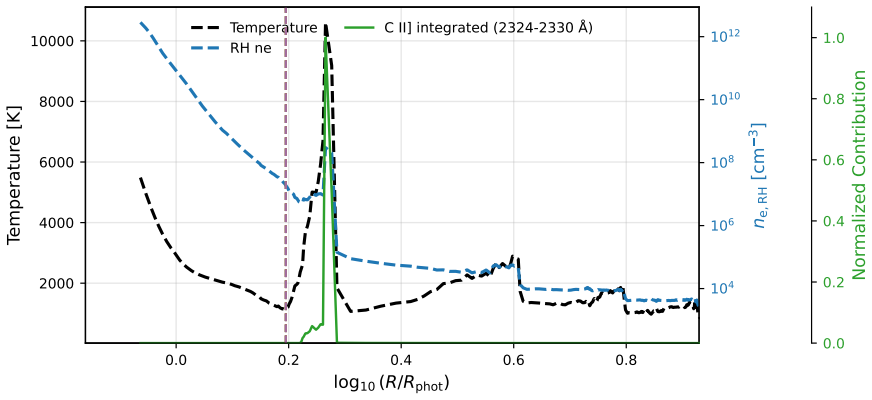
The compact C II] formation region at the first temperature peak near 1.8 R_phot, the extended Mg II contribution functions out to 16 R_phot, and the strong phase dependence of the synthetic Mg II profiles together indicate that pulsation-driven shocks shape the ultraviolet chromospheric emission lines in Mira variable stars.
What carries the argument
NLTE radiative-transfer calculations with the RH code applied to phase-dependent hydrodynamic atmospheric structures that include pulsation-driven shocks; these calculations produce contribution functions that localize C II] emission to a compact shock-heated shell while spreading Mg II formation over a larger radial domain.
If this is right
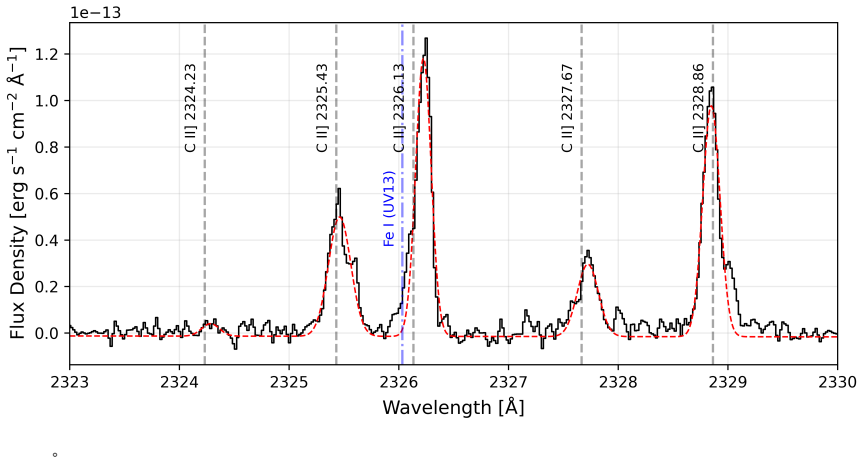
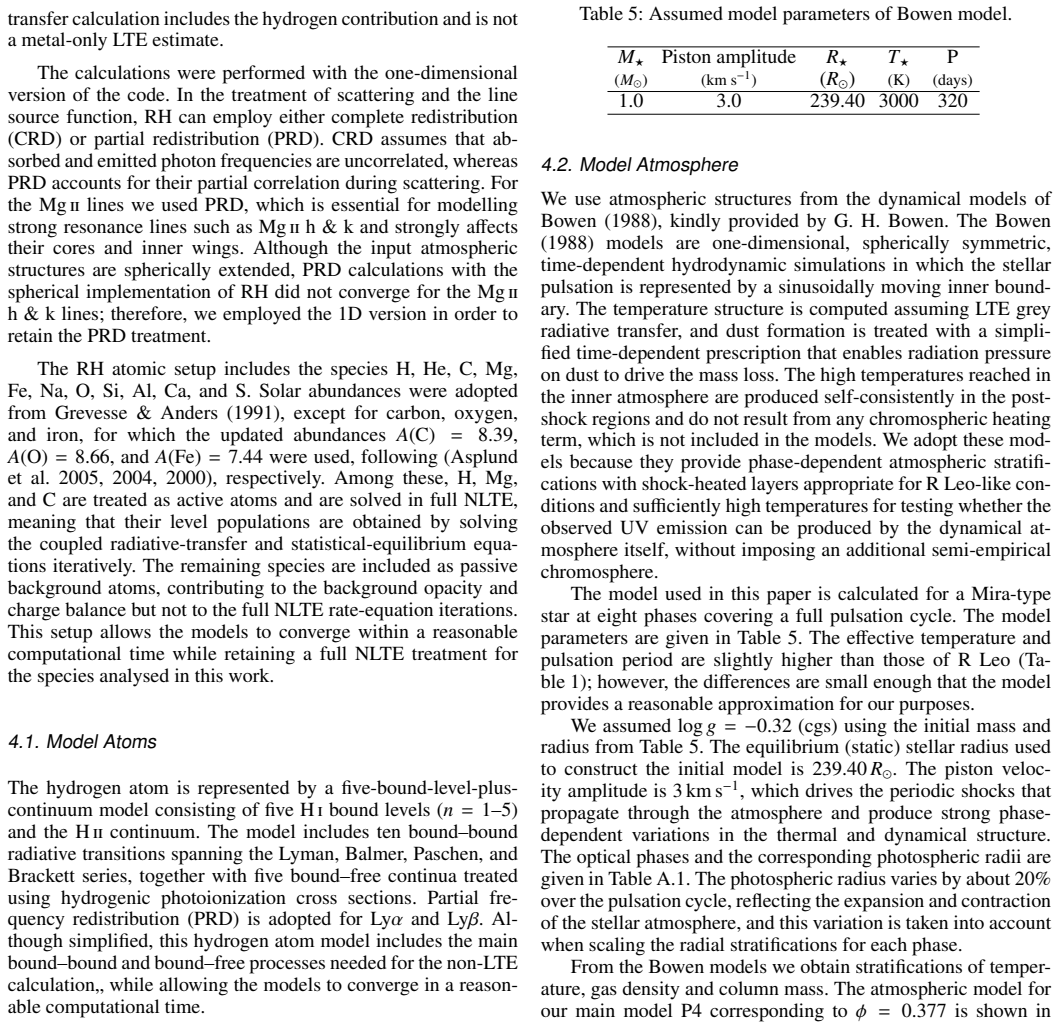
- The C II] multiplet ratios indicate an electron density of order 10^9 cm^{-3} in the formation region.
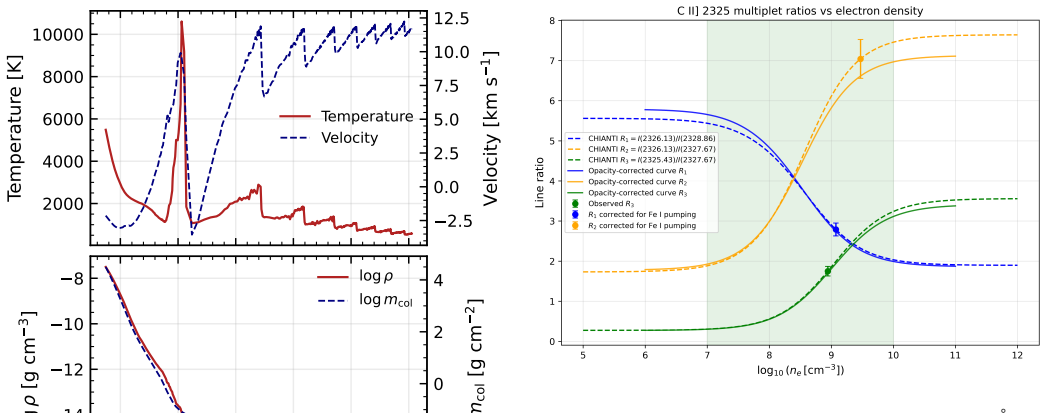
- The Mg II h line is reproduced more reliably than the k line because the latter suffers stronger circumstellar and interstellar absorption.
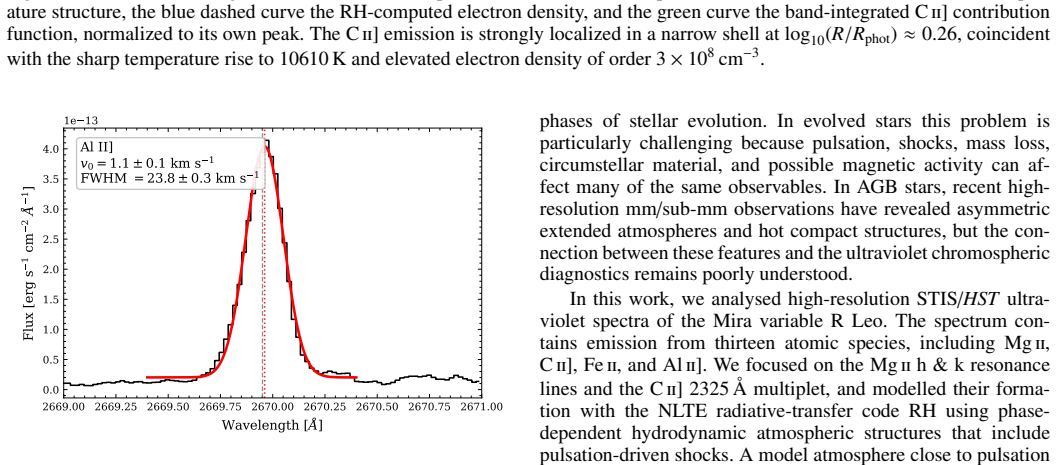
- The semi-forbidden Al II] line at 2669 Å shows a blueshift of about 6 km s^{-1} consistent with shock-related motions.
- Chromospheric diagnostics in Mira stars probe distinct radial zones shaped by the same pulsation-driven shocks.
Where Pith is reading between the lines
- If shocks dominate the chromosphere, mass-loss rates in AGB stars may be tied more directly to pulsation amplitude than to steady-state heating.
- Similar modeling applied to other Mira variables could test whether the compact C II] shell is a universal feature at the first temperature peak.
- The extended Mg II formation region implies that UV observations can constrain atmospheric structure well beyond the photosphere in pulsating stars.
Load-bearing premise
The phase-dependent hydrodynamic atmospheric structures that include pulsation-driven shocks accurately represent the physical conditions and velocity fields in R Leo's atmosphere.
What would settle it
A mismatch between the observed Mg II line profiles at multiple pulsation phases and the synthetic profiles computed from the shock-inclusive models, or an observed C II] formation region that is not localized near 1.8 R_phot.
Figures
read the original abstract
The role of stellar chromospheres in the chemistry, mass loss, and evolution of cool evolved stars remains poorly understood. We present high-resolution ultraviolet spectra of the nearby Mira-type AGB star R~Leo obtained with STIS on board the \textit{Hubble Space Telescope}. We focus on two strong chromospheric diagnostics, the Mg\,\textsc{ii} h \& k resonance lines and the C\,\textsc{ii}] 2325\,\AA\ multiplet, and model their formation with the NLTE radiative-transfer code RH using phase-dependent hydrodynamic atmospheric structures that include pulsation-driven shocks. The observed C\,\textsc{ii}] multiplet ratios imply an electron density of order $10^9\,\mathrm{cm^{-3}}$. The RH contribution functions show that the C\,\textsc{ii}] emission is strongly localized in a compact shock-heated shell at the first temperature peak of the model atmosphere, near $R\simeq1.8~R_{\rm phot}$, where $T\sim10^4$\,K and the local electron density is a few $10^8\,\mathrm{cm^{-3}}$. In contrast, the Mg\,\textsc{ii} h \& k lines probe a more extended region ($R< 16~R_{\rm phot}$), with the line cores forming at greater radial distances than the wings. The Mg\,\textsc{ii} h line is reproduced more reliably than the k line, which is more strongly affected by circumstellar and interstellar absorption. As an additional low-opacity kinematic check, the semi-forbidden Al\,\textsc{ii}] $\lambda2669$ line shows a projected stellar-rest-frame blueshift of $\sim6~{\rm km~s^{-1}}$, consistent with shock-related motions expected in Mira atmospheres. Overall, the compact C\,\textsc{ii}] formation region, the extended Mg\,\textsc{ii} contribution functions, and the strong phase dependence of the synthetic Mg\,\textsc{ii} profiles support a picture in which pulsation-driven shocks shape the ultraviolet chromospheric emission lines in Mira variable stars.
Editorial analysis
A structured set of objections, weighed in public.
Referee Report
Summary. The paper presents HST/STIS high-resolution UV spectra of the Mira AGB star R Leo, focusing on the Mg II h&k resonance lines and C II] 2325 Å multiplet. These are modeled with the NLTE RH code applied to phase-dependent hydrodynamic atmospheric structures containing pulsation-driven shocks. The C II] ratios imply n_e ~10^9 cm^{-3}; contribution functions place C II] formation in a compact shell at ~1.8 R_phot (T~10^4 K, local n_e few×10^8 cm^{-3}), while Mg II forms over an extended region (R<16 R_phot) with phase-dependent profiles. An Al II] λ2669 blueshift of ~6 km s^{-1} is noted as a kinematic check. The results are interpreted as supporting pulsation-driven shocks as the shaper of UV chromospheric emission in Miras.
Significance. If the hydrodynamic input structures accurately capture R Leo's temperature, density, and velocity fields, the work supplies direct observational constraints on chromospheric line formation loci and their phase dependence in a Mira variable, using independent HST spectra and the established RH code. This could strengthen links between pulsation shocks, chromospheric structure, and mass-loss processes in AGB stars. The absence of quantitative fit statistics or alternative-structure tests leaves the anchoring of the central claim only partial.
major comments (3)
- [abstract and modeling description] Abstract and modeling description: the observed C II] multiplet ratios imply n_e of order 10^9 cm^{-3}, yet the model atmospheres supply only a few×10^8 cm^{-3} at the claimed formation shell; this mismatch is load-bearing for the compact-formation-region claim and is not reconciled or tested with alternative structures.
- [modeling section] Modeling section: the phase-dependent hydrodynamic structures (with shocks) are used as fixed input to RH without any description of their construction, parameter choices, or validation against the present UV spectra; the central mapping of observed ratios, contribution functions, and phase dependence onto a shock-driven picture therefore rests on an untested assumption.
- [results/discussion] Results/discussion: no quantitative fit statistics (χ², residual maps, or error budgets) or tests against alternative atmospheric structures are supplied for the synthetic Mg II and C II] profiles, so the claimed strong phase dependence and extended Mg II loci lack a clear statistical anchor.
minor comments (2)
- [abstract] The abstract states that the Mg II h line is reproduced more reliably than k without showing the actual profile comparisons or quantifying the difference.
- [discussion] The Al II] blueshift is presented as a consistency check, but its status as a single low-opacity datum is not discussed in relation to the full radial structure.
Simulated Author's Rebuttal
We thank the referee for the careful and constructive review. We address each major comment below and indicate where revisions will be incorporated.
read point-by-point responses
-
Referee: [abstract and modeling description] Abstract and modeling description: the observed C II] multiplet ratios imply n_e of order 10^9 cm^{-3}, yet the model atmospheres supply only a few×10^8 cm^{-3} at the claimed formation shell; this mismatch is load-bearing for the compact-formation-region claim and is not reconciled or tested with alternative structures.
Authors: The abstract already states both the density inferred from the observed ratios and the lower local density at the formation peak in the model. The line-ratio diagnostic yields a formation-weighted average, while the contribution functions localize the emission at the shock where the local value is lower. We will expand the modeling and results sections with additional discussion of this point, including the diagnostic's sensitivity to temperature and possible multi-component effects, to better reconcile the values. Full tests with alternative structures are not feasible here. revision: partial
-
Referee: [modeling section] Modeling section: the phase-dependent hydrodynamic structures (with shocks) are used as fixed input to RH without any description of their construction, parameter choices, or validation against the present UV spectra; the central mapping of observed ratios, contribution functions, and phase dependence onto a shock-driven picture therefore rests on an untested assumption.
Authors: The hydrodynamic models are taken from our prior work on R Leo (specific reference to be added). We will insert a new subsection describing their construction, pulsation parameters, shock treatment, and prior validation against optical/IR data. The present UV comparison constitutes the first direct test against these HST spectra; we will make this explicit. revision: yes
-
Referee: [results/discussion] Results/discussion: no quantitative fit statistics (χ², residual maps, or error budgets) or tests against alternative atmospheric structures are supplied for the synthetic Mg II and C II] profiles, so the claimed strong phase dependence and extended Mg II loci lack a clear statistical anchor.
Authors: We agree that quantitative measures would improve clarity. We will add a table of reduced χ² values and residual maps for the synthetic profiles. Tests with entirely different atmospheric structures would require new hydrodynamic calculations outside the scope of this paper; we will state this limitation explicitly in the discussion. revision: partial
- Provision of tests against alternative atmospheric structures, which would require new hydrodynamic modeling beyond the present study.
Circularity Check
No significant circularity; results rest on independent HST spectra and external RH modeling
full rationale
The derivation chain begins with direct HST/STIS spectra yielding observed line ratios, profiles, and the Al II] blueshift. These are interpreted by feeding pre-existing phase-dependent hydrodynamic structures (containing shocks) into the established external RH code to compute contribution functions and synthetic profiles. The structures are not described as fitted or optimized against the present UV data; the modeling is applied to interpret independent observations. No step reduces a claimed prediction to a fitted parameter by construction, invokes a self-citation as the sole justification for a uniqueness theorem, or renames an input as a derived result. The central picture of shock-shaped emission is therefore supported by external data and code rather than by internal redefinition.
Axiom & Free-Parameter Ledger
axioms (2)
- domain assumption NLTE radiative transfer in the RH code correctly captures line formation under the supplied atmospheric structures
- domain assumption The hydrodynamic models include realistic pulsation-driven shocks at the phases observed
Reference graph
Works this paper leans on
-
[1]
Andriantsaralaza, M., Ramstedt, S., Vlemmings, W. H. T., & De Beck, E. 2022, A&A, 667, A74
2022
-
[2]
J., Allende Prieto, C., & Blomme, R
Asplund, M., Grevesse, N., Sauval, A. J., Allende Prieto, C., & Blomme, R. 2005, A&A, 431, 693
2005
-
[3]
J., Allende Prieto, C., & Kiselman, D
Asplund, M., Grevesse, N., Sauval, A. J., Allende Prieto, C., & Kiselman, D. 2004, A&A, 417, 751
2004
-
[4]
Asplund, M., Nordlund, Å., Trampedach, R., & Stein, R. F. 2000, A&A, 359, 743
2000
-
[5]
Bidelman, W. P. & Pyper, D. M. 1963, PASP, 75, 389
1963
-
[6]
Boesgaard, A. M. & Boesgaard, H. 1976, ApJ, 205, 448
1976
-
[7]
A., Brugel, E
Bookbinder, J. A., Brugel, E. W., & Brown, A. 1989, ApJ, 342, 516
1989
-
[8]
Bowen, G. H. 1988, ApJ, 329, 299
1988
-
[9]
W., Willson, L
Brugel, E. W., Willson, L. A., & Cadmus, R. 1986, in ESA Special Publication, V ol. 263, New Insights in Astrophysics. Eight Years of UV Astronomy with IUE, ed. E. J. Rolfe & R. Wilson, 213
1986
-
[10]
G., Robinson, R
Carpenter, K. G., Robinson, R. D., Johnson, H. R., et al. 1997, ApJ, 486, 457
1997
-
[11]
K., Cristofari, P
Dupree, A. K., Cristofari, P. I., MacLeod, M., & Kravchenko, K. 2026, ApJ, 998, 50
2026
-
[12]
K., Hartmann, L., & Smith, G
Dupree, A. K., Hartmann, L., & Smith, G. H. 1990, ApJ, 353, 623
1990
-
[13]
K., Strassmeier, K
Dupree, A. K., Strassmeier, K. G., Matthews, L. D., et al. 2020, ApJ, 899, 68
2020
-
[14]
& Höfner, S
Freytag, B. & Höfner, S. 2023, A&A, 669, A155
2023
-
[15]
2017, A&A, 600, A137
Freytag, B., Liljegren, S., & Höfner, S. 2017, A&A, 600, A137
2017
-
[16]
& Crowe, R
Gillet, D. & Crowe, R. A. 1988, A&A, 199, 242
1988
-
[17]
Guerrero, M. A. & Ortiz, R. 2020, MNRAS, 491, 680
2020
-
[18]
Harper, G. M. & Brown, A. 2006, ApJ, 646, 1179
2006
-
[19]
1948, ApJ, 107, 94
Herzberg, G. 1948, ApJ, 107, 94
1948
-
[20]
H., Lebzelter, T., & Straniero, O
Hinkle, K. H., Lebzelter, T., & Straniero, O. 2016, ApJ, 825, 38
2016
-
[21]
H., Scharlach, W
Hinkle, K. H., Scharlach, W. W. G., & Hall, D. N. B. 1984, ApJS, 56, 1
1984
-
[22]
& Mihalas, D
Hubeny, I. & Mihalas, D. 2014, Theory of Stellar Atmospheres (Princeton Uni- versity Press)
2014
-
[23]
R., Baumert, J
Johnson, H. R., Baumert, J. H., Querci, F., & Querci, M. 1986, ApJ, 311, 960
1986
-
[24]
Johnson, H. R. & Luttermoser, D. G. 1987, ApJ, 314, 329
1987
-
[25]
Johnson, H. R. & Obrien, G. T. 1983, ApJ, 265, 952
1983
-
[26]
Judge, P. G. 1990, ApJ, 348, 279
1990
-
[27]
Judge, P. G. 1994, ApJ, 430, 351
1994
-
[28]
Judge, P. G. & Carpenter, K. G. 1998, ApJ, 494, 828
1998
-
[29]
Judge, P. G. & Cuntz, M. 1993, ApJ, 409, 776
1993
-
[30]
G., Luttermoser, D
Judge, P. G., Luttermoser, D. G., Neff, D. H., Cuntz, M., & Stencel, R. E. 1993, AJ, 105, 1973
1993
-
[31]
Judge, P. G. & Stencel, R. E. 1991, ApJ, 371, 357
1991
-
[32]
Kramida, A., Ralchenko, Y ., Reader, J., & Team, N. A. 2024, NIST Atomic Spec- tra Database (ver. 5.12), [Online]. National Institute of Standards and Tech- nology, Gaithersburg, MD. Available:https://physics.nist.gov/asd, accessed 2026-04-08
2024
-
[33]
Leenaarts, J., Pereira, T. M. D., Carlsson, M., Uitenbroek, H., & De Pontieu, B. 2013, ApJ, 772, 90
2013
-
[34]
Linsky, J. L. 1980, ARA&A, 18, 439
1980
-
[35]
Linsky, J. L. 2017, ARA&A, 55, 159
2017
-
[36]
Luttermoser, D. G. 1996, in Astronomical Society of the Pacific Conference Se- ries, V ol. 109, Cool Stars, Stellar Systems, and the Sun, ed. R. Pallavicini & A. K. Dupree, 535
1996
-
[37]
Luttermoser, D. G. 2000, ApJ, 536, 923
2000
-
[38]
Luttermoser, D. G. 2009, in Astronomical Society of the Pacific Conference Se- ries, V ol. 412, The Biggest, Baddest, Coolest Stars, ed. D. G. Luttermoser, B. J. Smith, & R. E. Stencel, 243
2009
-
[39]
G., Johnson, H
Luttermoser, D. G., Johnson, H. R., Avrett, E. H., & Loeser, R. 1989, ApJ, 345, 543
1989
-
[40]
G., Johnson, H
Luttermoser, D. G., Johnson, H. R., & Eaton, J. 1994, ApJ, 422, 351
1994
-
[41]
1986, A&A, 163, 135
Magain, P. 1986, A&A, 163, 135
1986
-
[42]
1978, Stellar atmospheres
Mihalas, D. 1978, Stellar atmospheres
1978
-
[43]
A., & Costa, R
Ortiz, R., Guerrero, M. A., & Costa, R. D. D. 2019, MNRAS, 482, 4697
2019
-
[44]
& Querci, F
Querci, M. & Querci, F. 1985, A&A, 147, 121
1985
-
[45]
E., Carpenter, K
Rau, G., Nielsen, K. E., Carpenter, K. G., & Airapetian, V . 2018, ApJ, 869, 1
2018
-
[46]
& Wood, P
Richter, H. & Wood, P. R. 2001, A&A, 369, 1027
2001
-
[47]
Rybicki, G. B. & Hummer, D. G. 1991, A&A, 245, 171
1991
-
[48]
Rybicki, G. B. & Hummer, D. G. 1992, A&A, 262, 209
1992
-
[49]
E., Linsky, J
Stencel, R. E., Linsky, J. L., Brown, A., et al. 1981, MNRAS, 196, 47P
1981
-
[50]
2001, ApJ, 557, 389
Uitenbroek, H. 2001, ApJ, 557, 389
2001
-
[51]
E., Avrett, E
Vernazza, J. E., Avrett, E. H., & Loeser, R. 1981, ApJS, 45, 635
1981
-
[52]
2017, Nature Astronomy, 1, 848
Vlemmings, W., Khouri, T., O’Gorman, E., et al. 2017, Nature Astronomy, 1, 848
2017
-
[53]
Vlemmings, W. H. T., Khouri, T., & Olofsson, H. 2019, A&A, 626, A81
2019
-
[54]
Willson, L. A. 1976, ApJ, 205, 172
1976
-
[55]
Willson, L. A. & Bowen, G. H. 1986, Irish Astronomical Journal, 17, 249
1986
-
[56]
A., Wallerstein, G., & Pilachowski, C
Willson, L. A., Wallerstein, G., & Pilachowski, C. A. 1982, MNRAS, 198, 483
1982
-
[57]
C., Ireland, M
Woodruff, H. C., Ireland, M. J., Tuthill, P. G., et al. 2009, ApJ, 691, 1328 12 Table A.1: Optical phases selected from the Bowen model and the corresponding photospheric radii. ID P1 P2 P3 P4 P5 P6 P7 P8 Optical phase0.0 0.126 0.250 0.377 0.502 0.625 0.751 0.875 Rphot (1013 cm)1.663 1.813 1.880 1.843 1.679 1.517 1.526 1.528 Appendix A: Bowen atmospheric ...
2009
discussion (0)
Sign in with ORCID, Apple, or X to comment. Anyone can read and Pith papers without signing in.