REVIEW 3 minor 32 references
Bayesian Nonparametric Detection of Anomalies in Multivariate Functional Data
T0 review · 0 major / 3 minor · reviewed 2026-06-26 · grok-4.3
Pith's one-line read An infinite mixture of multi-output Gaussian processes assigns anomalies in multivariate functional data to small components without prior specification of their number or nature.
desk verdict The paper assembles slice-sampled Dirichlet process mixtures of multi-output GPs, wavelet-Besov means, intrinsic coregionalization, and Carlin-Chib kernel selection for semi-supervised anomaly detection, but the abstract shows no performance numbers or comparisons. read the letter →
The pith
A machine-rendered reading of the paper's core claim, the machinery that carries it, and where it could break.
The reading
What carries the argument
Infinite mixture of multi-output Gaussian processes with slice sampling to determine component count, Besov priors on wavelet basis expansions for means, and Carlin-Chib product space sampling for kernel selection.
What would settle it
If repeated MCMC runs on data containing known anomalies fail to assign those anomalies to the smallest mixture components, the assignment mechanism would be falsified.
Extended reading notes
Core claim
The paper claims that by representing multivariate functional data as an infinite mixture of multi-output Gaussian processes with mean functions given sparse wavelet expansions under Besov priors and dependence via the intrinsic coregionalization model, anomalous observations can be automatically assigned to small mixture components identified through slice sampling, without needing to specify the number or nature of anomalies beforehand, as demonstrated in both univariate and multivariate cases with partial labels.
Load-bearing premise
The functional observations are generated from an infinite mixture of multi-output Gaussian processes whose means admit sparse wavelet expansions under Besov priors and whose cross-output dependence follows the intrinsic coregionalization model.
Editorial extensions
If this is right
- Anomalous observations are assigned to small mixture components without pre-specifying their number.
- The model handles multivariate functional data by capturing cross-output dependencies through the intrinsic coregionalization structure.
- Covariance kernel selection occurs jointly within the MCMC algorithm via product space steps.
- The approach operates in semi-supervised settings with only 15 percent labels on normal observations and high class imbalance.
- The same construction applies to both univariate and multivariate functional data.
Reading between the lines
- The automatic component determination could support application to streaming functional data where the number of anomalies varies over time.
- If the wavelet sparsity induced by Besov priors holds in new domains, the representation might scale to higher-dimensional output spaces.
- The mixture assignment rule suggests a natural link to other nonparametric Bayesian clustering tasks on dependent functional observations.
- Validation on datasets with documented structural breaks would provide a direct test of whether small components reliably flag anomalies.
Editorial analysis
A structured set of objections, weighed in public.
Referee Report
Summary. The paper introduces a Bayesian nonparametric model for anomaly detection in multivariate functional data. Observations are modeled as draws from an infinite mixture of multi-output Gaussian processes whose component count is determined automatically via slice sampling of a Dirichlet process. Mean functions are expanded in a wavelet basis and regularized with Besov priors; cross-output dependence is induced by the intrinsic coregionalization model; kernel selection is performed inside the MCMC via a Carlin-Chib product-space step. A semi-supervised regime supplies labels for 15 % of the normal observations. Anomalies are assigned to small mixture components without any pre-specified number or form of anomalies. Utility is illustrated on both univariate and multivariate functional examples.
Significance. If the empirical results and implementation details hold, the work supplies a coherent, fully automatic extension of Dirichlet-process mixture models to the multivariate functional setting that respects the semi-supervised constraint and the need for sparse, smooth mean representations. The combination of slice sampling, Besov-wavelet regularization, and intrinsic coregionalization is technically standard yet practically useful for applications that require detection of rare functional regimes without enumerating them in advance.
minor comments (3)
- [§3] §3 (model specification): the precise form of the slice-sampling auxiliary variables and the truncation level used in the reported runs are not stated; adding these details would allow direct replication of the component-count behavior.
- [§4] §4 (semi-supervised likelihood): the exact manner in which the 15 % labeled normal observations enter the posterior (i.e., whether they fix component labels or merely contribute to the likelihood) is described only at a high level; a short algorithmic box or equation would remove ambiguity.
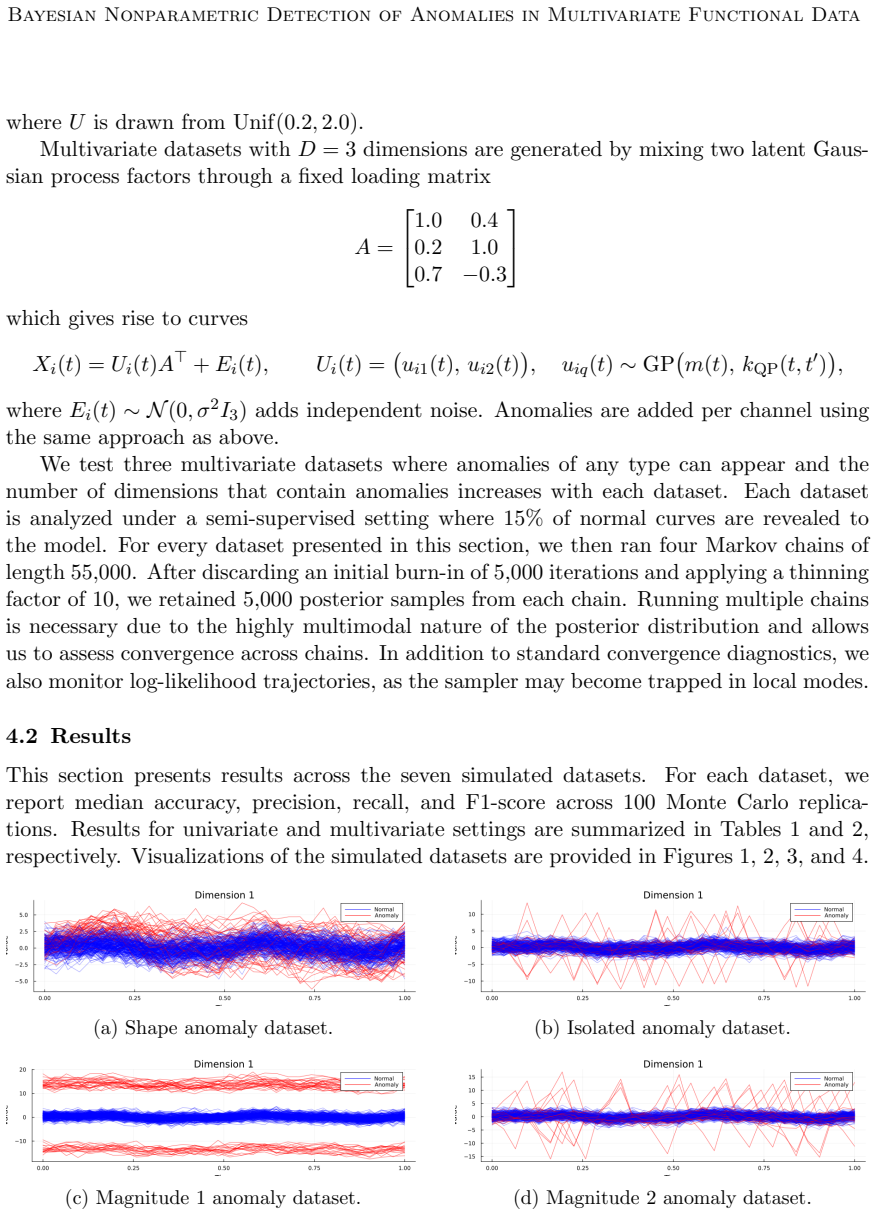
- [Figure 2, Table 1] Figure 2 and Table 1: axis labels and legend entries use inconsistent notation for the coregionalization matrix B; harmonizing with the notation in Eq. (8) would improve readability.
Simulated Author's Rebuttal
We thank the referee for their positive summary and significance assessment of our manuscript, as well as the recommendation for minor revision. The provided report contains no specific major comments to address point by point.
Circularity Check
No significant circularity
full rationale
The paper's central construction models functional data via an infinite Dirichlet process mixture of multi-output GPs, with wavelet-Besov mean functions and intrinsic coregionalization for cross-output dependence; anomaly assignment to small components follows directly from the standard properties of DPMs and slice sampling once the representation is chosen. No equations reduce a fitted quantity or prediction to its own inputs by construction, no load-bearing self-citation chain is invoked to justify uniqueness or an ansatz, and the semi-supervised anchoring of dominant components is an external modeling choice rather than a definitional loop. The derivation is therefore self-contained against external benchmarks.
Assumptions & free parameters
assumptions (2)
- domain assumption Functional observations arise from an infinite mixture of multi-output Gaussian processes
- domain assumption Mean functions admit a sparse representation in a wavelet basis under Besov priors
Cite this review
Pith. "Pith review of Bayesian Nonparametric Detection of Anomalies in Multivariate Functional Data." pith.science (2026). https://pith.science/paper/Q43RAWWQ
@misc{pith2026260618412,
  author       = {Pith},
  title        = {Pith review of: Bayesian Nonparametric Detection of Anomalies in Multivariate Functional Data},
  year         = {2026},
  howpublished = {\url{https://pith.science/paper/Q43RAWWQ}},
  note         = {Machine review of arXiv:2606.18412}
}
read the original abstract
Anomalies in functional data arise from rare or distinct processes that deviate from the dominant data-generating mechanism. Detecting such departures is essential in applications where they may correspond to errors, structural changes, or other behavior of interest. This work introduces a Bayesian nonparametric approach for anomaly detection in multivariate functional data. We model functional data as an infinite mixture of multi-output Gaussian processes, with a finite and automatically determined number of mixture components obtained through slice sampling. Mean functions are represented using a wavelet basis and regularized through Besov priors to obtain a smooth and sparse representation of the data. Cross-functional dependence is captured using the intrinsic coregionalization model and we solve covariance kernel selection by introducing a Carlin-Chib product space step in the Markov Chain Monte Carlo algorithm. Within this model, anomalous observations are assigned to small mixture components without requiring prior specification of the number or nature of anomalies. We consider a semi-supervised setting, in which labels are available for 15% of the normal observations and a large class imbalance is present. The utility of our model is demonstrated on both univariate and multivariate functional data.
Figures


Figures from the paper (5 more)


Reference graph
Works this paper leans on
-
[1]
2013 , publisher=
Ullah, Shahid and Finch, Caroline F , journal=. 2013 , publisher=
2013
-
[2]
2023 , publisher=
Staerman, Guillaume and Adjakossa, Eric and Mozharovskyi, Pavlo and Hofer, Vera and Sen Gupta, Jayant and Cl. 2023 , publisher=
2023
-
[3]
Ramsay, James O and Silverman, Bernard W , year=
-
[4]
1980 , publisher=
Hawkins, Douglas M , volume=. 1980 , publisher=
1980
-
[5]
2011 , publisher=
Alvarez, Mauricio A and Lawrence, Neil D , journal=. 2011 , publisher=
2011
-
[6]
2002 , publisher=
Mallat, Stephane G , journal=. 2002 , publisher=
2002
-
[7]
, journal=
Ray, Shubhankar and Mallick, Bani K. , journal=. 2006 , publisher=
2006
-
[8]
Sherlock, Chris and Fearnhead, Paul and Roberts, Gareth O , year=
Show all 32 references
-
[9]
2011 , publisher=
Lodewyckx, Tom and Kim, Woojae and Lee, Michael D and Tuerlinckx, Francis and Kuppens, Peter and Wagenmakers, Eric-Jan , journal=. 2011 , publisher=
2011
-
[10]
Rasmussen, Carl Edward and Williams, Christopher K. I. , title =. 2005 , month =. doi:10.7551/mitpress/3206.001.0001 , url =
2005 doi
-
[11]
1998 , publisher=
Diggle, Peter J and Tawn, Jonathan A and Moyeed, Rana A , journal=. 1998 , publisher=
1998
-
[12]
Paciorek, Christopher and Schervish, Mark , journal=
-
[13]
1995 , publisher=
Carlin, Bradley P and Chib, Siddhartha , journal=. 1995 , publisher=
1995
-
[14]
1973 , publisher=
Ferguson, Thomas S , journal=. 1973 , publisher=
1973
-
[15]
2007 , publisher=
Walker, Stephen G , journal=. 2007 , publisher=
2007
-
[16]
A constructive definition of
Sethuraman, Jayaram , journal=. A constructive definition of. 1994 , publisher=
1994
-
[17]
Lloyd, James and Duvenaud, David and Grosse, Roger and Tenenbaum, Joshua and Ghahramani, Zoubin , booktitle=
-
[18]
2021 , publisher=
Touloumis, Anestis and Marioni, John C and Tavar. 2021 , publisher=
2021
-
[19]
Test , volume=
Trimmed means for functional data , author=. Test , volume=. 2001 , publisher=
2001
-
[20]
Bonilla, Edwin V and Chai, Kian and Williams, Christopher , journal=
-
[21]
usc , author=
Statistical computing in functional data analysis: The R package fda. usc , author=. Journal of statistical Software , volume=
-
[22]
Journal of Computational and Graphical Statistics , volume=
Multivariate functional data visualization and outlier detection , author=. Journal of Computational and Graphical Statistics , volume=. 2018 , publisher=
2018
-
[23]
Statistical Methods & Applications , volume=
Multivariate functional outlier detection , author=. Statistical Methods & Applications , volume=. 2015 , publisher=
2015
-
[24]
Computational Statistics & Data Analysis , volume=
The random Tukey depth , author=. Computational Statistics & Data Analysis , volume=. 2008 , publisher=
2008
-
[25]
Computational Statistics , volume=
Robust estimation and classification for functional data via projection-based depth notions , author=. Computational Statistics , volume=. 2007 , publisher=
2007
-
[26]
2024 , note =
mrfDepth: Depth Measures in Multivariate, Regression and Functional Settings , author =. 2024 , note =
2024
-
[27]
2023 , note =
fdaoutlier: Outlier Detection Tools for Functional Data Analysis , author =. 2023 , note =
2023
-
[28]
2018 , howpublished =
Dau, Hoang Anh , title =. 2018 , howpublished =
2018
-
[29]
2006 , howpublished =
Williams, Ben , title =. 2006 , howpublished =
2006
-
[30]
2015 , publisher=
Hubert, Mia and Rousseeuw, Peter J and Segaert, Pieter , journal=. 2015 , publisher=
2015
-
[31]
2009 , publisher=
L. 2009 , publisher=
2009
-
[32]
2018 , publisher=
Souza, Vinicius MA , journal=. 2018 , publisher=
2018
Reviewed June 26, 2026 · model on record in the stance chip above.
Discussion (0). Continue with ORCID to comment.