REVIEW 1 major objections 4 minor 41 references
Sensitivity of low-degree solar p modes to active and ephemeral regions: frequency shifts back to the Maunder Minimum
T0 review · 1 major / 4 minor · reviewed 2026-08-14 · deepseek-v4-flash
Pith's one-line read The Sun's p-mode frequencies are at least three times less sensitive to ephemeral-region magnetic fields than to active-region fields.
desk verdict Solid analysis with a real statistical caveat: overlapping BiSON windows likely inflate the precision of the headline confidence bound. read the letter →
The pith
A machine-rendered reading of the paper's core claim, the machinery that carries it, and where it could break.
The reading
What carries the argument
The load-bearing object is the two-parameter linear regression model $$\delta\nu(t) = c_0 + c_1\left[F_{\rm AR}(t) + \$\alpha$\,\frac{F_{\rm ER}(t)}{\$\beta$}\right],$$ where $F_{\rm AR}$ and $F_{\rm ER}$ are area-weighted unsigned magnetic fluxes per Carrington rotation, divided into strong (active-region) and weak (ephemeral-region) components by a 15 G threshold on 5-degree patches, and $\beta$ is the assumed fraction of the true ephemeral flux captured by the magnetograms (taken as 0.4). The fit over 37 years of mean frequency shifts from 28 low-degree modes yields the relative sensitivity $\alpha$, and the same coefficients are then applied to literature reconstructions of solar flux back to the Maunder minimum.
What would settle it
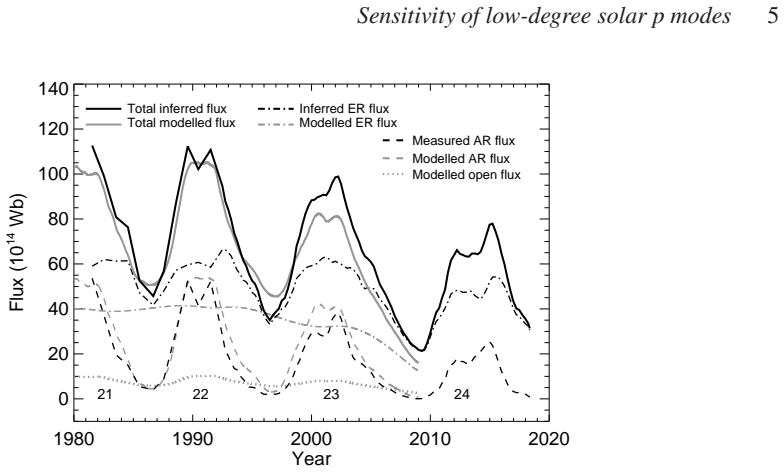
A direct test is the comparison of the two adjacent minima: the cycle 22/23 and 23/24 minima had similar active-region flux but a difference of roughly $30\times10^{14}\,\mathrm{Wb}$ in ephemeral flux, so equal sensitivity to both components would predict a frequency offset of about $0.08\,\mu$Hz. The paper finds no such offset; a clean detection of that offset would overturn the conclusion. A second check is to re-fit the model on data subdivided by mode, cycle phase, or magnetogram threshold and see whether $\alpha$ stays near 0.11 rather than moving systematically.
Extended reading notes
Core claim
The paper's central discovery is that the relative sensitivity of low-degree p-mode frequencies to the weak-field ephemeral-region component is small: fitting the linear model to 37 years of data gives $\alpha = 0.11 \pm 0.09$, so the frequencies are at least three times less sensitive to ephemeral-region flux than to active-region flux at 95% confidence. The same fit implies that cycle-to-cycle frequency swings are dominated by the active-region flux, while the residual offset at cycle minima—set mainly by ephemeral flux—has been about $\approx 0.1\,\mu$Hz or less across recent minima. The paper concludes that near-surface magnetic activity at cycle minimum produces a frequency offset that is negligible compared with the surface term, so the Sun at minimum should behave like a magnetically quiet star, and the same should hold for Sun-like stars of comparable activity.
Load-bearing premise
The load-bearing premise is that the average frequency shift is fully captured by a linear combination of the two flux measures with one fixed sensitivity ratio, so any dependence of that ratio on mode, cycle phase, spatial distribution, or weak flux missed by the magnetograms would not bias the fitted value of $\alpha$.
Editorial extensions
If this is right
- The swing in p-mode frequencies from cycle minimum to maximum is controlled predominantly by changes in active-region flux, not by ephemeral-region flux.
- At cycle minima over the last few cycles, the mean frequency offset from a magnetically quiet Sun has been about $0.1\,\mu$Hz or less—roughly a third or less of the total cycle swing.
- At cycle minimum, near-surface magnetic activity contributes negligibly to the frequency offset compared with the surface term, so the Sun at minimum should approximate a magnetically quiet star.
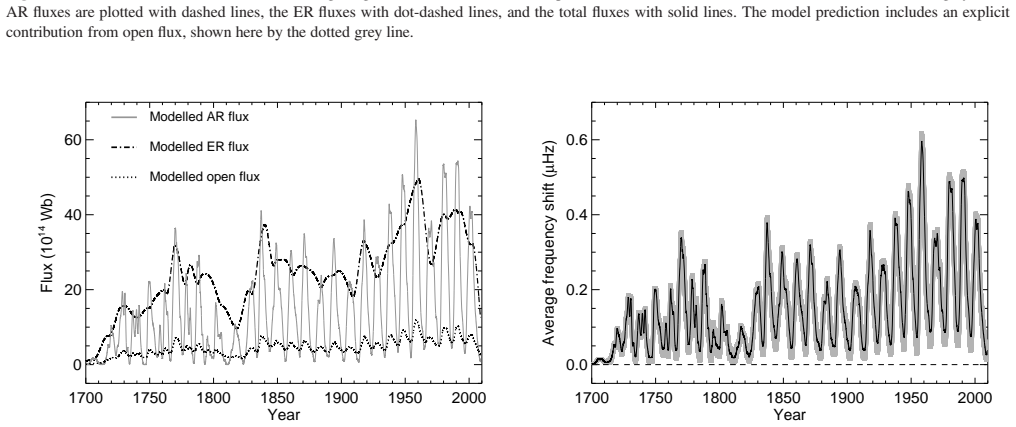
- Extending the fitted sensitivities to reconstructed fluxes back to the end of the Maunder minimum, the predicted offsets and cycle swings shrink toward zero as the ephemeral flux vanishes.
- For other Sun-like stars with similar activity, cycle-minimum activity-induced frequency shifts should likewise be small relative to model-frequency mismatches, simplifying asteroseismic modeling.
Reading between the lines
- A direct extension: stars whose magnetic activity is dominated by weak, dispersed fields rather than concentrated active regions should show much smaller p-mode frequency shifts per unit of activity proxy; multi-year asteroseismic observations of Sun-like stars could test this ratio directly.
- The paper's logic also implies a calibration strategy: adopt cycle-minimum frequencies as the quiet-star reference and assign the remaining offset to the surface term, which is a more principled anchor than mixing activity levels when comparing observed and model frequencies.
- The Maunder-minimum extrapolation rests on the model's assumption that ephemeral flux is seeded by active-region emergence, so the predicted zero offset at the end of the Maunder minimum is tied to that seeding rule; an independent model of weak-field emergence during grand minima could leave a small residual shift even then.
Signed reviews
Editorial analysis
A structured set of objections, weighed in public.
Referee Report
Summary. The paper uses 37 years of BiSON low-degree p-mode frequency shifts together with WSO and HMI magnetograms to separate the frequency response to active-region (AR) and ephemeral-region (ER) magnetic flux. They fit the linear model of Eq. (1): δν = c0 + c1 [F_AR + α (F_ER/β)], finding α = 0.11 ± 0.09 (stat) ± 0.02 (sys), and conclude that p-mode frequencies are at least three times less sensitive to ER than to AR flux at 95% confidence. Using the Vieira & Solanki (2010) flux reconstruction, they estimate that frequency shifts at cycle minima have been ≤0.1 μHz over recent minima and tend to zero at the Maunder Minimum, implying activity-related shifts are negligible compared with the surface term for Sun-like stars.
Significance. If the result holds, it gives a direct empirical constraint on the relative sensitivity of low-degree p modes to weak versus strong near-surface magnetic fields, with direct implications for interpreting activity-cycle frequency shifts in the Sun and in other Sun-like stars. The paper includes several strengths: an independent HMI cross-check of the flux separation, a systematic uncertainty on the β correction, and artificial-data recovery tests. The headline confidence statement, however, depends on an error treatment that needs to be justified.
major comments (1)
- [§3, Eq. (1)] The quoted statistical error α = 0.11 ± 0.09 appears to treat the individual BiSON mean shifts as independent, but these shifts are computed from 1-year timeseries offset by 3 months, so consecutive points share 9 months of data and the residuals are strongly autocorrelated. The paper does not report a correction for this serial correlation (e.g., a Newey-West/HAC estimator, a block bootstrap, or an explicit overlap covariance). With autocorrelation ρ ≈ 0.75, the effective number of independent samples is roughly N(1−ρ)/(1+ρ) ≈ 21 instead of ~150, inflating the standard error by a factor of about 2.6. In that case the one-sided 95% upper bound on α becomes approximately 0.11 + 1.645 × (0.09 × 2.6) ≈ 0.49, which no longer supports the abstract's claim that the p modes are 'at least three times less sensitive (at 95% confidence).' The point estimate remains suggestive, but a robust-errors analysis (or a covariance matrix that accounts for the overlap) is required to support the central confidence statement.
minor comments (4)
- [§3] The artificial-data recovery tests are mentioned but not described; please provide a brief description of the setup (number of realizations, injected α values) and the recovery statistics, or a reference to a companion paper.
- [§4 and Fig. 3] The grey error envelope is said to capture both parameter and open-flux uncertainties, but the relative contributions are not quantified; please state them.
- [Abstract and §4] The phrase 'at least three times less sensitive (at 95% confidence)' should explicitly state whether this is a one-sided or two-sided confidence bound; the current wording is ambiguous.
- [References] The reference to 'Haywood et al (in prep)' is too vague for a published paper; please update it, if possible, or give details on how to obtain the companion analysis.
Circularity Check
No significant circularity found: the central sensitivity parameter is a regression fit to independent BiSON and magnetogram data, and the Maunder Minimum extrapolation uses external flux reconstructions.
full rationale
The paper's central quantity, alpha, is defined by Eq. (1) and estimated by a multiple linear regression of observed mean p-mode frequency shifts (BiSON) on measured active-region and ephemeral-region fluxes (WSO/HMI). This is an empirical fit, not a derivation of a prediction from an input that already contains the answer. The abstract's confidence statement is a statistical claim about the fitted alpha; although the overlapping 1-year/3-month time series may inflate the effective sample size (a correctness risk rather than a circularity), the fit itself is not self-referential. The 'predictions' of cycle-minimum offsets and historical shifts back to the Maunder Minimum evaluate the fitted Eq. (1) at input fluxes from the published Vieira & Solanki (2010) reconstruction, which is external to this paper and not derived from the fitted alpha. The in-sample nature of the cycle-minimum estimates means they are not out-of-sample tests, but the paper does not use those estimates to justify alpha; it presents them as implications of the fit. Prior self-citations (Howe et al. 2017; Hale et al. 2016; Milbourne et al. 2019) supply data and calibration methods, not an unverified uniqueness theorem or a forced choice of ansatz; the linear model is stated as an explicit assumption in the text. No step reduces by construction to its own inputs, so no circularity is found.
Assumptions & free parameters
free parameters (5)
- α (relative sensitivity of p-mode frequencies to ER vs AR flux) =
0.11 ± 0.09 (stat) ± 0.02 (sys)
- c1 (frequency shift per unit AR flux) =
7.9 ± 0.7 nHz per 10^14 Wb
- c0 (zero-flux frequency offset) =
not reported numerically
- β (fraction of ER flux captured by magnetograms) =
0.4 (assumed)
- AR/ER flux threshold =
15 G
assumptions (5)
- domain assumption Frequency shifts are a linear function of the AR and ER magnetic flux (Eq. 1, Section 2).
- domain assumption Total magnetic fluxes in the AR and ER components determine the frequency shifts of the low-degree modes.
- domain assumption WSO magnetograms thresholded at 15 G and corrected with β=0.4 provide reliable AR and ER flux time series.
- domain assumption The Vieira & Solanki (2010) model reconstructions give faithful AR, ER, and open flux over the past 300 years.
- domain assumption A single relative sensitivity α applies to the mean frequency shift of all 28 low-degree modes.
Cite this review
Pith. "Pith review of Sensitivity of low-degree solar p modes to active and ephemeral regions: frequency shifts back to the Maunder Minimum." pith.science (2026). https://pith.science/paper/Q4TNCUAC
@misc{pith2026190808755,
  author       = {Pith},
  title        = {Pith review of: Sensitivity of low-degree solar p modes to active and ephemeral regions: frequency shifts back to the Maunder Minimum},
  year         = {2026},
  howpublished = {\url{https://pith.science/paper/Q4TNCUAC}},
  note         = {Machine review of arXiv:1908.08755}
}
abstract
We explore the sensitivity of the frequencies of low-degree solar p-modes to near-surface magnetic flux on different spatial scales and strengths, specifically to active regions with strong magnetic fields and ephemeral regions with weak magnetic fields. We also use model reconstructions from the literature to calculate average frequency offsets back to the end of the Maunder minimum. We find that the p-mode frequencies are at least three times less sensitive (at 95% confidence) to the ephemeral-region field than they are to the active-region field. Frequency shifts between activity cycle minima and maxima are controlled predominantly by the change of active region flux. Frequency shifts at cycle minima (with respect to a magnetically quiet Sun) are determined largely by the ephemeral flux, and are estimated to have been $0.1\,\rm \mu Hz$ or less over the last few minima. We conclude that at epochs of cycle minimum, frequency shifts due to near-surface magnetic activity are negligible compared to the offsets between observed and model frequencies that arise from inaccurate modelling of the near-surface layers (the so-called surface term). The implication is that this will be the case for other Sun-like stars with similar activity, which has implications for asteroseismic modelling of stars.
Figures

Reference graph
Works this paper leans on
-
[1]
Arge C. N., Hildner E., Pizzo V. J., Harvey J. W., 2002, @doi [Journal of Geophysical Research (Space Physics)] 10.1029/2001JA000503 , http://adsabs.harvard.edu/abs/2002JGRA..107.1319A 107, 1319
-
[2]
Ball W. H., Gizon L., 2014, @doi [ ] 10.1051/0004-6361/201424325 , https://ui.adsabs.harvard.edu/abs/2014A&A...568A.123B 568, A123
-
[3]
Broomhall A. M., 2017, @doi [ ] 10.1007/s11207-017-1068-5 , https://ui.adsabs.harvard.edu/abs/2017SoPh..292...67B 292, 67
-
[4]
Christensen-Dalsgaard J., 1986, Seismology of the Sun and Other Stars . p. 145
work page 1986
-
[5]
Duvall Jr. T. L., Wilcox J. M., Svalgaard L., Scherrer P. H., McIntosh P. S., 1977, @doi [ ] 10.1007/BF00150874 , https://ui.adsabs.harvard.edu/abs/1977SoPh...55...63D 55, 63
-
[6]
Dziembowski W. A., Goode P. R., 2005, @doi [ ] 10.1086/429712 , https://ui.adsabs.harvard.edu/abs/2005ApJ...625..548D 625, 548
-
[7]
Elsworth Y., Howe R., Isaak G. R., McLeod C. P., New R., 1990, @doi [ ] 10.1038/345322a0 , https://ui.adsabs.harvard.edu/abs/1990Natur.345..322E 345, 322
doi:10.1038/345322a0 1990
-
[8]
Fligge M., Solanki S. K., Unruh Y. C., 2000, , http://adsabs.harvard.edu/abs/2000A\
work page 2000
Show all 41 references
-
[9]
A., Mathur S., Salabert D., Ballot J., R \'e gulo C., Metcalfe T
Garc \' a R. A., Mathur S., Salabert D., Ballot J., R \'e gulo C., Metcalfe T. S., Baglin A., 2010, @doi [Science] 10.1126/science.1191064 , https://ui.adsabs.harvard.edu/abs/2010Sci...329.1032G 329, 1032
2010 doi
-
[10]
O., 1990, Comments on Helioseismic Inference
Gough D. O., 1990, Comments on Helioseismic Inference . p. 283, @doi 10.1007/3-540-53091-6
1990 doi
-
[11]
O., Thompson M
Gough D. O., Thompson M. J., 1990, @doi [ ] 10.1093/mnras/242.1.25 , https://ui.adsabs.harvard.edu/abs/1990MNRAS.242...25G 242, 25
1990 doi
-
[12]
J., Howe R., Chaplin W
Hale S. J., Howe R., Chaplin W. J., Davies G. R., Elsworth Y. P., 2016, @doi [ ] 10.1007/s11207-015-0810-0 , https://ui.adsabs.harvard.edu/abs/2016SoPh..291....1H 291, 1
2016 doi
-
[13]
L., 1994, in Rutten R
Harvey K. L., 1994, in Rutten R. J., Schrijver C. J., eds, NATO Advanced Science Institutes (ASI) Series C Vol. 433, NATO Advanced Science Institutes (ASI) Series C. p. 347
1994
-
[14]
Harvey K., 2000, Solar Active Regions: Ephemeral . p. 2275, @doi 10.1888/0333750888/2275
2000 doi
-
[15]
D., et al., 2016, @doi [Monthly Notices of the Royal Astronomical Society] 10.1093/mnras/stw187 , 457, 3637
Haywood R. D., et al., 2016, @doi [Monthly Notices of the Royal Astronomical Society] 10.1093/mnras/stw187 , 457, 3637
2016 doi
-
[16]
R., Chaplin W
Howe R., Davies G. R., Chaplin W. J., Elsworth Y., Basu S., Hale S. J., Ball W. H., Komm R. W., 2017, @doi [ ] 10.1093/mnras/stx1318 , https://ui.adsabs.harvard.edu/abs/2017MNRAS.470.1935H 470, 1935
2017 doi
-
[17]
Kiefer R., Roth M., 2018, @doi [ ] 10.3847/1538-4357/aaa3f7 , https://ui.adsabs.harvard.edu/abs/2018ApJ...854...74K 854, 74
2018 doi
-
[18]
Kiefer R., Schad A., Davies G., Roth M., 2017, @doi [ ] 10.1051/0004-6361/201628469 , https://ui.adsabs.harvard.edu/abs/2017A&A...598A..77K 598, A77
2017 doi
-
[19]
R., Christensen-Dalsgaard J., 2008, @doi [ ] 10.1086/591667 , https://ui.adsabs.harvard.edu/abs/2008ApJ...683L.175K 683, L175
Kjeldsen H., Bedding T. R., Christensen-Dalsgaard J., 2008, @doi [ ] 10.1086/591667 , https://ui.adsabs.harvard.edu/abs/2008ApJ...683L.175K 683, L175
2008 doi
-
[20]
A., Solanki S
Krivova N. A., Solanki S. K., 2004, @doi [ ] 10.1051/0004-6361:20040022 , https://ui.adsabs.harvard.edu/abs/2004A&A...417.1125K 417, 1125
2004 doi
-
[21]
A., Balmaceda L., Solanki S
Krivova N. A., Balmaceda L., Solanki S. K., 2007, @doi [ ] 10.1051/0004-6361:20066725 , http://adsabs.harvard.edu/abs/2007A
2007 doi
-
[22]
G., Woodard M
Libbrecht K. G., Woodard M. F., 1990, @doi [ ] 10.1038/345779a0 , https://ui.adsabs.harvard.edu/abs/1990Natur.345..779L 345, 779
1990 doi
-
[23]
Meunier N., Lagrange A.-M., Desort M., 2010, @doi [Astronomy and Astrophysics] 10.1051/0004-6361/201014199 , 519, A66
2010 doi
-
[24]
W., et al., 2019, @doi [The Astrophysical Journal] 10.3847/1538-4357/ab064a , 874, 107
Milbourne T. W., et al., 2019, @doi [The Astrophysical Journal] 10.3847/1538-4357/ab064a , 874, 107
2019 doi
-
[25]
T., Tovar G., Foreman-Mackey D., 2017, @doi [ ] 10.3847/1538-4357/aa9e00 , https://ui.adsabs.harvard.edu/abs/2017ApJ...851..116M 851, 116
Montet B. T., Tovar G., Foreman-Mackey D., 2017, @doi [ ] 10.3847/1538-4357/aa9e00 , https://ui.adsabs.harvard.edu/abs/2017ApJ...851..116M 851, 116
2017 doi
-
[26]
L., Regulo C., Roca Cortes T., 1989, , https://ui.adsabs.harvard.edu/abs/1989A&A...224..253P 224, 253
Palle P. L., Regulo C., Roca Cortes T., 1989, , https://ui.adsabs.harvard.edu/abs/1989A&A...224..253P 224, 253
1989
-
[27]
D., Thompson B
Pesnell W. D., Thompson B. J., Chamberlin P. C., 2012, @doi [Solar Physics] 10.1007/s11207-011-9841-3 , 275, 3
2012 doi
-
[28]
R., Lockwood G
Radick R. R., Lockwood G. W., Henry G. W., Hall J. C., Pevtsov A. A., 2018, @doi [ ] 10.3847/1538-4357/aaaae3 , https://ui.adsabs.harvard.edu/abs/2018ApJ...855...75R 855, 75
2018 doi
-
[29]
Salabert D., et al., 2016, @doi [ ] 10.1051/0004-6361/201527978 , https://ui.adsabs.harvard.edu/abs/2016A
2016 doi
-
[30]
Santos A. R. G., Cunha M. S., Avelino P. P., Chaplin W. J., Campante T. L., 2016, @doi [ ] 10.1093/mnras/stw1348 , https://ui.adsabs.harvard.edu/abs/2016MNRAS.461..224S 461, 224
2016 doi
-
[31]
Santos A. R. G., et al., 2018, @doi [ ] 10.3847/1538-4365/aac9b6 , https://ui.adsabs.harvard.edu/abs/2018ApJS..237...17S 237, 17
2018 doi
-
[32]
Schou J., et al., 2012, @doi [Solar Physics] 10.1007/s11207-011-9842-2 , 275, 229
2012 doi
-
[33]
K., Sch \"u ssler M., Fligge M., 2002, @doi [ ] 10.1051/0004-6361:20011790 , https://ui.adsabs.harvard.edu/abs/2002A&A...383..706S 383, 706
Solanki S. K., Sch \"u ssler M., Fligge M., 2002, @doi [ ] 10.1051/0004-6361:20011790 , https://ui.adsabs.harvard.edu/abs/2002A&A...383..706S 383, 706
2002 doi
-
[34]
F., Boteler D., Charbonneau P., Crouch A., Manson A., Paquette H., 2007, @doi [ ] 10.1007/s11207-007-9047-x , http://adsabs.harvard.edu/abs/2007SoPh..246..309T 246, 309
Tapping K. F., Boteler D., Charbonneau P., Crouch A., Manson A., Paquette H., 2007, @doi [ ] 10.1007/s11207-007-9047-x , http://adsabs.harvard.edu/abs/2007SoPh..246..309T 246, 309
2007 doi
-
[35]
Vieira L. E. A., Solanki S. K., 2010, @doi [ ] 10.1051/0004-6361/200913276 , http://adsabs.harvard.edu/abs/2010A
2010 doi
-
[36]
F., Noyes R
Woodard M. F., Noyes R. W., 1985, @doi [ ] 10.1038/318449a0 , https://ui.adsabs.harvard.edu/abs/1985Natur.318..449W 318, 449
1985 doi
-
[37]
F., Kuhn J
Woodard M. F., Kuhn J. R., Murray N., Libbrecht K. G., 1991, @doi [ ] 10.1086/186056 , https://ui.adsabs.harvard.edu/abs/1991ApJ...373L..81W 373, L81
1991 doi
-
[38]
write newline
" write newline "" before.all 'output.state := FUNCTION fin.entry write newline FUNCTION new.block output.state before.all = 'skip after.block 'output.state := if FUNCTION new.sentence output.state after.block = 'skip output.state before.all = 'skip after.sentence 'output.stat...
-
[39]
@esa (Ref
\@ifclassloaded aguplus natbib The aguplus class already includes natbib coding, so you should not add it explicitly Type <Return> for now, but then later remove the command natbib from the document \@ifclassloaded nlinproc natbib The nlinproc class already includes natbib cod...
-
[40]
@stdbsttrue NAT@ctr \@lbibitem[ NAT@ctr ] \@lbibitem[#1]#2 \@extra@b@citeb \@ifundefined br@#2\@extra@b@citeb \@namedef br@#2 \@nameuse br@#2\@extra@b@citeb \@ifundefined b@#2\@extra@b@citeb @num @parse #2 [ @natanchorstart #2\@extra@b@citeb \@biblabel @num @natanchorend] @ifc...
-
[41]
@open @close @open @close and [1] URL: #1 \@ifundefined chapter * \@mkboth \@ifundefined NAT@sectionbib * \@mkboth * \@mkboth\@gobbletwo \@ifclassloaded amsart * \@ifclassloaded amsbook * \@ifundefined bib@heading @heading NAT@ctr thebibliography [1] @ \@biblabel NAT@ctr \@bib...
1900
Reviewed August 14, 2026 · model on record in the stance chip above.
Discussion (0). Continue with ORCID to comment.