REVIEW 3 major objections 5 minor 72 references
Explaining Black-Box Clustering Pipelines With Cluster-Explorer
T0 review · 3 major / 5 minor · reviewed 2026-08-10 · deepseek-v4-flash
Pith's one-line read The paper claims that Cluster-Explorer explains any black-box clustering pipeline by mining concise, Pareto-optimal conjunctions of predicates via generalized frequent-itemset mining, and that these explanations beat XAI baselines in…
desk verdict A solid systems paper with a clean gFIM reduction, but the headline quality claim is partly circular and the abstract overstates the runtime advantage; it deserves peer review with revisions. read the letter →
The pith
A machine-rendered reading of the paper's core claim, the machinery that carries it, and where it could break.
The reading
What carries the argument
The load-bearing object is the reduction to generalized frequent itemset mining (gFIM) over augmented transactions. gFIM extends classic frequent itemset mining by letting items be organized in a taxonomy, so a mined itemset can contain either a specific value or a more general category; here the category hierarchy is an interval taxonomy built from multiple binning methods, and items are predicates. The reduction makes coverage equal to itemset frequency, lets the taxonomy eliminate overlapping interval predicates, and lets a high support threshold and small maximal itemset size keep the exponential mining cost manageable; a Gini-importance-based attribute selection step further prunes items.
What would settle it
Build a synthetic dataset where one cluster is deliberately two well-separated modes (for example, ages 18-25 and 55-65 with no other distinguishing attributes) and run Cluster-Explorer. Any single conjunction of interval predicates can cover at most one mode, so the best rule's coverage will be near 50% and the QSE will fall far below the reported 0.84 average; this directly tests the central quality claim.
Extended reading notes
Core claim
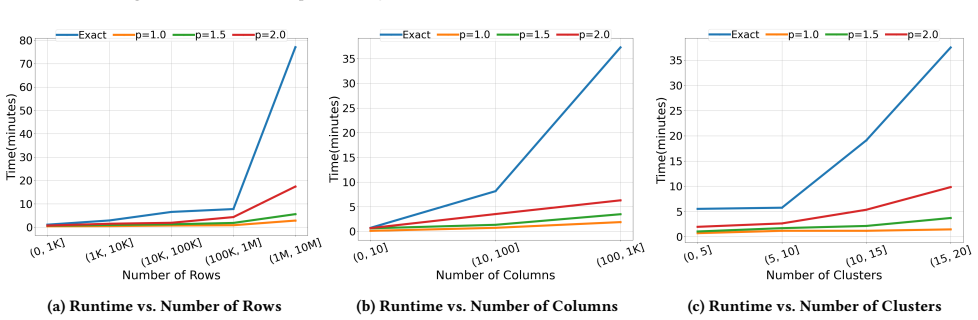
At the paper's center is a reformulation: explaining a cluster is the same as mining frequent generalized itemsets. Each data point becomes an augmented transaction whose items are predicates—numeric intervals from five binning methods, raw values, and negations of categorical values—organized in an interval taxonomy. Running generalized frequent itemset mining separately on each cluster's transactions yields candidate explanations whose frequency is exactly coverage; candidates are then filtered by separation error and reduced to Pareto-optimal explanations trading off coverage, separation error, and conciseness. The paper's empirical claim is that on its 98-instance benchmark this pipeline produces explanations with an average QSE of 0.84 versus 0.72 for the best baseline, that quality degrades far less as rows, columns, or clusters grow, and that a decision-tree-based attribute selection step cuts runtime by 14.4x with negligible quality loss.
Load-bearing premise
The system assumes every cluster worth explaining can be captured by one short conjunction of numeric intervals and categorical negations; a cluster that splits into two or more disjoint profiles has no concise explanation in this language, and the reported quality does not cover that case.
Editorial extensions
If this is right
- Any clustering pipeline can be explained post hoc without retraining: only the original data and cluster labels are needed.
- Explanations come out as short conjunctions of range and inequality predicates, so non-experts can read and sanity-check them directly.
- On the 98-result benchmark the reported average QSE beats all four baselines and stays nearly flat as dataset size, width, and cluster count grow.
- The attribute-selection optimization gives an average 14.4x runtime reduction, reaching up to 26.9x on large datasets, with under 0.1 QSE loss.
- Because quality holds across five different clustering algorithms, the tool does not force users to switch to an interpretable clustering algorithm.
Reading between the lines
- Because the explanation language is limited to conjunctions of intervals and negations, a cluster that is really two disjoint profiles will need several rules or a disjunction; adding disjunctions would be a direct extension of the gFIM encoding.
- The equal weighting of coverage, separation error, and conciseness in QSE is a modeling choice; re-ranking the same Pareto-optimal front under different weights would let users emphasize auditability versus discovery without re-running the miner.
- The same attribute-selection trick should transfer to other high-coverage, short-pattern mining tasks such as subgroup discovery, where Gini-based pruning could cut the itemset search space similarly.
Signed reviews
Editorial analysis
A structured set of objections, weighed in public.
Referee Report
Summary. Cluster-Explorer is a post-hoc explainability tool for black-box clustering pipelines. An explanation is a conjunction of predicates over numeric interval bins and categorical negations, and the paper defines explanation quality in terms of coverage, separation error, and conciseness. The core algorithmic contribution is a reduction to generalized frequent-itemset mining (gFIM): for each cluster, Cluster-Explorer mines frequent itemsets with minimum support equal to the coverage threshold and maximum size equal to the inverse conciseness threshold, converts itemsets to predicate conjunctions, filters by separation error, and then computes Pareto-optimal explanations via the skyline operator. An attribute-selection step based on decision-tree Gini importance is added for scalability. The paper evaluates the method on 98 clustering instances derived from 19 UCI datasets and 16 pipelines, comparing against SHAP, Anchors, SkopeRules, and decision-tree paths on a composite QSE score and on runtime, and it reports a small user study.
Significance. If the quality claims hold, Cluster-Explorer would be a practically useful, algorithm-agnostic tool for obtaining rule-like cluster explanations at scale, with experiments covering datasets up to 1.7M rows. The gFIM reduction is clean and the implementation, benchmark, and code are publicly available, which is a tangible contribution to the community. However, the evaluation of explanation quality is substantially weakened by the fact that the automatic metric QSE is the same objective that Cluster-Explorer optimizes, and by the small and partial user study. The runtime claim in the abstract is also overstated relative to the paper's own results. The algorithmic machinery and the benchmark are solid, but the central 'superiority' claim needs additional, non-circular evidence.
major comments (3)
- [Section 5.1 and Section 4.3] The automatic quality evaluation uses QSE = (Coverage + (1 - SeparationErr) + Conciseness) / 3, and Algorithm 2 generates candidate explanations by enforcing Coverage >= theta_cov and Conciseness >= theta_con, filtering SeparationErr <= theta_sep, and then selecting the skyline over exactly these three quantities. The reported QSE gap (e.g., 0.84 for Cluster-Explorer vs. 0.72 for SkopeRules in Section 5.2.1) therefore largely measures how closely each method matches Cluster-Explorer's own objective, not an independent notion of explanation quality. The claim in Section 5 that 'the explanations generated by Cluster-Explorer are superior to those of the baselines in terms of ... quality' should be supported by an evaluation criterion that is not the optimized objective, such as a larger user study, a downstream task, or a comparison at matched conciseness levels.
- [Abstract and Section 5.2.4] The abstract claims superiority over XAI baselines in execution times, but Section 5.2.4 reports the Decision Tree baseline at 6.3 seconds versus 55.8 seconds for Cluster-Explorer. The text later qualifies that Decision Tree is not quality-competitive and that Cluster-Explorer is 12.6x faster than the closest quality-competitive baseline, but the unqualified statement in the abstract is inaccurate. The runtime claim should be restated to refer to quality-competitive baselines, or the comparison should include a quality-adjusted runtime.
- [Section 5.2.2] The user study is the only non-circular evidence for quality superiority, but it is small and partial: 12 participants, three datasets, and 36 evaluations by the paper's own count, with SHAP and Anchors excluded. The description is also internally inconsistent: 'each participant evaluated three cluster explanations per dataset' over three datasets with 12 participants would yield 108 evaluations, not 36. As reported, this study cannot by itself support the strong claim that Cluster-Explorer produces superior explanations; it should be presented as preliminary evidence or the claim should be softened.
minor comments (5)
- [Section 3.3, Definition 3.3] Condition (2) is missing a negation symbol in the typeset formula; it should read 'there does not exist E_c such that ...' to express Pareto optimality correctly.
- [Section 6] The paper acknowledges that disjunctions are future work, but the abstract and Section 5 should state that the claimed superiority is within the restricted explanation language of conjunctions of interval and negation predicates; clusters with disjoint profiles cannot be expressed in this language.
- [Example 1.2] The text says 'Figure 1 depicts two example cluster explanations', but Figure 1 shows clustering results and Figure 2 shows the explanations; the cross-reference is incorrect.
- [Section 5.2.2] The count of user-study evaluations is ambiguous and should be clarified, along with whether each participant rated all three datasets or a subset.
- [General editorial] There are several typos, including 'unclear clear' in Section 1, 'in order too obtain' in Section 4.3, and formatting issues in Algorithm 1 and Figure 3 captions.
Circularity Check
Automatic quality superiority is measured by QSE, a simple average of exactly the three criteria Cluster-Explorer enforces and Pareto-optimizes in Algorithm 2, so the headline quality gap over baselines is partly an artifact of evaluating the method on its own objective; only a small, partial user study provides independent support.
-
self definitional
[Section 5.1 (Evaluating Metrics), compared with Definition 3.3 and Algorithm 2 (Section 4.3)]
"Based on the clustering explanations quality criteria described in Section 3.2, we use a unified Quality Score for an Explanation (QSE) which balances the coverage, separation error, and conciseness. QSE is defined for a single cluster explanation by: QSE(𝐸𝑐) = Coverage(𝐸𝑐)+ (1− SeparationErr(𝐸𝑐))+ Conciseness(𝐸𝑐) / 3"
The three components of QSE are precisely the three objectives that Cluster-Explorer is built to optimize. Algorithm 2 runs gFIM with minsup = θ_cov and maxsize = 1/θ_con, filters explanations by SeparationErr ≤ θ_sep, and then selects via SKYLINE(Coverage, SepError, Conciseness). Definition 3.3 defines the desired explanation set using exactly the same coverage, separation-error, and conciseness Pareto criteria. Thus every explanation Cluster-Explorer returns is constrained to score highly on QSE by construction. The reported 0.84 vs. 0.72 advantage over SkopeRules therefore measures, to a substantial degree, how closely each baseline happens to match Cluster-Explorer's own scoring function rather than an externally grounded notion of semantic quality.
full rationale
The central automatic evaluation is partially circular. Section 5.1 defines QSE as the average of coverage, (1 - separation error), and conciseness, and Section 5.2.1 uses this QSE to claim superiority. But Section 4.3 / Algorithm 2 generates Cluster-Explorer's explanations under exactly those criteria: gFIM enforces coverage ≥ θ_cov and itemset size ≤ 1/θ_con, the separation-error filter enforces SeparationErr ≤ θ_sep, and the skyline returns Pareto-optimal explanations with respect to coverage, separation error, and conciseness. So Cluster-Explorer is optimized to maximize the same quantity on which it is evaluated; the quality gap partly reduces to objective alignment. The paper does offer an independent user study, and its results correlate with QSE, but the study is too small and partial to fully carry the universal superiority claim. There is no load-bearing self-citation: references [57] and [58] point to the authors' code and demo but are not used to justify the core derivation, and the gFIM reduction is grounded in standard external literature. Separately, the abstract's claim of superior execution times is contradicted by Section 5.2.4, where Decision Tree is roughly 9x faster than Cluster-Explorer (6.3s vs. 55.8s); this is an overclaim rather than a circularity. Overall, the quality result is partially reduced to the method's own objective, so the circularity score is 6.
Assumptions & free parameters
free parameters (5)
- coverage threshold theta_cov =
0.8
- separation error threshold theta_sep =
0.3
- conciseness threshold theta_con =
0.2
- attribute selection scaling p =
1
- binning method set
assumptions (5)
- standard math Generalized frequent itemset mining algorithms correctly return all itemsets with support above the threshold and size below the maximum.
- standard math The interval taxonomy partial order correctly represents containment, so the support of an interval itemset equals the coverage of the corresponding range predicate.
- domain assumption Coverage, separation error, and conciseness as defined in Section 3.2 are appropriate operationalizations of explanation quality.
- domain assumption Gini importance from a binary decision tree predicts which attributes are relevant for explaining clusters.
- domain assumption Filtering clustering results by silhouette coefficient >= 0.1 removes only near-random results and leaves a representative benchmark.
Cite this review
Pith. "Pith review of Explaining Black-Box Clustering Pipelines With Cluster-Explorer." pith.science (2026). https://pith.science/paper/Q7FN5DLY
@misc{pith2026241220446,
  author       = {Pith},
  title        = {Pith review of: Explaining Black-Box Clustering Pipelines With Cluster-Explorer},
  year         = {2026},
  howpublished = {\url{https://pith.science/paper/Q7FN5DLY}},
  note         = {Machine review of arXiv:2412.20446}
}
read the original abstract
Explaining the results of clustering pipelines by unraveling the characteristics of each cluster is a challenging task, often addressed manually through visualizations and queries. Existing solutions from the domain of Explainable Artificial Intelligence (XAI) are largely ineffective for cluster explanations, and interpretable-by-design clustering algorithms may be unsuitable when the clustering algorithm does not fit the data properties. To bridge this gap, we introduce Cluster-Explorer, a novel explainability tool for black-box clustering pipelines. Our approach formulates the explanation of clusters as the identification of concise conjunctions of predicates that maximize the coverage of the cluster's data points while minimizing separation from other clusters. We achieve this by reducing the problem to generalized frequent-itemsets mining (gFIM), where items correspond to explanation predicates, and itemset frequency indicates coverage. To enhance efficiency, we leverage inherent problem properties and implement attribute selection to further reduce computational costs. Experimental evaluations on a benchmark collection of 98 clustering results, as well as a user study, demonstrate the superiority of Cluster-Explorer in both explanation quality and execution times compared to XAI baselines.
Figures


Figures from the paper (7 more)


Reference graph
Works this paper leans on
-
[1]
Adult Income Dataset (UCI). 2024. https://archive.ics.uci.edu/ml/datasets/Adult/
work page 2024
-
[2]
Rakesh Agrawal, Ramakrishnan Srikant, et al. 1994. Fast algorithms for mining association rules. In Proc. 20th int. conf. very large data bases, VLDB , Vol. 1215. Citeseer, 487–499
work page 1994
-
[3]
Suad A Alasadi and Wesam S Bhaya. 2017. Review of data preprocessing tech- niques in data mining. Journal of Engineering and Applied Sciences 12, 16 (2017), 4102–4107
work page 2017
-
[4]
Alejandro Barredo Arrieta, Natalia Díaz-Rodríguez, Javier Del Ser, Adrien Ben- netot, Siham Tabik, Alberto Barbado, Salvador García, Sergio Gil-López, Daniel Molina, Richard Benjamins, et al. 2020. Explainable Artificial Intelligence (XAI): Concepts, taxonomies, opportunities and challenges toward responsible AI. In- formation fusion 58 (2020), 82–115
2020
-
[5]
Szymon Bobek, Michal Kuk, Maciej Szelążek, and Grzegorz J Nalepa. 2022. En- hancing cluster analysis with explainable AI and multidimensional cluster pro- totypes. IEEE Access 10 (2022), 101556–101574
work page 2022
-
[6]
Stephan Borzsony, Donald Kossmann, and Konrad Stocker. 2001. The skyline operator. In Proceedings 17th international conference on data engineering . IEEE, 421–430
work page 2001
-
[7]
L. Breiman, J. Friedman, C.J. Stone, and R.A. Olshen. 1984. Classification and Regression Trees. Taylor & Francis
work page 1984
-
[8]
Marco Cavallo and Çağatay Demiralp. 2018. Clustrophile 2: Guided visual clustering analysis. IEEE transactions on visualization and computer graphics 25, 1 (2018), 267–276
work page 2018
Show all 72 references
-
[9]
Yair Censor. 1977. Pareto optimality in multiobjective problems. Applied Mathe- matics and Optimization 4, 1 (1977), 41–59
1977
-
[10]
Angelos Chatzimparmpas, Rafael M Martins, and Andreas Kerren. 2020. t-visne: Interactive assessment and interpretation of t-sne projections. IEEE transactions on visualization and computer graphics 26, 8 (2020), 2696–2714
2020
-
[11]
Tianqi Chen and Carlos Guestrin. 2016. Xgboost: A scalable tree boosting system. In Proceedings of the 22nd acm sigkdd international conference on knowledge discovery and data mining . 785–794
2016
-
[12]
William W Cohen and Yoram Singer. 1999. A simple, fast, and effective rule learner. AAAI/IAAI 99, 335-342 (1999), 3
1999
-
[13]
Brian A Davey and Hilary A Priestley. 2002. Introduction to lattices and order . Cambridge university press
2002
-
[14]
Finale Doshi-Velez and Been Kim. 2017. Towards a rigorous science of inter- pretable machine learning. arXiv preprint arXiv:1702.08608 (2017)
2017 arXiv
-
[15]
Mengnan Du, Ninghao Liu, and Xia Hu. 2019. Techniques for interpretable machine learning. Commun. ACM 63, 1 (2019), 68–77
2019
-
[16]
George H Dunteman. 1989. Principal components analysis. Number 69. Sage
1989
-
[17]
Charles A Ellis, Mohammad SE Sendi, Eloy Geenjaar, Sergey M Plis, Robyn L Miller, and Vince D Calhoun. 2021. Algorithm-Agnostic Explainability for Unsu- pervised Clustering. arXiv preprint arXiv:2105.08053 (2021)
2021 arXiv
-
[18]
Martin Ester, Hans-Peter Kriegel, Jörg Sander, Xiaowei Xu, et al. 1996. A density- based algorithm for discovering clusters in large spatial databases with noise. In kdd, Vol. 96. 226–231
1996
-
[19]
Absalom E Ezugwu, Abiodun M Ikotun, Olaide O Oyelade, Laith Abualigah, Jeffery O Agushaka, Christopher I Eke, and Andronicus A Akinyelu. 2022. A com- prehensive survey of clustering algorithms: State-of-the-art machine learning applications, taxonomy, challenges, and future re...
2022
-
[20]
Yoav Freund and Robert E Schapire. 1997. A decision-theoretic generalization of on-line learning and an application to boosting. Journal of computer and system sciences 55, 1 (1997), 119–139
1997
-
[21]
Brendan J Frey and Delbert Dueck. 2007. Clustering by passing messages between data points. science 315, 5814 (2007), 972–976
2007
-
[22]
Jerome H FRIEDMAN and Bogdan E POPESCU. 2008. PREDICTIVE LEARNING VIA RULE ENSEMBLES. The Annals of applied statistics 2, 3 (2008), 916–954
2008
-
[23]
Nave Frost, Michal Moshkovitz, and Cyrus Rashtchian. 2020. ExKMC: Expanding Explainable𝑘-Means Clustering. arXiv preprint arXiv:2006.02399 (2020)
2020 arXiv
-
[24]
Yongjian Fu and Jiawei Han. 1995. Meta-Rule-Guided Mining of Association Rules in Relational Databases.. In KDOOD/TDOOD. Citeseer, 39–46
1995
-
[25]
Mohamed H Gad-Elrab, Daria Stepanova, Trung-Kien Tran, Heike Adel, and Gerhard Weikum. 2020. Excut: Explainable embedding-based clustering over knowledge graphs. In International Semantic Web Conference. Springer, 218–237
2020
-
[26]
Salvador García, Sergio Ramírez-Gallego, Julián Luengo, José Manuel Benítez, and Francisco Herrera. 2016. Big data preprocessing: methods and prospects. Big Data Analytics 1, 1 (2016), 1–22
2016
-
[27]
Riccardo Guidotti, Anna Monreale, Fosca Giannotti, Dino Pedreschi, Salvatore Ruggieri, and Franco Turini. 2019. Factual and counterfactual explanations for black box decision making. IEEE Intelligent Systems 34, 6 (2019), 14–23
2019
-
[28]
Jiawei Han, Jian Pei, and Yiwen Yin. 2000. Mining frequent patterns without candidate generation. ACM sigmod record 29, 2 (2000), 1–12
2000
-
[29]
Harris, K
Charles R. Harris, K. Jarrod Millman, Stéfan J. van der Walt, Ralf Gommers, Pauli Virtanen, David Cournapeau, Eric Wieser, Julian Taylor, Sebastian Berg, Nathaniel J. Smith, Robert Kern, Matti Picus, Stephan Hoyer, Marten H. van Kerkwijk, Matthew Brett, Allan Haldane, Jaime Fe...
2020
-
[30]
Douglas M Hawkins. 2004. The problem of overfitting. Journal of chemical information and computer sciences 44, 1 (2004), 1–12
2004
-
[31]
Jochen Hipp, Andreas Myka, Rüdiger Wirth, and Ulrich Güntzer. 1998. A new algorithm for faster mining of generalized association rules. In Principles of Data Mining and Knowledge Discovery: Second European Symposium, PKDD’98 Nantes, France, September 23–26, 1998 Proceedings 2 ...
1998
-
[32]
Mark Ibrahim, Melissa Louie, Ceena Modarres, and John Paisley. 2019. Global explanations of neural networks: Mapping the landscape of predictions. In Pro- ceedings of the 2019 AAAI/ACM Conference on AI, Ethics, and Society . 279–287
2019
-
[33]
Eser Kandogan. 2012. Just-in-time annotation of clusters, outliers, and trends in point-based data visualizations. In 2012 IEEE Conference on Visual Analytics Science and Technology (V AST). IEEE, 73–82
2012
-
[34]
Jacob Kauffmann, Malte Esders, Lukas Ruff, Grégoire Montavon, Wojciech Samek, and Klaus-Robert Müller. 2022. From clustering to cluster explanations via neural networks. IEEE Transactions on Neural Networks and Learning Systems35, 2 (2022), 1926–1940
2022
-
[35]
Daniel Kunkle, Donghui Zhang, and Gene Cooperman. 2008. Mining frequent generalized itemsets and generalized association rules without redundancy.Jour- nal of Computer Science and Technology 23, 1 (2008), 77–102
2008
-
[36]
Bum Chul Kwon, Ben Eysenbach, Janu Verma, Kenney Ng, Christopher De Filippi, Walter F Stewart, and Adam Perer. 2017. Clustervision: Visual supervision of unsupervised clustering. IEEE transactions on visualization and computer graphics 24, 1 (2017), 142–151
2017
-
[37]
Pantelis Linardatos, Vasilis Papastefanopoulos, and Sotiris Kotsiantis. 2021. Ex- plainable ai: A review of machine learning interpretability methods. Entropy 23, 1 (2021), 18
2021
-
[38]
Stuart Lloyd. 1982. Least squares quantization in PCM. IEEE transactions on information theory 28, 2 (1982), 129–137
1982
-
[39]
Wei-Yin Loh. 2011. Classification and regression trees. Wiley interdisciplinary reviews: data mining and knowledge discovery 1, 1 (2011), 14–23
2011
-
[40]
Scott M Lundberg and Su-In Lee. 2017. A unified approach to interpreting model predictions. Advances in neural information processing systems 30 (2017)
2017
-
[41]
Tim Miller. 2019. Explanation in artificial intelligence: Insights from the social sciences. Artificial intelligence 267 (2019), 1–38
2019
-
[42]
Michal Moshkovitz, Sanjoy Dasgupta, Cyrus Rashtchian, and Nave Frost. 2020. Explainable k-means and k-medians clustering. In International conference on machine learning. PMLR, 7055–7065
2020
-
[43]
Daniel Müllner. 2011. Modern hierarchical, agglomerative clustering algorithms. arXiv preprint arXiv:1109.2378 (2011)
2011 arXiv
-
[44]
Guillermo Navas-Palencia. 2020. Optimal binning: mathematical programming formulation. arXiv preprint arXiv:2001.08025 (2020)
2020 arXiv
-
[45]
The pandas development team. 2020. pandas-dev/pandas: Pandas. https://doi. org/10.5281/zenodo.3509134
2020 doi
-
[46]
Fabian Pedregosa, Gaël Varoquaux, Alexandre Gramfort, Vincent Michel, Bertrand Thirion, Olivier Grisel, Mathieu Blondel, Peter Prettenhofer, Ron Weiss, Vincent Dubourg, et al . 2011. Scikit-learn: Machine learning in Python. the Journal of machine Learning research 12 (2011), ...
2011
-
[47]
Why should i trust you?
Marco Tulio Ribeiro, Sameer Singh, and Carlos Guestrin. 2016. " Why should i trust you?" Explaining the predictions of any classifier. InProceedings of the 22nd ACM SIGKDD international conference on knowledge discovery and data mining . 1135–1144
2016
-
[48]
Marco Tulio Ribeiro, Sameer Singh, and Carlos Guestrin. 2018. Anchors: High- precision model-agnostic explanations. In Proceedings of the AAAI conference on artificial intelligence, Vol. 32
2018
-
[49]
Peter J Rousseeuw. 1987. Silhouettes: a graphical aid to the interpretation and validation of cluster analysis. Journal of computational and applied mathematics 20 (1987), 53–65
1987
-
[50]
Mirka Saarela and Susanne Jauhiainen. 2021. Comparison of feature importance measures as explanations for classification models. SN Applied Sciences 3, 2 (2021), 272
2021
-
[51]
Omer Sagi and Lior Rokach. 2018. Ensemble learning: A survey. Wiley interdis- ciplinary reviews: data mining and knowledge discovery 8, 4 (2018), e1249
2018
-
[52]
Vidya Setlur, Michael Correll, and Sarah Battersby. 2022. Oscar: A semantic- based data binning approach. In 2022 IEEE Visualization and Visual Analytics (VIS). IEEE, 100–104
2022
-
[53]
Avanti Shrikumar, Peyton Greenside, and Anshul Kundaje. 2017. Learning important features through propagating activation differences. In International Conference on Machine Learning . PMLR, 3145–3153
2017
-
[54]
Ramakrishnan Srikant and Rakesh Agrawal. 1997. Mining generalized association rules. Future generation computer systems 13, 2-3 (1997), 161–180
1997
-
[55]
Kritsada Sriphaew and Thanaruk Theeramunkong. 2002. A new method for finding generalized frequent itemsets in generalized association rule mining. In Proceedings ISCC 2002 Seventh International Symposium on Computers and Communications. IEEE, 1040–1045. 13
2002
-
[56]
Mukund Sundararajan, Ankur Taly, and Qiqi Yan. 2017. Axiomatic attribution for deep networks. In International Conference on Machine Learning . PMLR, 3319–3328
2017
-
[57]
Sariel Tutay and Amit Somech. 2023. https://github.com/analysis-bots/cluster- explorer
2023
-
[58]
Sariel Tutay and Amit Somech. 2023. Cluster-Explorer: An interactive Framework for Explaining Black-Box Clustering Results. In Proceedings of the 32nd ACM International Conference on Information and Knowledge Management . 5106–5110
2023
-
[59]
UC Irvine Machine Learning Repository. 2024. https://archive.ics.uci.edu/
2024
-
[60]
Ulrike Von Luxburg. 2007. A tutorial on spectral clustering. Statistics and computing 17 (2007), 395–416
2007
-
[61]
Danding Wang, Qian Yang, Ashraf Abdul, and Brian Y Lim. 2019. Designing theory-driven user-centric explainable AI. In Proceedings of the 2019 CHI confer- ence on human factors in computing systems . 1–15
2019
-
[62]
Haizhou Wang and Mingzhou Song. 2011. Ckmeans. 1d. dp: optimal k-means clustering in one dimension by dynamic programming. The R journal 3, 2 (2011), 29
2011
-
[63]
Jiazhi Xia, Linquan Huang, Weixing Lin, Xin Zhao, Jing Wu, Yang Chen, Ying Zhao, and Wei Chen. 2022. Interactive visual cluster analysis by contrastive dimensionality reduction. IEEE Transactions on Visualization and Computer Graphics 29, 1 (2022), 734–744
2022
-
[64]
Dongkuan Xu and Yingjie Tian. 2015. A comprehensive survey of clustering algorithms. Annals of Data Science 2, 2 (2015), 165–193
2015
-
[65]
Guizhen Yang. 2004. The complexity of mining maximal frequent itemsets and maximal frequent patterns. InProceedings of the tenth ACM SIGKDD international conference on Knowledge discovery and data mining . 344–353
2004
-
[66]
Xue Ying. 2019. An overview of overfitting and its solutions. InJournal of physics: Conference series, Vol. 1168. IOP Publishing, 022022
2019
-
[67]
Jun Yuan, Changjian Chen, Weikai Yang, Mengchen Liu, Jiazhi Xia, and Shixia Liu. 2021. A survey of visual analytics techniques for machine learning. Compu- tational Visual Media 7 (2021), 3–36
2021
-
[68]
Shichao Zhang, Chengqi Zhang, and Qiang Yang. 2003. Data preparation for data mining. Applied artificial intelligence 17, 5-6 (2003), 375–381
2003
-
[69]
Tian Zhang, Raghu Ramakrishnan, and Miron Livny. 1996. BIRCH: an efficient data clustering method for very large databases. ACM sigmod record 25, 2 (1996), 103–114
1996
-
[70]
Bolei Zhou, Aditya Khosla, Agata Lapedriza, Aude Oliva, and Antonio Torralba
-
[71]
Alexander Zien, Nicole Krämer, Sören Sonnenburg, and Gunnar Rätsch. 2009. The feature importance ranking measure. In Machine Learning and Knowledge Discovery in Databases: European Conference, ECML PKDD 2009, Bled, Slovenia, September 7-11, 2009, Proceedings, Part II 20 . Spri...
2009
-
[2016]
In Proceedings of the IEEE conference on computer vision and pattern recognition
Learning deep features for discriminative localization. In Proceedings of the IEEE conference on computer vision and pattern recognition . 2921–2929
Reviewed August 10, 2026 · model on record in the stance chip above.
Discussion (0). Continue with ORCID to comment.