REVIEW 2 major objections 5 minor 2 cited by
Unions with UNIONS: Using galaxy-galaxy lensing to probe galaxy mergers
T0 review · 2 major / 5 minor · reviewed 2026-08-09 · deepseek-v4-flash
Pith's one-line read Post-merger galaxies and non-merging controls show statistically indistinguishable weak-lensing profiles (p = 0.41), and the fitted halo models rule out starbursts forming more than 60% of the post-merger stellar mass at 95% confidence.
desk verdict A careful null lensing measurement of post-mergers, but the paper's 60% starburst upper limit is asserted without derivation and looks inconsistent with its own model mapping. read the letter →
The pith
A machine-rendered reading of the paper's core claim, the machinery that carries it, and where it could break.
The reading
What carries the argument
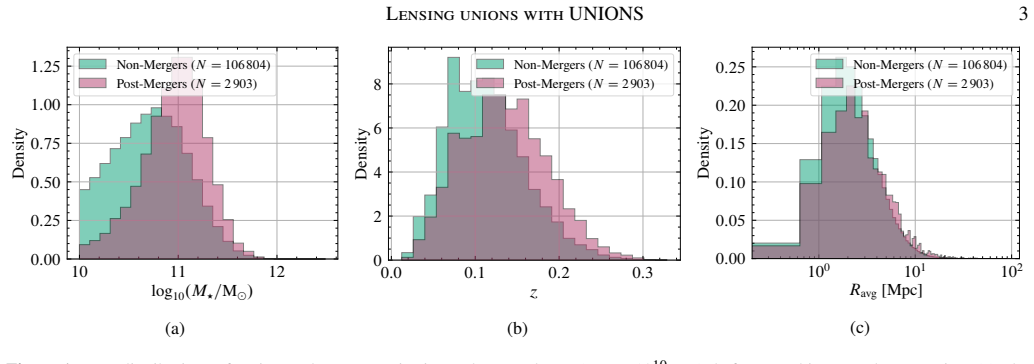
The central observable is the excess surface density profile ΔΣ(R), the projected mass-density contrast around a lens, measured by stacking the tangential shears of background galaxies from the UNIONS ShapePipe catalogue. The analysis weights the control sample to match the post-mergers in stellar mass, redshift, and geometric-mean distance to the three nearest neighbours, restricts both samples to low-density environments to suppress the two-halo term, applies boost-factor and random-subtraction corrections, and fits a two-component model: a fixed point-like stellar mass plus an NFW dark-matter halo with free M_halo and concentration c. The stellar-to-halo mass ratio derived from these fits carries the starburst constraint.
What would settle it
An independent post-merger sample of roughly 15,000 objects, selected without the Mummi classifier, should yield a statistically significant separation in ΔΣ(R) and an SHMR ratio R above 1 if massive merger-induced starbursts are common; if the current null is real, the same sample would tighten the 95% upper limit on the burst fraction to about 10% while keeping the two profiles consistent.
Extended reading notes
Core claim
Using galaxy-galaxy lensing excess surface density ΔΣ(R) measured around post-mergers and non-merger controls, the paper finds statistically indistinguishable lensing signals: the chi-square test over the full profile gives p = 0.41, and restricting to R ≤ 1 Mpc gives p = 0.34. Fitting a point-like stellar component plus an NFW dark-matter halo yields M_halo ≈ 4×$10^{12}$ M_sun for both samples, with a moderately negative correlation between M_halo and concentration, and the post-merger concentration is not significantly different from the control concentration. The derived stellar-to-halo mass ratio for post-mergers is 1.7% versus 2.96% for controls; interpreted with the Hudson et al. (2015) SHMR models, this rules out at 95% confidence a merger-induced starburst that forms more than 60% of the post-merger stellar mass. The paper concludes that weak lensing is a viable probe of merger properties and that a sample roughly ten times larger would be sensitive to starbursts at the ten percent level.
Load-bearing premise
Everything rests on the Mummi neural-network classifier, trained on IllustrisTNG mock images, having identified true post-mergers in UNIONS data with high purity and on those identified post-mergers being representative of the post-merger population; the paper does not correct for the selection bias that Mummi post-mergers have higher stellar masses and redshifts.
Editorial extensions
If this is right
- If the null signal is real, mergers do not, on average, produce markedly heavier dark-matter haloes or higher stellar fractions than non-merging galaxies of the same stellar mass and environment.
- The 95% confidence upper limit of about 60% on the starburst fraction directly constrains models of merger-induced star formation at stellar masses near 10^11 M_sun.
- With a post-merger sample roughly ten times larger, the same methodology is expected to detect the weak-lensing signatures of mergers and constrain starbursts at the ten percent level.
- The weighting and environment-control procedure provides a template for isolating merger effects from selection effects and environment in future lensing analyses.
Reading between the lines
- Beyond the paper, a direct test of the Mummi selection bias would be to rerun the analysis on post-mergers identified by an independent method, such as visual tidal-feature classification, and check whether the null ΔΣ result persists; if it does not, the current limit would apply only to the neural-network-selected subset.
- The low concentrations relative to dark-matter-only simulation predictions leave room for an alternative explanation that the paper only sketches; splitting the sample by satellite likelihood, using deeper spectroscopic data, would test whether satellite contamination inflates the low-concentration signal.
- An untested extension is to split post-mergers by time since coalescence: simulations predict the halo response decays over roughly a gigayear, so a stack spanning 0 to 1.7 Gyr may wash out a signal that finer time binning would reveal.
Signed reviews
Editorial analysis
A structured set of objections, weighed in public.
Referee Report
Summary. This paper measures galaxy-galaxy lensing around 1623 Mummi-selected post-mergers and roughly 30,000 matched non-merging controls drawn from UNIONS/SDSS. The samples are weighted to share stellar mass, redshift, and geometric-mean neighbour distance, and the excess surface density is estimated with boost correction, random subtraction, and jackknife uncertainties. Navarro-Frenk-White plus point-mass halo fits are performed to radii of 1 Mpc. The paper reports no significant difference between the two lensing profiles (chi-square p = 0.41), obtains similar halo masses of about 4 x 10^12 M_sun for both samples, and claims a 95% confidence upper limit of about 60% on the fraction of post-merger stellar mass formed in merger-induced starbursts.
Significance. If the starburst limit is correct, this is the first statistical weak-lensing constraint on merger-induced stellar mass growth, and the null lensing difference itself is a useful step for a sample this large. The matched-control weighting, random subtraction, boost correction, and jackknife covariance treatment are careful and largely transparent, and the paper makes its input catalogues publicly available. However, the headline quantitative claim, the 60% starburst upper limit, is not derived in the text and appears inconsistent with the paper's own numerical examples, so the significance of the central result currently rests on an unverified calculation.
major comments (2)
- [Section 4 / Abstract] The 95% upper limit on the starburst fraction is asserted without a posterior calculation. After Table 1 the text states, "Using the models from M. J. Hudson et al. (2015)... our results rule out extreme (≳60%) bursts of SF at the 95% confidence level," but no formula maps the fitted R = 0.58+0.53-0.28 to a burst fraction f, and no posterior for f is shown. This is load-bearing because the Introduction says a 20% burst gives R ≈ 1.6 and Section 4 says a 10% burst gives R ≈ 1.4, while a Gaussian approximation to the quoted R uncertainty would place the 95% upper bound on R near 1.2-1.5, not near the R ≈ 4 that a 60% burst would require under the same mapping. The authors should present the R posterior, the Hudson et al. model mapping, and the resulting posterior or upper limit on f, and then reconcile the quoted 60% limit with their own examples.
- [Section 2.1] The paper explicitly states that Mummi post-mergers tend toward higher stellar masses and redshifts and that no correction for this selection effect is attempted. Because the Abstract and Conclusions interpret the null lensing signal and the starburst limit as constraining "the merger process" generally, this selection effect is load-bearing. If the Mummi-selected sample is not representative of post-mergers as a whole, the constraints apply only to the selected class. The authors should either quantify the selection using the IllustrisTNG mocks or explicitly qualify the Abstract and Conclusions to state that the results apply to Mummi-selected post-mergers.
minor comments (5)
- [Figure 4 caption] The notations "ND30048:76" and "ND2903" appear to be LaTeX errors for N = 30048.76 and N = 2903; please fix these labels.
- [Section 3.5] The statement that stellar mass uncertainties from 10,000 bootstrap iterations are under 2% would benefit from a one-sentence description of the bootstrap procedure, such as the resampling unit and whether it was applied to each lens sample separately.
- [Figure 7 caption] The caption says the fit uses only data points not in the shaded region, but the shaded region is not labelled in the figure; please add a legend or explicitly state that the excluded points are those with R > 1.0 Mpc.
- [Section 4] For the comparison chi-square quoted as chi2_1,2 = 14.50 with p = 0.41, the number of degrees of freedom used should be stated; this is especially useful because the two profiles are compared using a covariance matrix that is not described in detail.
- [Throughout] There are several typographical and typesetting issues, including the caption "R ΔΣ" in Figure 6 and the repeated use of "ND" in figure captions; a careful proofread would improve readability.
Circularity Check
No significant circularity: the lensing measurement and NFW/SHMR fits are genuinely fitted, and the starburst comparison uses an external empirical SHMR model; the 60% upper limit is underived but not circular.
full rationale
The derivation chain is self-contained with respect to circularity. The Delta-Sigma profiles are measured from UNIONS ShapePipe sources around Mummi-selected post-mergers and matched controls (Section 3.4); the NFW halo mass and concentration are free parameters fitted by MCMC to those measurements (Section 3.5, Eq. 10), and the SHMR ratio is the ratio of the fitted M_star/M_halo values (Table 1), not a number forced to reproduce a target. The comparison to starburst fractions uses M. J. Hudson et al. (2015), an externally calibrated SHMR relation, and independent estimates from Ferreira et al. (2024a) and Reeves & Hudson (2024) that are cited as context rather than used to construct the lensing signal. Self-citations are present: Mummi/Ferreira et al. (2024b) supplies the lens catalogue, and Hudson et al. (2015) supplies the SHMR mapping, but both are external tools with stated training/data inputs, and neither is justified only by the present paper's conclusion. The only flagged weakness is that the 'extreme (≳60%) bursts' exclusion in Section 4 is stated without displaying the posterior over the burst fraction, so the numerical upper limit is not independently checkable from the text. That is a transparency/correctness gap, not a circular reduction, because the observed R = 0.58+0.53-0.28 is a fitted output rather than an input chosen to yield the 60% bound.
Assumptions & free parameters
free parameters (6)
- NFW halo mass M_halo, post-mergers =
7.3 +6.6 -3.4 x 10^12 M_sun
- NFW concentration c, post-mergers =
0.76 +1.04 -0.52
- NFW halo mass M_halo, controls =
4.05 +0.23 -0.22 x 10^12 M_sun
- NFW concentration c, controls =
3.74 +0.39 -0.34
- Isolation threshold R_avg > 2.25 Mpc =
2.25 Mpc
- Radial fit range R <= 1.0 Mpc =
R <= 1.0 Mpc
assumptions (6)
- domain assumption Flat LambdaCDM cosmology with H0=70, Omega_m=0.3, Omega_b=0.049, sigma8=0.81, ns=0.95
- domain assumption Single NFW halo plus point-like stellar mass describes the lensing signal for R <= 1.0 Mpc
- domain assumption Mummi classifier trained on IllustrisTNG mock images generalizes to real UNIONS galaxies with high purity
- domain assumption SOM-calibrated source redshift distribution n(z_s) is unbiased
- domain assumption Peculiar velocities are negligible when converting redshifts to 3D distances
- domain assumption Shape measurement bias is a few percent and is captured by the quoted uncertainties
Cite this review
Pith. "Pith review of Unions with UNIONS: Using galaxy-galaxy lensing to probe galaxy mergers." pith.science (2026). https://pith.science/paper/QALARO25
@misc{pith2026250200584,
  author       = {Pith},
  title        = {Pith review of: Unions with UNIONS: Using galaxy-galaxy lensing to probe galaxy mergers},
  year         = {2026},
  howpublished = {\url{https://pith.science/paper/QALARO25}},
  note         = {Machine review of arXiv:2502.00584}
}
abstract
We use galaxy-galaxy lensing to investigate how the dark matter (DM) haloes and stellar content of galaxies with $0.012 \leq z \leq 0.32$ and $10 \leq \log_{10}(M_\star/\mathrm{M}_\odot) \leq 12$ change as a result of the merger process. To this end, we construct two samples of galaxies obtained from the Ultraviolet Near Infrared Optical Northern Survey (UNIONS), comprising 1 623 post-mergers and $\sim$30 000 non-merging controls, that live in low-density environments to use as our lenses. These samples are weighted to share the same distributions of stellar mass, redshift, and geometric mean distance to a galaxy's three nearest neighbours to ensure differences in the lensing signal are due to the merger process itself. We do not detect a statistically significant difference in the excess surface density profile of post-mergers and non-merging controls with current data. Fitting haloes composed of a point-like stellar mass component and an extended DM structure described by a Navarro-Frenk-White profile to the lensing measurements yields, for both samples, halo masses of $M_\text{halo} \sim 4\times10^{12}\,\mathrm{M}_\odot$ and a moderately negative correlation between $M_\text{halo}$ and concentration $c$. This allows us to rule out, at the 95% confidence level, merger-induced starbursts in which more than 60% of the stellar mass is formed in the burst. The application of our methods to upcoming surveys that are able to provide samples $\sim$10$\times$ larger than our current catalogue are expected to detect the weak-lensing signatures of mergers and further constrain their properties.
Figures


Figures from the paper (4 more)


Forward citations
Cited by 2 Pith papers
-
Performance of morphological classifiers for galaxy mergers compared to current machine learning methods
Updated G-M20 and G-C morphological cuts achieve ~70% merger precision comparable to ML, with better high-z robustness, but only select pre-mergers.
-
Measuring satellite galaxy subhalo masses in redMaPPer clusters with UNIONS weak lensing data
A large UNIONS weak-lensing sample finds an increasing subhalo-to-stellar-mass ratio with cluster-centric radius in redMaPPer clusters, qualitatively confirming tidal stripping of satellite dark matter halos.
Reference graph
Works this paper leans on
-
[1]
2011, in Astronomical Society of the Pacific Conference
Bertin, E. 2011, in Astronomical Society of the Pacific Conference
work page 2011
-
[2]
Bertin, E., & Arnouts, S. 1996, A&AS, 117, 393, doi: 10.1051/aas:1996164 Lensing unions with UNIONS 13 Bickley,R.W.,Bottrell,C.,Hani,M.H.,etal.2021,MNRAS,504, 372, doi: 10.1093/mnras/stab806
-
[3]
Bottrell, C., Hani, M. H., Teimoorinia, H., et al. 2019, MNRAS, 490, 5390, doi: 10.1093/mnras/stz2934
-
[4]
Bottrell, C., Hani, M. H., Teimoorinia, H., et al. 2024,, Astrophysics Source Code Library, record ascl:2407.008
work page 2024
-
[6]
Bryan, G. L., & Norman, M. L. 1998, ApJ, 495, 80, doi: 10.1086/305262
doi:10.1086/305262 1998
-
[7]
Casteels, K. R. V., Conselice, C. J., Bamford, S. P., et al. 2014, MNRAS, 445, 1157, doi: 10.1093/mnras/stu1799
-
[8]
2003, PASP, 115, 763, doi: 10.1086/376392
Chabrier, G. 2003, PASP, 115, 763, doi: 10.1086/376392
doi:10.1086/376392 2003
-
[9]
2002, PhR, 372, 1, doi: 10.1016/S0370-1573(02)00276-4
Cooray, A., & Sheth, R. 2002, PhR, 372, 1, doi: 10.1016/S0370-1573(02)00276-4
Show all 66 references
-
[10]
J., Pontzen, A., & Crain, R
Davies, J. J., Pontzen, A., & Crain, R. A. 2022, MNRAS, 515, 1430, doi: 10.1093/mnras/stac1742
2022 doi
-
[11]
J., et al
Desai, S., Armstrong, R., Mohr, J. J., et al. 2012, ApJ, 757, 83, doi: 10.1088/0004-637X/757/1/83
2012 doi
-
[12]
2018, ApJS, 239, 35, doi: 10.3847/1538-4365/aaee8c Dogruel,M.B.,Taylor,E.N.,Cluver,M.,etal.2023,ApJ,953,45, doi: 10.3847/1538-4357/acde56
Diemer, B. 2018, ApJS, 239, 35, doi: 10.3847/1538-4365/aaee8c Dogruel,M.B.,Taylor,E.N.,Cluver,M.,etal.2023,ApJ,953,45, doi: 10.3847/1538-4357/acde56
2018 doi
-
[13]
L., Xu, C
Domingue, D. L., Xu, C. K., Jarrett, T. H., & Cheng, Y. 2009, ApJ, 695, 1559, doi: 10.1088/0004-637X/695/2/1559
2009 doi
-
[14]
2014, ApJ, 785, 57, doi: 10.1088/0004-637X/785/1/57
Du, W., & Fan, Z. 2014, ApJ, 785, 57, doi: 10.1088/0004-637X/785/1/57
2014 doi
-
[15]
A., Brinks, E., Wink, J
Duc, P. A., Brinks, E., Wink, J. E., & Mirabel, I. F. 1997, A&A, 326, 537
1997
-
[16]
R., Schaye, J., Kay, S
Duffy, A. R., Schaye, J., Kay, S. T., & Dalla Vecchia, C. 2008, MNRAS, 390, L64, doi: 10.1111/j.1745-3933.2008.00537.x
2008
-
[17]
R., Schaye, J., Kay, S
Duffy, A. R., Schaye, J., Kay, S. T., et al. 2010, MNRAS, 405, 2161, doi: 10.1111/j.1365-2966.2010.16613.x
2010
-
[18]
2024, The Open Journal of Astrophysics, 7, 121, doi: 10.33232/001c.127779
Ellison, S., Ferreira, L., Wild, V., et al. 2024, The Open Journal of Astrophysics, 7, 121, doi: 10.33232/001c.127779
2024 doi
-
[19]
L., Mendel, J
Ellison, S. L., Mendel, J. T., Patton, D. R., & Scudder, J. M. 2013, MNRAS, 435, 3627, doi: 10.1093/mnras/stt1562
2013 doi
-
[20]
L., Patton, D
Ellison, S. L., Patton, D. R., Simard, L., & McConnachie, A. W. 2008, AJ, 135, 1877, doi: 10.1088/0004-6256/135/5/1877
2008 doi
-
[21]
L., Wilkinson, S., Woo, J., et al
Ellison, S. L., Wilkinson, S., Woo, J., et al. 2022, MNRAS, 517, L92, doi: 10.1093/mnrasl/slac109
2022 doi
-
[22]
2022, A&A, 664, A141, doi: 10.1051/0004-6361/202243970
Farrens, S., Guinot, A., Kilbinger, M., et al. 2022, A&A, 664, A141, doi: 10.1051/0004-6361/202243970
2022 doi
- [23]
-
[24]
W., Ellison, S
Ferreira, L., Bickley, R. W., Ellison, S. L., et al. 2024b, MNRAS, 533, 2547, doi: 10.1093/mnras/stae1885
-
[25]
J., Rodriguez, F., Navarro-Gironés, D., et al
Gonzalez, E. J., Rodriguez, F., Navarro-Gironés, D., et al. 2023, MNRAS, 522, 5655, doi: 10.1093/mnras/stad1350
2023 doi
-
[26]
2022, A&A, 666, A162, doi: 10.1051/0004-6361/202141847 Gwyn,S.,McConnachie,A.W.,Cuillandre,J.-C.,etal.2025,arXiv e-prints, arXiv:2503.13783, doi: 10.48550/arXiv.2503.13783
Guinot, A., Kilbinger, M., Farrens, S., et al. 2022, A&A, 666, A162, doi: 10.1051/0004-6361/202141847 Gwyn,S.,McConnachie,A.W.,Cuillandre,J.-C.,etal.2025,arXiv e-prints, arXiv:2503.13783, doi: 10.48550/arXiv.2503.13783
-
[27]
2007, A&A, 464, 399, doi: 10.1051/0004-6361:20066170
Hartlap, J., Simon, P., & Schneider, P. 2007, A&A, 464, 399, doi: 10.1051/0004-6361:20066170
2007 doi
-
[28]
2015, MNRAS, 451, L95, doi: 10.1093/mnrasl/slv073
Harvey, D., & Courbin, F. 2015, MNRAS, 451, L95, doi: 10.1093/mnrasl/slv073
2015 doi
-
[30]
2012, MNRAS, 421, 2355, doi: 10.1111/j.1365-2966.2012.20468.x
Hildebrandt, H., Erben, T., Kuijken, K., et al. 2012, MNRAS, 421, 2355, doi: 10.1111/j.1365-2966.2012.20468.x
2012
-
[31]
F., Hernquist, L., Cox, T
Hopkins, P. F., Hernquist, L., Cox, T. J., et al. 2006, ApJS, 163, 1, doi: 10.1086/499298
2006 doi
-
[32]
J., Gillis, B
Hudson, M. J., Gillis, B. R., Coupon, J., et al. 2015, MNRAS, 447, 298, doi: 10.1093/mnras/stu2367
2015 doi
-
[33]
2015, ApJS, 221, 8, doi: 10.1088/0067-0049/221/1/8
Huertas-Company, M., Gravet, R., Cabrera-Vives, G., et al. 2015, ApJS, 221, 8, doi: 10.1088/0067-0049/221/1/8
2015 doi
- [34]
-
[35]
H., Penner, K., et al
Jogee, S., Miller, S. H., Penner, K., et al. 2009, ApJ, 697, 1971, doi: 10.1088/0004-637X/697/2/1971
2009 doi
-
[36]
2024, ApJ, 963, 37, doi: 10.3847/1538-4357/ad18cb
Kado-Fong, E., Robinson, A., Nyland, K., et al. 2024, ApJ, 963, 37, doi: 10.3847/1538-4357/ad18cb
2024 doi
-
[37]
M., White, S
Kauffmann, G., Heckman, T. M., White, S. D. M., et al. 2003, MNRAS, 341, 33, doi: 10.1046/j.1365-8711.2003.06291.x
2003
-
[38]
1992, Journal of Official Statistics, 8, 183
Kish, L. 1992, Journal of Official Statistics, 8, 183
1992
-
[39]
H., Cisternas, M., & Querejeta, M
Knapen, J. H., Cisternas, M., & Querejeta, M. 2015, MNRAS, 454, 1742, doi: 10.1093/mnras/stv2135
2015 doi
-
[40]
1982, Biological Cybernetics, 43, 59, doi: 10.1007/bf00337288
Kohonen, T. 1982, Biological Cybernetics, 43, 59, doi: 10.1007/bf00337288
1982 doi
-
[41]
2022,, Astrophysics Source Code Library, record ascl:2204.006
Lange, J., & Huang, S. 2022,, Astrophysics Source Code Library, record ascl:2204.006
2022
-
[42]
2024, ApJL, 969, L25, doi: 10.3847/2041-8213/ad58b0
Li, Q., Kilbinger, M., Luo, W., et al. 2024, ApJL, 969, L25, doi: 10.3847/2041-8213/ad58b0
2024 doi
-
[43]
L., et al
Liaudat, T., Bonnin, J., Starck, J. L., et al. 2021, A&A, 646, A27, doi: 10.1051/0004-6361/202039584 Macciò, A. V., Dutton, A. A., van den Bosch, F. C., et al. 2007, MNRAS, 378, 55, doi: 10.1111/j.1365-2966.2007.11720.x
2021
-
[45]
J., Armstrong, R., Bertin, E., et al
Mohr, J. J., Armstrong, R., Bertin, E., et al. 2012, in Software and Cyberinfrastructure for Astronomy II, Vol. 8451, SPIE, 121–132
2012
-
[46]
L., et al
Moreno, J., Torrey, P., Ellison, S. L., et al. 2019, MNRAS, 485, 1320, doi: 10.1093/mnras/stz417
2019 doi
-
[47]
2019, Computational Astrophysics and Cosmology, 6, 2, doi: 10.1186/s40668-019-0028-x
Nelson, D., Springel, V., Pillepich, A., et al. 2019, Computational Astrophysics and Cosmology, 6, 2, doi: 10.1186/s40668-019-0028-x
2019 doi
-
[48]
R., & Atfield, J
Patton, D. R., & Atfield, J. E. 2008, ApJ, 685, 235, doi: 10.1086/590542 14 I. Cheng et al
2008 doi
-
[49]
R., Faria, L., Hani, M
Patton, D. R., Faria, L., Hani, M. H., et al. 2024, MNRAS, 529, 1493, doi: 10.1093/mnras/stae608
2024 doi
-
[50]
Tak, F. F. S. 2019a, A&A, 626, A49, doi: 10.1051/0004-6361/201935355
-
[51]
J., Wang, L., Alpaslan, M., et al
Pearson, W. J., Wang, L., Alpaslan, M., et al. 2019b, A&A, 631, A51, doi: 10.1051/0004-6361/201936337
-
[52]
2022, PhRvD, 105, 083528, doi: 10.1103/PhysRevD.105.083528
Prat, J., Blazek, J., Sánchez, C., et al. 2022, PhRvD, 105, 083528, doi: 10.1103/PhysRevD.105.083528
2022 doi
-
[53]
Reeves, A. M. M., & Hudson, M. J. 2024, MNRAS, 527, 2037, doi: 10.1093/mnras/stad3211
2024 doi
-
[54]
R., Bell, E
Robaina, A. R., Bell, E. F., Skelton, R. E., et al. 2009, ApJ, 704, 324, doi: 10.1088/0004-637X/704/1/324
2009 doi
-
[55]
C., & Courteau, S
Roediger, J. C., & Courteau, S. 2015, MNRAS, 452, 3209, doi: 10.1093/mnras/stv1499
2015 doi
-
[56]
S., Snyder, G
Rose, C., Kartaltepe, J. S., Snyder, G. F., et al. 2024, ApJL, 976, L8, doi: 10.3847/2041-8213/ad8dd4
2024 doi
-
[57]
B., Soifer, B
Sanders, D. B., Soifer, B. T., Elias, J. H., et al. 1988, ApJ, 325, 74, doi: 10.1086/165983
1988 doi
-
[58]
A., Kartaltepe, J
Shah, E. A., Kartaltepe, J. S., Magagnoli, C. T., et al. 2022, ApJ, 940, 4, doi: 10.3847/1538-4357/ac96eb
2022 doi
-
[59]
J., Anbajagane, D., & Chang, C
Shao, M. J., Anbajagane, D., & Chang, C. 2023, MNRAS, 523, 3258, doi: 10.1093/mnras/stad1620 Sheldon,E.S.,Johnston,D.E.,Frieman,J.A.,etal.2004,AJ,127, 2544, doi: 10.1086/383293
2023 doi
-
[60]
2005, MNRAS, 361, 776, doi: 10.1111/j.1365-2966.2005.09238.x
Springel, V., Di Matteo, T., & Hernquist, L. 2005, MNRAS, 361, 776, doi: 10.1111/j.1365-2966.2005.09238.x
2005
-
[61]
A., Weinberg, D
Strauss, M. A., Weinberg, D. H., Lupton, R. H., et al. 2002, AJ, 124, 1810, doi: 10.1086/342343
2002 doi
-
[62]
2010, A&A, 514, A102, doi: 10.1051/0004-6361/200913687
Tago, E., Saar, E., Tempel, E., et al. 2010, A&A, 514, A102, doi: 10.1051/0004-6361/200913687
2010 doi
-
[63]
R., et al
Wang, K., Mao, Y.-Y., Zentner, A. R., et al. 2020, MNRAS, 498, 4450, doi: 10.1093/mnras/staa2733
2020 doi
- [64]
-
[65]
L., Bottrell, C., et al
Wilkinson, S., Ellison, S. L., Bottrell, C., et al. 2024, MNRAS, 528, 5558, doi: 10.1093/mnras/stae287
2024 doi
-
[66]
H., Hildebrandt, H., van den Busch, J
Wright, A. H., Hildebrandt, H., van den Busch, J. L., & Heymans, C. 2020, A&A, 637, A100, doi: 10.1051/0004-6361/201936782
2020 doi
-
[67]
K., Zhao, Y., Scoville, N., et al
Xu, C. K., Zhao, Y., Scoville, N., et al. 2012, ApJ, 747, 85, doi: 10.1088/0004-637X/747/2/85
2012 doi
-
[68]
J., van den Bosch, F
Yang, X., Mo, H. J., van den Bosch, F. C., et al. 2006, MNRAS, 373, 1159, doi: 10.1111/j.1365-2966.2006.11091.x
2006
-
[69]
2018, MNRAS, 481, 1149, doi: 10.1093/mnras/sty2219
Zuntz, J., Sheldon, E., Samuroff, S., et al. 2018, MNRAS, 481, 1149, doi: 10.1093/mnras/sty2219
2018 doi
Reviewed August 9, 2026 · model on record in the stance chip above.
Discussion (0). Continue with ORCID to comment.