REVIEW 3 major objections 3 minor 30 references
Effects of Radiation in Accretion Regions of Classical T Tauri Stars: Pre-heating of accretion column in non-LTE regime
T0 review · 3 major / 3 minor · reviewed 2026-08-14 · deepseek-v4-flash
Pith's one-line read This paper argues that radiation from shock-heated plasma in Classical T Tauri accretion columns is substantially absorbed by the infalling pre-shock gas, heating it to about $10^5$ K and forming a UV-bright radiative precursor.
desk verdict First self-consistent non-LTE RHD simulation of CTTS accretion shows a radiative precursor with a helium-driven temperature jump; the qualitative effect is solid, but the 70% absorption and UV-reprocessing claims rest on a gray opacity that is not checked against the actual post-shock spectrum. read the letter →
The pith
A machine-rendered reading of the paper's core claim, the machinery that carries it, and where it could break.
The reading
What carries the argument
The load-bearing machinery is a radiation-hydrodynamics model built around the flux-limited diffusion (FLD) approximation, with frequency-integrated Planck and Rosseland mean opacities and non-LTE radiative-loss tables computed at the local density and temperature. The radiation source terms (absorption proportional to $\rho k_P c E$ and losses $L$) are coupled self-consistently to the hydrodynamic conservation equations, with thermal conduction treated in the classical and saturated regimes. The critical element within the opacities is a peak in the Planck mean near $\log T\approx 4.8$ caused by helium, which produces the sudden increase in absorbed radiation that lifts the precursor to about $10^5$ K; removing helium drops the precursor to $5\times 10^4$ K. A companion optically thin run using only radiative losses provides the contrast that isolates absorption as the cause of the precursor.
What would settle it
Run the same accretion-impact setup using an M1 radiation-transport scheme or frequency-dependent opacities and compare the absorbed fraction and precursor temperature; if the 70% absorption and the $10^5$ K peak do not survive, the model's quantitative claim fails. Observationally, a high-sensitivity UV spectrum of a CTTS accretion column should show an emission-measure peak near $\log T \approx 5.0$ from the precursor if the claim is right.
Extended reading notes
Core claim
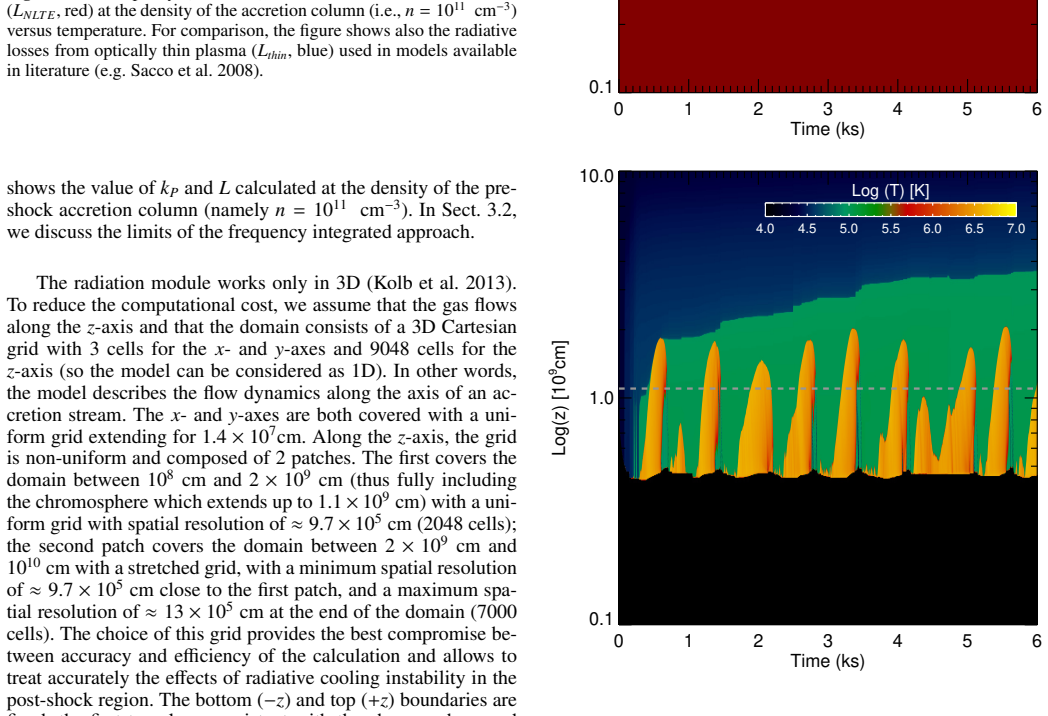
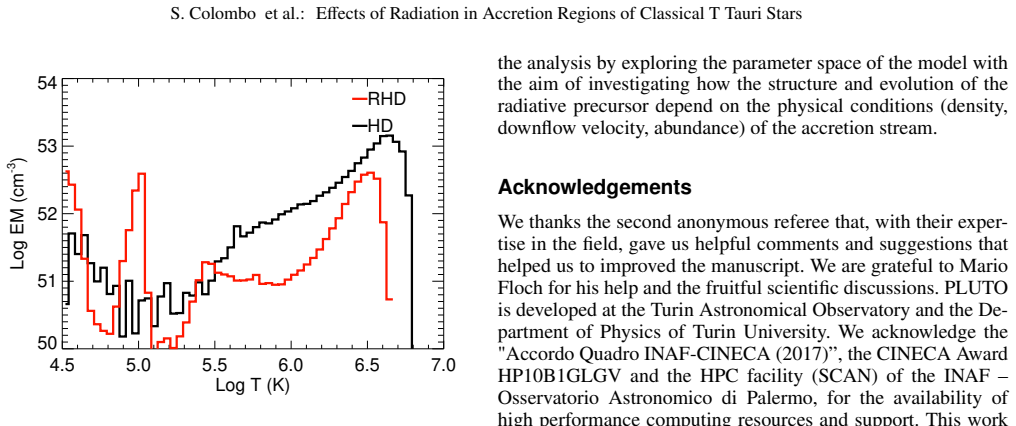
The central discovery, stated on the paper's own terms, is a radiative precursor in the accretion column of a Classical T Tauri star. In a one-dimensional radiation-hydrodynamics simulation of a column with density $n\approx 10^{11}\,\mathrm{cm}^{-3}$ falling at 500 km/s onto a chromosphere, the post-shock slab reaches a few million K, and about 70% of its radiation is absorbed by the optically thick pre-shock gas at heights up to $z\approx 4\times 10^9$ cm. The infalling material heats gradually to about $6\times 10^4$ K and then jumps to roughly $10^5$ K, governed by a peak in the Planck opacity near $\log T\approx 4.8$ that is attributed to helium. A control run without radiative absorption shows no precursor, and a run with helium removed from the opacities reaches only $5\times 10^4$ K, so helium's opacity peak is the mechanism that shapes and caps the precursor temperature. The resulting emission-measure distribution has peaks near $\log T\approx 4.5$ and $5.0$ from the precursor, features that are absent in the optically thin case.
Load-bearing premise
The quantitative results rest on the flux-limited diffusion approximation with opacities averaged over all frequencies; if that treatment misrepresents how the post-shock X-ray and UV radiation is absorbed, the predicted 70 percent fraction and the $10^5$ K precursor temperature could shift.
Editorial extensions
If this is right
- Pre-shock accretion columns in Classical T Tauri stars are not cold; they heat to about $10^5$ K immediately above the shock, forming a radiative precursor comparable in size to the post-shock slab.
- About 70% of the post-shock radiation is absorbed in the pre-shock column and re-emitted in the UV, so UV and X-ray diagnostics sample different parts of the accretion energy budget.
- The emission-measure versus temperature distribution gains peaks near $\log T\approx 4.5$ and $5.0$ that are absent in optically thin models, giving an observable signature of the precursor.
- The helium opacity peak near $\log T\approx 4.8$ is essential: without helium, the precursor reaches only $5\times 10^4$ K instead of $10^5$ K.
- Absorption of X-rays by the precursor and its UV re-emission can explain why accretion rates derived from UV observations are systematically larger than those inferred from X-rays.
Reading between the lines
- A direct extension the authors do not pursue: because the precursor temperature is set by a helium opacity peak, accretion streams with different helium abundances should show different UV precursor brightness, which is testable by comparing stars with measured abundances.
- The same absorption-and-reprocessing mechanism should operate in other accreting systems with optically thick pre-shock columns, such as magnetic cataclysmic variables; a $10^5$ K UV precursor could be searched for in their spectra.
- If the precursor radiates strongly in UV lines, time-resolved spectroscopy of individual accretion spots might reveal variability tied to the slab's expansion-collapse cycle, even if the whole-stream emission is smeared out by multiple independent fibrils.
Signed reviews
Editorial analysis
A structured set of objections, weighed in public.
Referee Report
Summary. The paper presents 1D radiation-hydrodynamic simulations of an accretion column impacting a Classical T Tauri star, with radiation transport treated in the flux-limited diffusion (FLD) approximation using frequency-integrated, non-LTE Planck and Rosseland opacities from Rodríguez et al. (2018). The central simulation (run RHD) shows that radiation from the post-shock slab is partially absorbed by the pre-shock accretion column, heating it from 2×10^4 K to about 10^5 K and creating a radiative precursor. The paper reports that about 70% of the slab radiation is absorbed and re-emitted in the UV band, and argues that this reprocessing may explain why UV-derived accretion rates exceed X-ray-derived rates. A comparison run without absorption (HD) and a helium-removed run (RHD-He, Appendix B) support the qualitative picture that absorption, particularly the helium opacity peak near log T=4.8, drives the precursor.
Significance. The qualitative result — that absorption of post-shock radiation pre-heats the accretion column and forms a radiative precursor — is physically plausible, relevant to CTTS accretion models, and represents an incremental but useful advance over earlier iterative treatments (Costa et al. 2017) because the radiation is coupled self-consistently to the hydrodynamics. The paper benefits from the independent non-LTE opacity tables, the clearly described numerical implementation, and the helium-removal test that identifies the specific opacity feature responsible for the sharp temperature jump. However, the quantitative claims (70% absorption, 10^5 K peak) and the spectral interpretation (UV re-emission) rest on a gray treatment whose key limitation — the use of the Planck mean opacity at the local gas temperature rather than at the radiation temperature — is not addressed. If the central result holds, it would motivate multi-dimensional and multi-frequency studies of accretion shocks; the current manuscript establishes plausibility but not the quantitative predictions.
major comments (3)
- [§2, Eq. (4); §3.2] The absorption rate is computed as c ρ k_P E, where the Planck mean opacity k_P is evaluated at the local gas temperature and density. In the region just above the post-shock slab, the gas temperature is T≈2×10^4 K, so k_P(T_gas) is weighted by a Planck function peaking in the infrared, while the radiation energy E being absorbed is dominated by the ~3×10^6 K post-shock emission. The correct effective opacity for the incident radiation is a radiation-temperature- or flux-weighted mean, which can differ from k_P(T_gas) by orders of magnitude. The manuscript acknowledges the frequency-integrated nature of the opacities, but it does not acknowledge or test this spectral mismatch. Consequently, the quantitative claims of ≈70% absorption and a precursor temperature near 10^5 K are not established by the simulation as presented, because the coupling between the slab's X-ray/UV photons and the pre-shock gas is computed with a spectral weighting that is not appropriate for the incoming radiation field.
- [§4 and Abstract] The conclusion that the absorbed radiation is 're-emitted in the UV band' is not supported by the frequency-integrated model. A gray radiation transport calculation contains no information about the spectral distribution of either the absorbed or re-emitted radiation, so the statement that the precursor is a strong source of UV emission and the subsequent reconciliation of UV and X-ray accretion-rate estimates are inferences from a single integrated opacity coefficient, not outputs of the simulation. This claim should either be removed or qualified, or demonstrated with a frequency-dependent or multi-band radiation treatment.
- [§3.2 (Figs. 4 and 5)] The comparison between runs RHD and HD does not isolate the effect of absorption because the two runs also use different radiative loss functions: run RHD uses the non-LTE losses L_NLTE from the look-up tables, while run HD uses the optically thin losses L_thin from Sacco et al. (2008). As shown in Fig. 2, these loss functions differ substantially across the temperature range of interest. Thus the differences in the temperature profiles and emission-measure distributions between RHD and HD could be partly attributable to the different cooling rates rather than to absorption alone. A control run using the non-LTE losses but with absorption disabled is needed to support the attribution of the precursor and the EM peaks to radiative absorption.
minor comments (3)
- [§2] The main text states that two simulations are presented, but a third run (RHD-He) is described in Appendix B. It would be clearer to introduce this run in Section 2 alongside the two main runs.
- [§3.2] The phrase 'absorbs ≈70% of radiation immediately above the slab at an height of z=4×10^9 cm from the chromosphere' is ambiguous: it is unclear whether this is the fraction of the slab radiation that is absorbed in the column up to that height, at that height, or after that height. The definition should be stated explicitly.
- [Appendix A] The argument that M1 transport would not change the results is plausible for the radiation force and shadows, but it does not address the spectral mismatch of the gray Planck mean opacity discussed in my major comment 1. The limitation discussion should be extended to include this point.
Circularity Check
No circularity: the precursor and 70% absorption are simulation outputs from externally tabulated opacities and an explicit RHD equation set, not fitted inputs or a self-citation chain.
full rationale
The paper's central claims are produced by integrating the coupled radiation-hydrodynamics equations (Eqs. 1-7) with non-LTE opacity look-up tables from Rodríguez et al. (2018), an external published computation. The 70% absorption fraction and 10^5 K precursor temperature are not fitted parameters renamed as predictions; they emerge from the time-dependent simulation. The comparison HD run without radiative absorption is an external baseline that isolates the radiation effect. The only self-citations are to the companion Paper I (Colombo et al. 2019a) for the radiation module's implementation details and to prior models, but the present paper states the equations, the flux-limited diffusion form (Eq. 5), and the gray, frequency-integrated approach (Sect. 2, Appendix A) explicitly, so no load-bearing argument reduces to an unverified self-citation. The helium opacity peak at log T≈4.8 (Fig. 2, Appendix B) is an input from the opacity tables; the precursor's temperature structure is a consequence of solving the equations with that input, not a restatement of it. The gray FLD approximation and the use of Planck-mean opacity evaluated at the local gas temperature are genuine modeling limitations that could affect the quantitative accuracy of the 70% fraction and UV-band interpretation, but these are physical/correctness caveats, not circularity: the result is not equivalent to its inputs by construction.
Assumptions & free parameters
free parameters (5)
- Pre-shock column density =
10^11 cm^-3
- Infall velocity =
500 km/s
- Pre-shock gas temperature =
2 x 10^4 K
- Chromosphere temperature =
10^4 K
- Mass accretion rate for EM synthesis =
10^-9.17 M_sun/yr
assumptions (5)
- domain assumption Flux-limited diffusion (FLD) is an adequate radiation transport approximation
- domain assumption Frequency-integrated (gray) opacities and radiative losses are valid
- domain assumption Non-LTE opacity look-up tables apply to the accreting plasma
- domain assumption Radiation effects in the chromosphere are negligible
- domain assumption A 1D column captures the relevant physics
Cite this review
Pith. "Pith review of Effects of Radiation in Accretion Regions of Classical T Tauri Stars: Pre-heating of accretion column in non-LTE regime." pith.science (2026). https://pith.science/paper/QH7R5SEO
@misc{pith2026190806799,
  author       = {Pith},
  title        = {Pith review of: Effects of Radiation in Accretion Regions of Classical T Tauri Stars: Pre-heating of accretion column in non-LTE regime},
  year         = {2026},
  howpublished = {\url{https://pith.science/paper/QH7R5SEO}},
  note         = {Machine review of arXiv:1908.06799}
}
abstract
Models and observations indicate that the impact of matter accreting onto the surface of young stars produces regions at the base of accretion columns, in which optically thin and thick plasma components coexist. Thus an accurate description of these impacts requires to account for the effects of absorption and emission of radiation. We study the effects of radiation emerging from shock-heated plasma in impact regions on the structure of the pre-shock downfalling material. We investigate if a significant absorption of radiation occurs and if it leads to a pre-shock heating of the accreting gas. We developed a radiation hydrodynamics model describing an accretion column impacting onto the surface of a Classical T Tauri Star. The model takes into account the stellar gravity, the thermal conduction, and the effects of both radiative losses and absorption of radiation by matter in the non local thermodynamic equilibrium regime. After the impact, a hot slab of post-shock plasma develops at the base of the accretion column. Part of radiation emerging from the slab is absorbed by the pre-shock accreting material. As a result, the pre-shock accretion column gradually heats up to temperatures of $10^5$ K, forming a radiative precursor of the shock. The precursor has a thermal structure with the hottest part at $T \approx 10^5$ K, with size comparable to that of the hot slab, above the post-shock region. At larger distances the temperature gradually decreases to $T \approx 10^4$ K.
Figures


Figures from the paper (3 more)


Reference graph
Works this paper leans on
-
[1]
Alexiades, V ., Amiez, G., & Gremaud, P. A. 1996, Communications in Numeri- cal Methods in Engineering, 12, 31 Argiroffi, C., Maggio, A., & Peres, G. 2007, A&A, 465, L5
work page 1996
- [2]
- [3]
-
[4]
Bouvier, J., Alencar, S. H. P., Harries, T. J., Johns-Krull, C. M., & Romanova, M. M. 2007, Protostars and Planets V , 479
work page 2007
-
[5]
Busschaert, C., Falize, É., Michaut, C., Bonnet-Bidaud, J. M., & Mouchet, M. 2015, A&A, 579, A25
work page 2015
- [6]
-
[7]
1990, in Reviews in Modern Astronomy, V ol
Camenzind, M. 1990, in Reviews in Modern Astronomy, V ol. 3, Reviews in Modern Astronomy, ed. G. Klare, 234–265
work page 1990
-
[8]
Non-LTE radiation hydrodynamics in PLUTO
Colombo, S., Ibgui, L., Orlando, S., et al. 2019a, A&A, in press, ArXiv http://arxiv.org/abs/1907.04591
work page Pith review arXiv 1907
Show all 30 references
-
[9]
2016, A&A, 594, A93
Colombo, S., Orlando, S., Peres, G., Argiroffi, C., & Reale, F. 2016, A&A, 594, A93
2016
-
[10]
2017, A&A, 597, A1
Costa, G., Orlando, S., Peres, G., Argiro ffi, C., & Bonito, R. 2017, A&A, 597, A1
2017
-
[11]
L., Argiroffi, C., Sacco, G
Curran, R. L., Argiroffi, C., Sacco, G. G., et al. 2011, A&A, 526, A104 de Sá, L., Chièze, J.-P., Stehlé, C., et al. 2019, arXiv e-prints, arXiv:1904.09156 González, M., Audit, E., & Huynh, P. 2007, A&A, 464, 429 Günther, H. M., Schmitt, J. H. M. M., Robrade, J., & Liefke, C. 20...
2011 arXiv
-
[12]
Hayes, J. C. & Norman, M. L. 2003, ApJS, 147, 197
2003
-
[13]
1991, ApJ, 370, L39
Koenigl, A. 1991, ApJ, 370, L39
1991
-
[14]
M., Stute, M., Kley, W., & Mignone, A
Kolb, S. M., Stute, M., Kley, W., & Mignone, A. 2013, A&A, 559, A80
2013
-
[15]
Lamzin, S. A. 1998, Astronomy Reports, 42, 322
1998
-
[16]
L., Ferland, G
Lykins, M. L., Ferland, G. J., Porter, R. L., et al. 2013, MNRAS, 429, 3133
2013
-
[17]
& Aringer, B
Marigo, P. & Aringer, B. 2009, A&A, 508, 1539
2009
-
[18]
2013, A&A, 557, A69
Matsakos, T., Chièze, J.-P., Stehlé, C., et al. 2013, A&A, 557, A69
2013
-
[19]
2007, ApJS, 170, 228
Mignone, A., Bodo, G., Massaglia, S., et al. 2007, ApJS, 170, 228
2007
-
[20]
Minerbo, G. N. 1978, Journal of Quantitative Spectroscopy and Radiative Trans- fer, 20, 541
1978
-
[21]
M., Van Box Som, L., et al
Mouchet, M., Bonnet-Bidaud, J. M., Van Box Som, L., et al. 2017, A&A, 600, A53
2017
-
[22]
2013, A&A, 559, A127
Orlando, S., Bonito, R., Argiroffi, C., et al. 2013, A&A, 559, A127
2013
-
[23]
2005, A&A, 444, 505
Orlando, S., Peres, G., Reale, F., et al. 2005, A&A, 444, 505
2005
-
[24]
2011, MNRAS, 415, 3380
Orlando, S., Reale, F., Peres, G., & Mignone, A. 2011, MNRAS, 415, 3380
2011
-
[25]
G., Argiroffi, C., et al
Orlando, S., Sacco, G. G., Argiroffi, C., et al. 2010, A&A, 510, A71
2010
-
[26]
2013, Science, 341, 251
Reale, F., Orlando, S., Testa, P., et al. 2013, Science, 341, 251
2013
-
[27]
N., Bonito, R., et al
Revet, G., Chen, S. N., Bonito, R., et al. 2017, Science Advances, 3, no.11, e1700982 Article number, page 5 of 6 A&A proofs: manuscript no. aanda Rodríguez, R., Espinosa, G., & Gil, J. M. 2018, Phys. Rev. E, 98, 033213
2017
-
[28]
1981, Journal of Computational Physics, 43, 357
Roe, P. 1981, Journal of Computational Physics, 43, 357
1981
-
[29]
G., Argiroffi, C., Orlando, S., et al
Sacco, G. G., Argiroffi, C., Orlando, S., et al. 2008, A&A, 491, L17
2008
-
[30]
G., Orlando, S., Argiroffi, C., et al
Sacco, G. G., Orlando, S., Argiroffi, C., et al. 2010, A&A, 522, A55 Van Box Som, L., Falize, É., Bonnet-Bidaud, J. M., et al. 2018, MNRAS, 473, 3158 Zel’dovich, Y . B. & Raizer, Y . P. 1967, Physics of shock waves and high-temperature hydrodynamic phenomena (New York: Academic ...
2010
Reviewed August 14, 2026 · model on record in the stance chip above.
Discussion (0). Continue with ORCID to comment.