REVIEW 4 major objections 4 minor 46 references
The final WaZP galaxy cluster catalog of the Dark Energy Survey and comparison with SZE data
T0 review · 4 major / 4 minor · reviewed 2026-08-06 · deepseek-v4-flash
Pith's one-line read WaZP, a red-sequence-free cluster finder applied to six years of Dark Energy Survey data, yields over 400,000 clusters, and its cross-match with SPT and ACT shows essentially all Sunyaev-Zel'dovich clusters in the overlap have a WaZP…
desk verdict A carefully validated final DES-Y6 WaZP catalog with a large, honest SZE cross-match; the redshift-based validation has a partial circularity worth fixing, but the catalog itself is a solid resource. read the letter →
The pith
A machine-rendered reading of the paper's core claim, the machinery that carries it, and where it could break.
The reading
What carries the argument
The carrying object is the WaZP (Wavelet Z-Photometric) cluster finder. It builds pixelized galaxy density maps in slices of photometric redshift, weights each galaxy by its redshift probability, extracts wavelet-based overdensity peaks, and merges peaks across slices; no red-sequence assumption enters. Membership probabilities are assigned from cluster-centric distance, magnitude, and photometric redshift following the Castignani & Benoist prescription, and richness $N_{\mathrm{gals}}$ is the sum of those probabilities for members brighter than $m^*(z)+1.5$. This machinery does the work because it produces the independent optical detections whose angular and redshift agreement with SPT and ACT validates the catalog, and because the same member assignments feed the redshift estimates, the centering analysis, and the multiplicity measurement.
What would settle it
Run the same redshift and multiplicity analysis using only SZE clusters with genuine spectroscopic redshifts, roughly one third of the sample. If the consistent-pair fraction stays near 93% and the multiplicity fraction stays at 15-20%, the paper's redshift-based validation survives; if the numbers drop substantially, the apparent agreement is partly inherited from the shared optical photo-z assignment used for the SZE redshifts.
Extended reading notes
Core claim
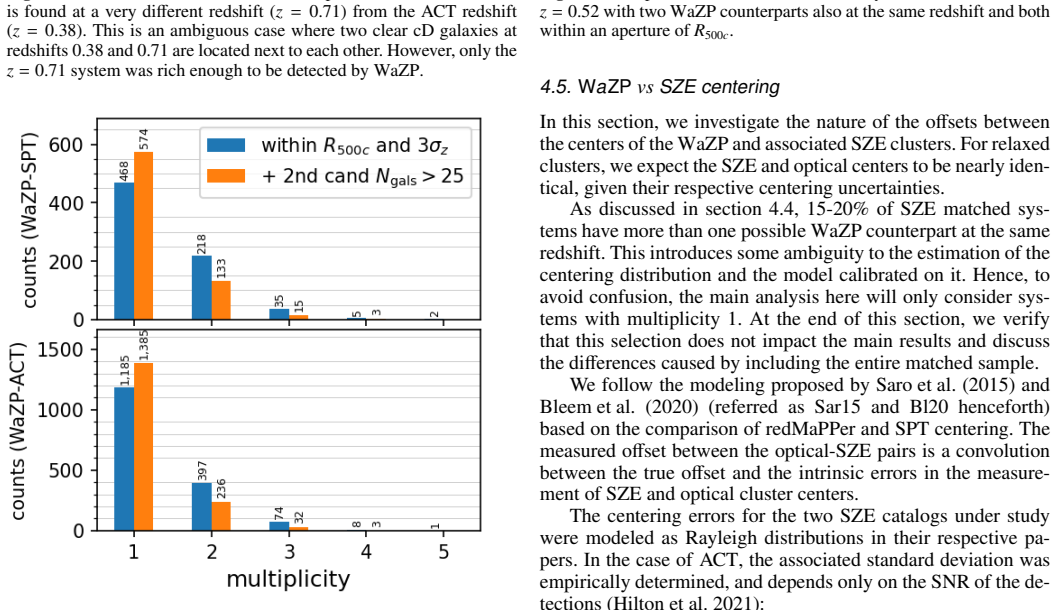
The central claim is that the DES-Y6 WaZP catalog is both large and independently confirmed. Using only angular proximity for the cross-match, the paper recovers a WaZP counterpart for essentially every SPT and ACT SZE cluster that lies within the DES-Y6 footprint, has adequate local coverage, and sits below the local depth limit; 801 of 816 SPT clusters and 1842 of 1873 ACT clusters are matched. Going the other way, the fraction of WaZP clusters with an SZE counterpart rises with richness and exceeds 90% above $N_{\mathrm{gals}} \simeq 150$ in the deeper SZE regions. The paper further claims that WaZP cluster redshifts are accurate to a scatter of 1.4% and an offset of 0.2%, with no bias against SZE spectroscopic redshifts, and that 15-20% of SZE-matched systems contain more than one WaZP counterpart at the same redshift within the SZE $R_{500c}$, which it reads as evidence of interacting or unrelaxed systems.
Load-bearing premise
The redshift-consistency and multiplicity claims lean on SZE redshifts that, for the majority of SZE clusters, were assigned by cross-matching the millimeter detection to optical cluster catalogs; if those redshifts inherit the same optical selection or richness biases as WaZP, then the 93% consistency and the 15-20% multiplicity rate are not independent validations, although the angular matching rates do not depend on this assumption.
Editorial extensions
If this is right
- The full 416,947-cluster catalog and the 33,000-cluster cosmology subsample provide a red-sequence-independent sample large enough for cluster abundance measurements over 4,545 deg^2.
- The near-complete recovery of SZE clusters implies WaZP selection is essentially complete for massive systems within the DES-Y6 depth limits, so the catalog can be used to calibrate richness-mass relations against SZE and X-ray mass proxies.
- The 15-20% multiplicity among SZE-matched systems means any cosmology analysis using this catalog must account for a substantial population of clusters that appear as two optical concentrations inside one SZE radius.
- The measured redshift scatter of 1.4% and offset of 0.2% support using WaZP photometric redshifts as cluster redshifts out to $z\sim1$ for statistical studies.
Reading between the lines
- Inference: comparing WaZP member lists with a red-sequence-based finder on the same data could quantify how much the red-sequence assumption biases richness and photo-z estimates at high redshift.
- Inference: the 15-20% of SZE systems with multiple WaZP counterparts are natural targets for X-ray or dynamical follow-up, and optical multiplicity may provide a statistical tracer of merging systems.
- Inference: the wavelet-in-photo-z detection strategy should transfer to upcoming wide-field surveys, where dropping the red-sequence prior may help recover high-redshift clusters with poorly sampled red sequences.
Signed reviews
Editorial analysis
A structured set of objections, weighed in public.
Referee Report
Summary. This paper presents the final DES-Y6 WaZP galaxy cluster catalog: 416,947 detections with richness Ngals>=5 over 4,545 deg^2 out to z~1.32, together with a homogenized cosmology sample of 33k clusters with Ngals>25. The catalog is validated internally with 24,447 spectroscopic redshifts, by comparison with the DES-Y1 WaZP catalog, and against external optical catalogs (CLuMPR, WH24) and SZE catalogs from SPT and ACT. The main reported results are high Y1-to-Y6 recovery rates (95-99%), nearly complete matching of SZE clusters in well-covered footprint regions (801/816 SPT, 1842/1873 ACT), 90% recovery of the richest optical clusters in the deeper SZE regions, ~93% redshift consistency between WaZP and SZE counterparts, a 15-20% multiplicity rate interpreted as possible interacting/unrelaxed systems, and a two-component Rayleigh model for optical-SZE centering offsets.
Significance. If the results hold, this is a valuable red-sequence-independent cluster sample for cosmology and cluster astrophysics, and the public release of the catalog is a useful community resource. The paper is careful in several important respects: it uses a large spectroscopic sample for redshift validation, traces unmatched SZE systems to masking, coverage, or zmax limits, provides a cosmology-ready homogenized subsample, and makes the data available online. The angular matching rates and the richness-dependent recovery fractions are robust and do not depend on SZE redshift assumptions. The main caveat is that the redshift-based SZE validation is not fully independent: the text states that many SZE photometric redshifts were assigned by cross-matching with other optical cluster finders, so the ~93% consistency claim, the <0.6% random-association estimate, and the multiplicity interpretation are partly circular with optical selection. The spectroscopic SZE subsample (160 SPT, 456 ACT) is large enough to provide a clean test, and the authors should present it as the primary validation.
major comments (4)
- [4.3, Fig. 18, Table 3] The claim that 93% of WaZP-SZE matches have consistent redshifts is not an independent multi-wavelength validation because, as stated in Section 4.3, the SZE photometric redshifts for most of the sample (583 SPT and 1,255 ACT systems) were 'assigned by cross-matching with the results of several optical cluster finders (e.g. redMaPPer, Camira, AMICO, CLuMPR, WH24)'. Since WaZP is itself an optical cluster finder, these redshifts correlate with optical cluster redshifts by construction. Please recompute the consistency fraction, bias, and scatter using only the SZE spectroscopic subsample (160 SPT and 456 ACT in Table 3) and present it as the primary validation; the photometric-SZE comparison should be labeled explicitly as a consistency check that inherits optical redshift information.
- [4.2, random-association estimate] The estimate that random associations are less than 0.6% is obtained by imposing the redshift-consistency condition from Section 4.3. Because that condition relies partly on non-independent SZE photo-zs, the quoted probability is likely underestimated. Please recompute the random-association rate using the angular-only criterion (~6% per catalog) as the headline number, or provide a version restricted to SZE systems with independent spectroscopic redshifts.
- [4.4] The 15-20% multiplicity fraction is defined using a redshift window derived from the scatter in Table 3, whose photometric rows inherit the same optical-correlation issue described above. As a result, the conclusion that these systems indicate 'possible interacting or unrelaxed systems' is not yet independently supported by the data as presented. Please recompute the multiplicity fraction for SZE clusters with spectroscopic redshifts only and report how the fraction changes; if the subsample is too small for a robust statement, the claim should be explicitly downgraded to a preliminary result.
- [4.5, Table 4] The centering model is fit only to multiplicity-1 systems, and the secondary Rayleigh component is poorly constrained: for example, sigma1 = 0.57(+0.68,-0.35) for WaZP-SPT with SNR>5 and sigma1 = 0.90(+0.44,-0.33) for WaZP-ACT with SNR>5. The abstract's statement that 'WaZP and SZE centerings are found to be consistent' should be qualified to reflect that the data mainly constrain the dominant well-centered component; the tail population is essentially unconstrained, and the robustness check shows that sigma1 depends on how multiple matches are resolved.
minor comments (4)
- [3.1 and Fig. 8] The number of zCG spectroscopic clusters is given as 23,570 in Section 3.1 and Table 2, but Figure 8's caption says 23,850; please correct the inconsistency.
- [4.2] The sentence 'The very few SZE systems without counterparts (lesssim4%) are cross-matched using a 5.3 arcmin aperture' is confusing because the final unmatched fractions are 1.8% for SPT and 1.7% for ACT; please clarify that this is the fraction before the second, larger-aperture pass.
- [Data Availability] The Data Availability sentence contains a grammatical error: 'can be found are available' should be 'can be found' or 'are available'.
- [3.2 and Conclusions] The paper explicitly defers the quantitative impact of photometric-redshift quality on detection completeness to a separate paper; given that, the conclusions should state more prominently that the Y1-Y6 recovery comparison is not corrected for this effect, so the word 'robustness' should be accompanied by this caveat.
Circularity Check
Redshift-consistency and multiplicity claims are partially built on SZE photometric redshifts that were assigned via other optical cluster finders; angular cross-matches and SZE spec-z comparisons remain independent.
-
fitted input called prediction
[Section 4.3 (redshift comparison, Fig. 18 and Table 3), propagated to Section 4.2 (random-association estimate) and Section 4.4 (multiplicity)]
"The two SZE catalogs used to compare with our optical detection provide a spectroscopic redshift for one-third of the sample and a photometric redshift for the rest. The latter were assigned by cross-matching with the results of several optical cluster finders (e.g. redMaPPer, Camira, AMICO, CLuMPR, WH24) and/or from targeted follow-up observations."
The SZE photometric redshifts used in the validation are not independent millimeter-wavelength redshifts: the paper states they were assigned by matching SZE signals to optical cluster finders. WaZP is itself an optical cluster finder operating on the same DES galaxies, so agreement between WaZP redshifts and these SZE photo-z is partly agreement between two optical selections rather than a SZE confirmation. The reported 93% consistent-redshift fraction, the <0.6% random-association estimate that conditions on redshift consistency, and the 15-20% multiplicity rate (defined in Section 4.4 using a redshift window derived from Table 3, which includes these photo-z rows) all inherit that correlation.
full rationale
The main deliverable, the DES-Y6 WaZP catalog, and the angular cross-matching claims are self-contained: richnesses, the 801/816 SPT and 1842/1873 ACT angular matches, the >90% recovery for richness above ~150, and the cluster redshift scatter of 1.4% measured against public spec-z are all derived from DES data plus independent SZE positions and published spectroscopy. The only material circularity is in the redshift-consistency and multiplicity claims, which partly use SZE photo-z that were assigned by cross-matching SZE detections to other optical cluster finders. Because WaZP is also an optical cluster finder, those comparisons are not fully independent multi-wavelength validations; however, the SZE spec-z subsample provides genuine independent support, and the angular matching and catalog claims do not depend on the photo-z input. Overall circularity is therefore modest rather than structural.
Assumptions & free parameters
free parameters (6)
- delta_mag detection =
2 mag
- delta_mag richness =
1.5 mag
- wavelet pixel scale =
1/16 Mpc
- SZE-WaZP match aperture =
2.6 arcmin and 5.3 arcmin
- coverage fraction thresholds =
0.5 and 0.8
- centering model parameters rho0, sigma0, sigma1 =
rho0 ~0.8-0.91, sigma0 ~0.03-0.07 R500c, sigma1 ~0.3-0.9 R500c
assumptions (6)
- domain assumption Validity of the WaZP cluster finder as described in Paper-1: wavelet-based overdensities in photo-z slices correspond to galaxy clusters.
- domain assumption Galaxy weights in each photo-z slice follow a Gaussian redshift PDF.
- ad hoc to paper The richest WaZP cluster inside the SZE aperture is the optical counterpart sourcing the SZE signal.
- domain assumption SZE redshift assignments from SPT/ACT are reliable for comparison, including photometric redshifts obtained from other optical cluster catalogs.
- domain assumption NFW-weighted coverage fraction correctly quantifies DES footprint overlap for SZE clusters.
- domain assumption The zmax map derived from m_lim = m*(zmax)+2 correctly defines redshift completeness of richness.
Cite this review
Pith. "Pith review of The final WaZP galaxy cluster catalog of the Dark Energy Survey and comparison with SZE data." pith.science (2026). https://pith.science/paper/QK6A45JP
@misc{pith2026250705360,
  author       = {Pith},
  title        = {Pith review of: The final WaZP galaxy cluster catalog of the Dark Energy Survey and comparison with SZE data},
  year         = {2026},
  howpublished = {\url{https://pith.science/paper/QK6A45JP}},
  note         = {Machine review of arXiv:2507.05360}
}
read the original abstract
In this work, we present and characterize the galaxy cluster catalog detected by the WaZP cluster finder, which is not based on red-sequence identification, on the full six years of observations of the Dark Energy Survey (DES-Y6). The full catalog contains over 400k detected clusters with richnesses, Ngals, above 5 and that reach redshifts up to 1.3. We also provide a version of the catalog where the observation depth and richness computation are homogenized to be used for cosmology, containing 33k rich (Ngals >25) clusters. We compare our results with the previous WaZP catalog obtained from the DES first-year data release (DES-Y1). We find that essentially all clusters within the common footprint and depth limit are recovered. The deeper observations on DES-Y6 and the more complete available spectroscopic redshift sample lead to improvements in the redshifts of the clusters, resulting in an average scatter of 1.4% and offset of 0.2%. The optical clusters are also cross-matched with Sunyaev Zel'dovich Effect (SZE) cluster samples detected by the South Pole Telescope (SPT) and the Atacama Cosmology Telescope (ACT). We find that essentially all SZE clusters with reasonable overlapping footprint have a corresponding WaZP cluster. Conversely, 90% of the optical detections with richness greater than 150 have a counterpart in the deeper regions of the SZE surveys. Based on cross-match with the SZE catalogs, we also find that 15-20% of the SZE matched systems have more than one possible WaZP counterpart at the same redshift and within the SZE R500c, indicating possible interacting or unrelaxed systems. Finally, given the optical and SZE beams, WaZP and SZE centerings are found to be consistent. A more detailed study of the SZE-WaZP mass-richness relation will be presented in a separate paper.
Figures


Figures from the paper (16 more)



Reference graph
Works this paper leans on
-
[1]
Université Côte d’Azur, OCA, CNRS, Lagrange, UMR 7293, CS 34229, 06304, Nice Cedex 4, France
-
[2]
Laboratório Interinstitucional de e-Astronomia - LIneA, Av. Pastor Martin Luther King Jr, 126 Del Castilho, Nova América Offices, Torre 3000/sala 817 CEP: 20765-000, Brazil
-
[3]
INAF-Osservatorio Astronomico di Trieste, via G. B. Tiepolo 11, I-34143 Tri- este, Italy
-
[4]
Fermi National Accelerator Laboratory, P. O. Box 500, Batavia, IL 60510, USA
-
[5]
Department of Physics, University of Michigan, Ann Arbor, MI 48109, USA
-
[6]
Physik-Institut, University of Zürich, Winterthurerstrasse 190, CH-8057 Zürich, Switzerland
-
[7]
Institute of Cosmology and Gravitation, University of Portsmouth, Portsmouth, PO1 3FX, UK
-
[8]
Argonne National Laboratory, 9700 South Cass Avenue, Lemont, IL 60439, USA
Show all 46 references
-
[9]
Department of Physics & Astronomy, University College London, Gower Street, London, WC1E 6BT, UK
-
[10]
Instituto de Astrofisica de Canarias, E-38205 La Laguna, Tenerife, Spain
-
[11]
Astrofísica, E-38206 La Laguna, Tenerife, Spain
Universidad de La Laguna, Dpto. Astrofísica, E-38206 La Laguna, Tenerife, Spain
-
[12]
Institut de Física d’Altes Energies (IFAE), The Barcelona Institute of Science and Technology, Campus UAB, 08193 Bellaterra (Barcelona) Spain
-
[13]
Institut d’Estudis Espacials de Catalunya (IEEC), 08034 Barcelona, Spain
-
[14]
Institute of Space Sciences (ICE, CSIC), Campus UAB, Carrer de Can Ma- grans, s/n, 08193 Barcelona, Spain
-
[15]
Astronomy Unit, Department of Physics, University of Trieste, via Tiepolo 11, I-34131 Trieste, Italy
-
[16]
Institute for Fundamental Physics of the Universe, Via Beirut 2, 34014 Tri- este, Italy
-
[17]
Centro de Investigaciones Energéticas, Medioambientales y Tecnológicas (CIEMAT), Madrid, Spain
-
[18]
Department of Physics, IIT Hyderabad, Kandi, Telangana 502285, India
-
[19]
Department of Astronomy and Astrophysics, University of Chicago, Chicago, IL 60637, USA
-
[20]
Kavli Institute for Cosmological Physics, University of Chicago, Chicago, IL 60637, USA
-
[21]
California Institute of Technology, 1200 East California Blvd, MC 249-17, Pasadena, CA 91125, USA
-
[22]
Instituto de Fisica Teorica UAM/CSIC, Universidad Autonoma de Madrid, 28049 Madrid, Spain
-
[23]
Department of Physics and Astronomy, Pevensey Building, University of Sussex, Brighton, BN1 9QH, UK
-
[24]
Center for Astrophysical Surveys, National Center for Supercomputing Ap- plications, 1205 West Clark St., Urbana, IL 61801, USA
-
[25]
Green Street, Urbana, IL 61801, USA
Department of Astronomy, University of Illinois at Urbana-Champaign, 1002 W. Green Street, Urbana, IL 61801, USA
-
[26]
School of Mathematics and Physics, University of Queensland, Brisbane, QLD 4072, Australia
-
[27]
Santa Cruz Institute for Particle Physics, Santa Cruz, CA 95064, USA
-
[28]
Center for Cosmology and Astro-Particle Physics, The Ohio State University, Columbus, OH 43210, USA
-
[29]
Department of Physics, The Ohio State University, Columbus, OH 43210, USA
-
[30]
Center for Astrophysics|Harvard & Smithsonian, 60 Garden Street, Cam- bridge, MA 02138, USA
-
[31]
Australian Astronomical Optics, Macquarie University, North Ryde, NSW 2113, Australia
-
[32]
Lowell Observatory, 1400 Mars Hill Rd, Flagstaff, AZ 86001, USA
-
[33]
Jet Propulsion Laboratory, California Institute of Technology, 4800 Oak Grove Dr., Pasadena, CA 91109, USA
-
[34]
and Cynthia Woods Mitchell Institute for Fundamental Physics and Article number, page 19 A&A proofs:manuscript no
George P. and Cynthia Woods Mitchell Institute for Fundamental Physics and Article number, page 19 A&A proofs:manuscript no. main Astronomy, and Department of Physics and Astronomy, Texas A&M University, College Station, TX 77843, USA
-
[35]
Université Grenoble Alpes, CNRS, LPSC-IN2P3, 38000 Grenoble, France
-
[36]
Institució Catalana de Recerca i Estudis Avançats, E-08010 Barcelona, Spain
-
[37]
Kavli Institute for Particle Astrophysics & Cosmology, P. O. Box 2450, Stan- ford University, Stanford, CA 94305, USA
-
[38]
SLAC National Accelerator Laboratory, Menlo Park, CA 94025, USA
-
[39]
Instituto de Física, UFRGS, Caixa Postal 15051, Porto Alegre, RS - 91501- 970, Brazil
-
[40]
Physics Department, Lancaster University, Lancaster, LA1 4YB, UK
-
[41]
Computer Science and Mathematics Division, Oak Ridge National Labora- tory, Oak Ridge, TN 37831
-
[42]
Department of Astronomy, University of California, Berkeley, 501 Campbell Hall, Berkeley, CA 94720, USA
-
[43]
Lawrence Berkeley National Laboratory, 1 Cyclotron Road, Berkeley, CA 94720, USA
-
[44]
Max Planck Institute for Extraterrestrial Physics, Giessenbachstrasse, 85748 Garching, Germany
-
[45]
1, 81679 München, Germany
Universitäts-Sternwarte, Fakultät für Physik, Ludwig-Maximilians Univer- sität München, Scheinerstr. 1, 81679 München, Germany
-
[46]
2.4, we evaluate the spatial homogeneity of the photo- metric redshift errors used in this work (Fig
Hamburger Sternwarte, Universität Hamburg, Gojenbergsweg 112, 21029 Hamburg, Germany Appendix A: Photometric redshifts quality and dust absorption In Sec. 2.4, we evaluate the spatial homogeneity of the photo- metric redshift errors used in this work (Fig. 5). In Fig. A.1, the...
2020
Reviewed August 6, 2026 · model on record in the stance chip above.
Discussion (0). Continue with ORCID to comment.