REVIEW 3 major objections 5 minor 7 cited by
KSZ Velocity Reconstruction with ACT and DESI-LS using a Tomographic QML Power Spectrum Estimator
T0 review · 3 major / 5 minor · reviewed 2026-08-06 · deepseek-v4-flash
Pith's one-line read This paper reports an 11.7σ detection of the kSZ velocity-galaxy cross-correlation and measures its amplitude at 0.39 ± 0.04 of the halo-model prediction, evidence for strong feedback in massive halos.
desk verdict A real kSZ velocity reconstruction detection at ~9.4σ, but the 11.7σ headline is a second-iteration rescaling and should not be the headline number. read the letter →
The pith
A machine-rendered reading of the paper's core claim, the machinery that carries it, and where it could break.
The reading
What carries the argument
The velocity reconstruction is carried by the quadratic estimator $\hat{v}_\alpha(\hat n) = -N^{vv,\alpha} a'_\alpha(\hat n)\, \delta'_{g,\alpha}(\hat n)$, where $a'$ and $\delta'_g$ are the CMB temperature and galaxy overdensity maps filtered by $C^{\tau g}_\ell/C^{gg}_\ell$; this converts the small-scale kSZ temperature signal into an estimate of the line-of-sight velocity. For the cross-power measurement, the QML estimator acts on a pixel-space covariance matrix $C = S + N$ built from $2\times20$ redshift-binned fields, is mode-purified so that only galaxy-velocity pairs contribute, and computes the Fisher matrix analytically. The halo-model electron-galaxy cross-power $C^{\tau g}_\ell$, built from the AGN electron profile and the DESI LRG halo occupation distribution, fixes the velocity scale and therefore the amplitude calibration of the final measurement.
What would settle it
Repeat the measurement with the electron-galaxy cross-spectrum $C^{\tau g}_\ell$ replaced by a different electron profile, for example one calibrated to thermal SZ measurements of the same halos, while keeping all other analysis choices fixed; if the fitted amplitude $A$ moves by much more than the quoted $0.04$ or the significance drops substantially, the central claims are template-dependent rather than a model-independent detection.
Extended reading notes
Core claim
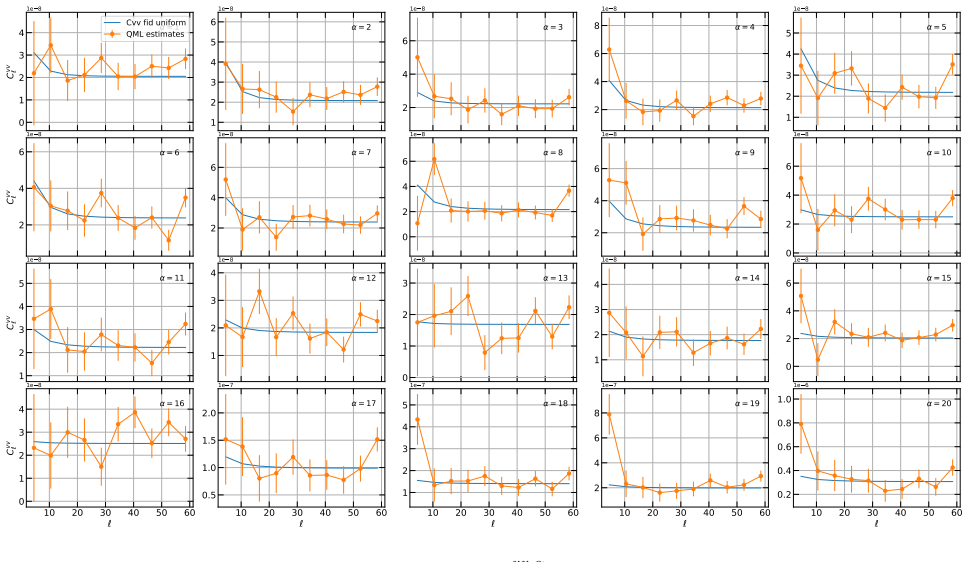
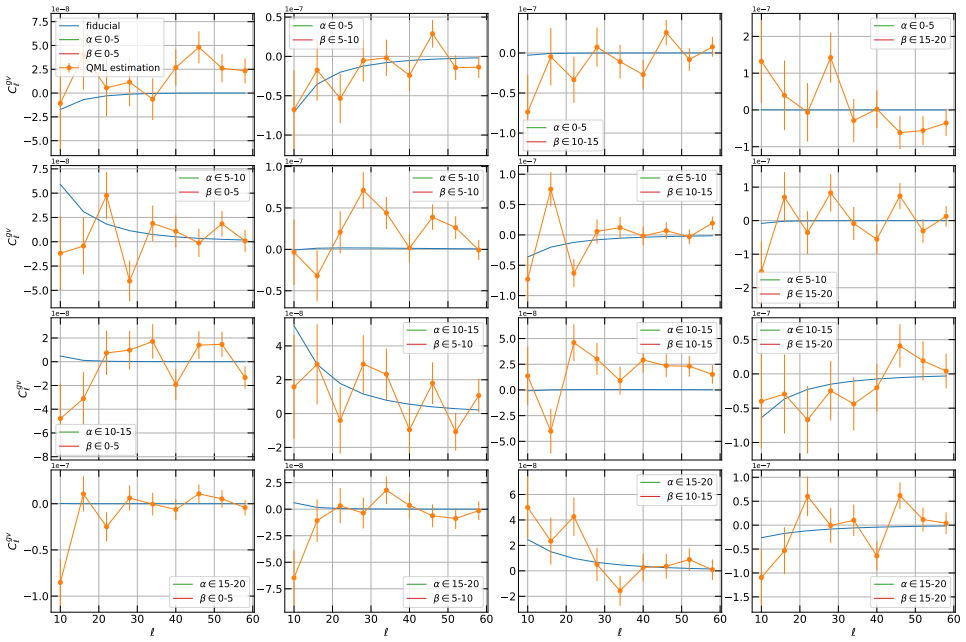
On the paper's own terms, the discovery is that kSZ velocity reconstruction works at high significance on a photometric galaxy sample alone. Reconstructing velocities with the quadratic estimator applied to ACT DR6 90 and 150 GHz maps and DESI-LS DR9 galaxies, then estimating the velocity-galaxy cross-spectrum with the QML estimator, the authors measure the cross-correlation with significance $11.7\sigma$ and an overall amplitude $A=0.39\pm0.04$ relative to their halo-model template. They further show that the QML pipeline recovers about twice the signal-to-noise of pseudo-$C_\ell$ ($6.06\sigma$) with identical choices, and that the low value of $A$ is consistent with earlier evidence for strong AGN feedback and with a simultaneous independent analysis. The paper treats these results as establishing both a physics claim about gas in halos and a methodological claim that optimal QML power-spectrum estimation is feasible at this resolution.
Load-bearing premise
The load-bearing premise is that we know how free electrons are arranged around galaxies well enough to build the filter used in the velocity reconstruction; if the electron profile is wrong in its redshift or scale dependence, the recovered velocity field is biased and both the amplitude $A=0.39$ and the $11.7\sigma$ significance change.
Editorial extensions
If this is right
- Photometric galaxy surveys can supply both the small-scale filter and the large-scale tracer for kSZ velocity reconstruction, so future wide-field surveys can pursue the method without a spectroscopic velocity template.
- The QML estimator saturates most of the available signal by $\ell \simeq 60$ and computes the covariance analytically, making it a practical tool for high-resolution kSZ analyses with many tomographic bins.
- If $A\simeq0.4$ is correct, halo models with the fiducial AGN electron profile overpredict the gas content of massive halos, so cosmological uses of the kSZ effect will need to marginalize over the electron profile rather than treat it as known.
- The same pipeline, with the cross-power step replaced by a parameter model, is set up for large-scale cosmological inference from velocity-galaxy correlations, the extension to $f_{\mathrm{NL}}$ that the paper defers to future work.
Reading between the lines
- A test the authors do not report is to rerun the pipeline with the halo-model electron profile replaced by a non-AGN or tSZ-calibrated profile; the size of the shift in $A$ would show how much of the quoted $0.04$ uncertainty is model-driven.
- Because the QML covariance already contains all cross-redshift couplings, the same estimator should transfer directly to other low-$\ell$ cross-correlations such as CMB lensing $\times$ galaxies or tSZ $\times$ galaxies, where most of the signal also sits at $\ell<100$.
- The linear velocity-from-galaxy maps could be combined with the kSZ maps in a single joint map-space fit, which would give a cleaner spatial diagnostic of where the two reconstructions agree than the reported correlation coefficients alone.
Editorial analysis
A structured set of objections, weighed in public.
Referee Report
Summary. The paper presents a kSZ velocity reconstruction using ACT DR6 temperature maps and DESI-LS DR9 LRG galaxies, analyzed with a novel implementation of a quadratic maximum likelihood (QML) power spectrum estimator operating on 20 tomographic redshift bins. The authors measure the cross-power between the reconstructed velocity field and the galaxy overdensity field and report an 11.7σ detection, together with an amplitude A = 0.39 ± 0.04 relative to a Battaglia AGN halo-model prediction. They also compare their QML results with a pseudo-Cℓ analysis, finding roughly a factor of two improvement in signal-to-noise, and validate a linear galaxy-based velocity reconstruction on simulations. The central claims are the high detection significance and the low amplitude relative to the halo model, which is interpreted as evidence for strong feedback in massive halos.
Significance. If the result holds, it is a significant advance: it demonstrates that a dense-matrix QML estimator with analytic covariance is tractable for a 40-field, NSIDE=32 analysis and provides one of the strongest kSZ velocity-reconstruction detections to date, with implications for baryon feedback. The paper includes several concrete strengths: an analytic covariance calculation, validation of the linear velocity estimator on Gaussian simulations, and an explicit comparison with pseudo-Cℓ. However, the quoted headline significance is weakened by the two-step rescaling issue described below, and the model dependence of the amplitude is not fully propagated. The first-iteration significance of 9.35σ remains a strong model-independent detection, but the paper's headline claim as currently stated is not fully supported.
major comments (3)
- [Sec. 3.2, Table 1, App. D] The abstract and Sec. 5 quote 11.7σ as the detection significance, but Table 1 shows this is the SNR of the second QML iteration, obtained after rescaling the fiducial Cτg by the first-iteration amplitude A = 0.393 and recomputing the Fisher matrix. Appendix D, Eqs. (73)–(76), shows that the QML SNR is not invariant under such a rescaling: for b < 1 and signal-dominated velocity autopower, the correction factor b⁻¹M(b) exceeds unity. The final significance is therefore the result of a data-adaptive choice of filter, and the null distribution of this two-step procedure is not computed. The first-iteration 9.35σ is the appropriate model-independent detection significance unless simulations demonstrate that the second-iteration SNR is unbiased under the null. I recommend either quoting the first-iteration value as the headline or adding such a null test.
- [Secs. 2.5–2.6, Sec. 3.2] The amplitude A = 0.39 ± 0.04 and the final SNR both depend on the halo-model electron-galaxy cross-power Cτg, computed from the Battaglia AGN electron profile and the DESI LRG HOD (Eqs. 27–28). This quantity enters both the kSZ filter (Eqs. 8–11) and the template in the amplitude fit (Eqs. 33–40). The optical depth degeneracy is mentioned in Sec. 2.2, but its impact on A and on the quoted significance is not propagated. A redshift- or scale-dependent error in the electron profile would bias the reconstructed velocity field and change both A and the second-iteration SNR, so the stated precision and the feedback interpretation require a quantification of this model uncertainty.
- [Sec. 2.4] The paper states that the unbiasedness of the QML estimator and the correctness of its covariance matrix have been tested extensively on Gaussian simulations, but the results are deferred to an upcoming companion paper. Since the main amplitude and SNR are derived from these QML estimates, the current manuscript should include at least a summary of those validation tests, such as a null test or a recovery of input power spectra, to support the quoted error bars. Without this information, the reader cannot independently assess whether the analytic covariance accurately describes the estimator's scatter.
minor comments (5)
- [Sec. 2.1.2] There are several typos, including "normailzed" and "the the last few redshift bins" in Sec. 3.2; a careful proofread is needed.
- [Fig. 18 caption] The velocity cutoff range for the kSZ reconstruction is labeled "for the galaxy reconstruction" twice; the second occurrence should refer to the kSZ reconstruction.
- [Sec. 3.2] The sentence "we use the range ℓ = 7 to ℓ = 60 to avoid the largest modes" should be rephrased, since the largest angular scales correspond to the lowest multipoles; the text presumably means the modes most affected by systematics.
- [Eq. (5)] The chi-square expression is written as a plain squared norm without an inverse noise covariance; please clarify the weighting used in the regression.
- [App. G] The pseudo-Cℓ covariance is noted to be not fully converged for less-correlated redshift bins (Fig. 26); the 6.06σ comparison should be flagged as approximate in the main text.
Circularity Check
The 11.7σ headline detection is the second-iteration QML SNR after rescaling the fiducial Cgτ template by the same-data fitted amplitude A=0.39; the paper's own App. D shows this rescaling boosts the SNR, so the pre-specified detection significance is the first-iteration 9.35σ.
-
fitted input called prediction
[Sec. 3.2, 'Total Signal-To-Noise'; App. D, Eqs. (67)-(76); Table 1]
"To increase the total SNR of the cross-correlation, we run two iterations of the QML, as described at the bottom of Sec. 2.4. In the first iteration, we measure A = 0.39 ± 0.04 for the kSZ amplitude. Then we adjust Cgτ by this value in the second iteration of the QML (i.e. we learned in the first iteration that the halo model has over-estimated the expected kSZ signal). The QML, unlike the pseudo-Cℓ, is not invariant under this rescaling, as we explain in more detail in App. D. This procedure gains about two σ in the cross-correlation significance."
The headline 11.7σ is the second-iteration SNR, obtained after rescaling the fiducial electron-galaxy cross-power Cgτ by the same-data fitted amplitude A≈0.39 and recomputing the QML weights and Fisher matrix. Appendix D Eq. (73) gives SNR_QML = b^{-1}M(b) SNR, and Eq. (76) shows b^{-1}M(b)>1 for b<1 in the signal-dominated regime. Thus the quoted detection significance is not a fixed null-hypothesis statistic: it is the first-iteration SNR multiplied by a boost factor determined by the very amplitude fitted from the same data. The paper does not compute the null distribution of this two-step fit-then-renormalize procedure, so the model-independent detection significance is the first-iteration 9.35σ, not the headline 11.7σ.
-
self definitional
[Sec. 3.2, 'Dependence on ℓmin'; Table 1]
"The left plot shows the cross power amplitude A, which falls around 0.39 at the first QML iteration and becomes close to 1 after the rescaling in the second QML iteration (by definition)."
In the second QML iteration the fiducial Cgτ template is rescaled by the measured A≈0.39 before the amplitude is re-fit; re-fitting the same rescaled template returns A≈1 by construction. This step is self-referential by the paper's own wording: the second-iteration amplitude carries no independent information about the halo-model normalization, and the headline significance is computed using this data-adapted filter rather than a pre-specified one.
full rationale
The paper is largely self-contained: the first-iteration QML SNR of 9.35σ, the 20-bias SNR of 10.6, and the pseudo-Cℓ SNR of 6.06 are computed with a pre-specified fiducial model, and the QML implementation is validated on Gaussian simulations. The halo-model Cgτ (Battaglia AGN profile plus DESI LRG HOD) is used both as the kSZ filter and as the amplitude template, but that is model dependence acknowledged by the authors, not a logical circularity. Self-citations to [6, 44] introduce the quadratic-estimator formalism and optical-depth degeneracy but are not the load-bearing step here. The central issue is the two-iteration procedure: the amplitude A=0.39 measured from the data is fed back to rescale Cgτ, and the second-iteration SNR (11.5–11.7) is quoted as the detection. Appendix D explicitly derives a correction factor b^{-1}M(b) that boosts the SNR when b<1 in the signal-dominated regime, so the headline significance is partially manufactured from the fitted input. The first-iteration 9.35σ remains a strong pre-specified detection, and the A=0.39 measurement from iteration 1 is not itself circular; hence the score is 6 rather than higher.
Assumptions & free parameters
free parameters (3)
- Galaxy bias b_g per redshift bin (20 values) =
Approximately 1.7 to 2.1 across bins (Fig. 9)
- Empirical kSZ reconstruction noise amplitude N_vv,alpha =
Ratio to theory between 1.1 and 1.7 depending on channel and redshift bin (Fig. 8)
- Rescaling of fiducial C_tau-g by first-iteration amplitude A =
A=0.393
assumptions (5)
- domain assumption The electron-galaxy cross-power C_tau-g is described by the Battaglia AGN electron profile and the DESI LRG HOD.
- domain assumption Linear galaxy bias plus linear RSD term b_g^2 + f mu^2 describes galaxy clustering on the large scales used.
- domain assumption The kSZ reconstruction noise is Gaussian, isotropic, uncorrelated between pixels and redshift bins, and flat in ell on large scales.
- domain assumption CMB temperature and galaxy overdensity fields are Gaussian at the level required for the quadratic estimator and QML likelihood.
- domain assumption Photometric redshift errors are Gaussian with sigma_z=0.027 and are applied uniformly.
Cite this review
Pith. "Pith review of KSZ Velocity Reconstruction with ACT and DESI-LS using a Tomographic QML Power Spectrum Estimator." pith.science (2026). https://pith.science/paper/QKSM7DVJ
@misc{pith2026250621684,
  author       = {Pith},
  title        = {Pith review of: KSZ Velocity Reconstruction with ACT and DESI-LS using a Tomographic QML Power Spectrum Estimator},
  year         = {2026},
  howpublished = {\url{https://pith.science/paper/QKSM7DVJ}},
  note         = {Machine review of arXiv:2506.21684}
}
abstract
We perform kinetic Sunyaev-Zel'dovich (kSZ) velocity reconstruction on data from ACT DR6 and DESI-LS DR9. To estimate the cross-power between kSZ velocity reconstruction and galaxy density, we make use of a novel quadratic maximum likelihood QML power spectrum estimator implementation in red-shift binned spherical coordinates. We find a detection of the kSZ signal from the cross-correlation between the estimated velocity field and the large-scale galaxy field of $11.7 \sigma$. We estimate an amplitude $A=0.39 \pm 0.04$ of the kSZ signal with respect to a halo model prediction, possibly indicating a high feedback in massive halos, in agreement with previous studies. Our result demonstrates the feasibility of an optimal QML pipeline at the resolution required for this analysis, and will be a powerful tool for kSZ cosmology with upcoming high-resolution surveys.
Figures


Figures from the paper (29 more)






Forward citations
Cited by 7 Pith papers
-
Optimal and exact wide-angle power spectrum estimation
For finite-rank signals the optimal wide-angle estimator is the two-ℓ Yamamoto form, whose exact window is a finite FFT-computable sum that improves ultra-large-scale SNR by O(1).
-
Measurement of the galaxy-velocity power spectrum of DESI tracers with the kinematic Sunyaev-Zeldovich effect using DESI DR2 and ACT DR6
DESI DR2 and ACT DR6 data yield 17σ LRG-velocity, 8.3σ ELG-velocity, and 6.8σ QSO-velocity detections plus a 3.1σ velocity-velocity signal, producing f_NL^loc = 15.9_{-34.4}^{+34.6} from the velocity field.
-
Direct shear $\times$ kSZ correlation: controlling baryons without modeling galaxies
A shear×velocity kSZ template cross-correlated with the CMB is forecast to measure the electron–matter power spectrum to few-percent (ACT/SO) or sub-percent (CMB-HD) precision.
-
Constraints on the remote quadrupole field from the polarized Sunyaev Zel'dovich effect
A first pSZ bispectrum search with Planck/ACT and unWISE/CIB data finds no signal, giving b_q=1.02±2.64 and τ_rei=−0.01±0.14.
-
Precision Kinematic Sunyaev--Zel'dovich Measurements Across Halo Mass and Redshift with DESI DR2 and ACT DR6: Part I. Luminous Red Galaxies
High-significance kSZ measurements around LRGs show gas is redistributed beyond gravitational collapse and imply more efficient feedback in group-scale halos than in standard hydrodynamical models.
-
QML-FAST -- A Fast Code for low-$\ell$ Tomographic Maximum Likelihood Power Spectrum Estimation
QML-FAST provides a fast, optimal QML power spectrum code for low-ℓ tomographic analysis of up to dozens of correlated scalar fields on the sphere, with public release and validation showing gains over pseudo-C_ℓ at l...
-
Probing Dark Energy Microphysics with kSZ Tomography
Fisher-matrix forecasts for LSST- and CMB-S4-like surveys show kSZ tomography tightens constraints on dark energy parameters w0 and wa by 15% and 32% while assessing detectability of perturbations for different sound speeds.
Reference graph
Works this paper leans on
-
[1]
Stefania Amodeo et al. Atacama Cosmology Telescope: Modeling the gas thermodynamics in BOSS CMASS galaxies from kinematic and thermal Sunyaev-Zel’dovich measurements.Phys. Rev. D, 103(6):063514, 2021. [Erratum: Phys.Rev.D 107, 063514 (2023)]. 22 10 20 30 40 0.0 0.2 0.4Correlation coefficient R bin = 3 bin = 7 bin = 11 bin = 15 Figure 19: The correlation c...
work page 2023
-
[2]
Nicholas Battaglia. The Tau of Galaxy Clusters. JCAP, 08:058, 2016
work page 2016
-
[3]
Dark Energy Constraints from Galaxy Cluster Peculiar Ve- locities
Suman Bhattacharya and Arthur Kosowsky. Dark Energy Constraints from Galaxy Cluster Peculiar Ve- locities. Phys. Rev., D77:083004, 2008
work page 2008
-
[4]
Kinetic Sunyaev-Zel’dovich effect in modified gravity
Federico Bianchini and Alessandra Silvestri. Kinetic Sunyaev-Zel’dovich effect in modified gravity. Phys. Rev., D93(6):064026, 2016
work page 2016
-
[5]
J. D. Bilbao-Ahedo, R. B. Barreiro, P. Vielva, E. Mart ´ ınez-Gonz´ alez, and D. Herranz. ECLIPSE: a fast Quadratic Maximum Likelihood estimator for CMB intensity and polarization power spectra. JCAP, 07:034, 2021
work page 2021
-
[6]
Richard Bloch and Matthew C. Johnson. Kinetic Sunyaev Zel’dovich velocity reconstruction from Planck and unWISE. 5 2024
work page 2024
-
[7]
Victoria Calafut et al. The Atacama Cosmology Telescope: Detection of the pairwise kinematic Sunyaev- Zel’dovich effect with SDSS DR15 galaxies. Phys. Rev. D, 104(4):043502, 2021
work page 2021
-
[8]
Juan Cayuso, Richard Bloch, Selim C. Hotinli, Matthew C. Johnson, and Fiona McCarthy. Velocity reconstruction with the cosmic microwave background and galaxy surveys. JCAP, 02:051, 2023
work page 2023
Show all 50 references
-
[9]
Cayuso and Matthew C
Juan I. Cayuso and Matthew C. Johnson. Towards testing CMB anomalies using the kinetic and polarized Sunyaev-Zel’dovich effects. Phys. Rev. D, 101(12):123508, 2020
2020
-
[10]
Cayuso, Matthew C
Juan I. Cayuso, Matthew C. Johnson, and James B. Mertens. Simulated reconstruction of the remote dipole field using the kinetic Sunyaev Zel’dovich effect. Phys. Rev., D98(6):063502, 2018
2018
-
[11]
Core Cosmology Library: Precision Cosmological Predictions for LSST
Nora Elisa Chisari et al. Core Cosmology Library: Precision Cosmological Predictions for LSST. Astrophys. J. Suppl., 242(1):2, 2019
2019
-
[12]
Atacama Cosmology Telescope: High-resolution component-separated maps across one third of the sky
William Coulton et al. Atacama Cosmology Telescope: High-resolution component-separated maps across one third of the sky. Phys. Rev. D, 109(6):063530, 2024
2024
-
[13]
De Bernardis et al
F. De Bernardis et al. Detection of the pairwise kinematic Sunyaev-Zel’dovich effect with BOSS DR11 and the Atacama Cosmology Telescope. JCAP, 1703(03):008, 2017
2017
-
[14]
Spergel, and Hy Trac
Simon DeDeo, David N. Spergel, and Hy Trac. The kinetic sunyaev-zel’dovitch effect as a dark energy probe. 2005
2005
-
[15]
Detection of the kinematic Sunyaev–Zel’dovich effect with DES Year 1 and SPT
DES/SPT Collaboration et al. Detection of the kinematic Sunyaev–Zel’dovich effect with DES Year 1 and SPT. Mon. Not. Roy. Astron. Soc., 461(3):3172–3193, 2016
2016
-
[16]
Johnson, Moritz M¨ unchmeyer, and Alexan- dra Terrana
Anne-Sylvie Deutsch, Emanuela Dimastrogiovanni, Matthew C. Johnson, Moritz M¨ unchmeyer, and Alexan- dra Terrana. Reconstruction of the remote dipole and quadrupole fields from the kinetic Sunyaev Zel’dovich and polarized Sunyaev Zel’dovich effects. Phys. Rev. D, 98(12):123501...
2018
-
[17]
Utkarsh Giri and Kendrick M. Smith. Exploring KSZ velocity reconstruction with N-body simulations and the halo model. JCAP, 09:028, 2022
2022
-
[18]
Hadzhiyska et al
B. Hadzhiyska et al. Evidence for large baryonic feedback at low and intermediate redshifts from kinematic Sunyaev-Zel’dovich observations with ACT and DESI photometric galaxies. 7 2024
2024
-
[19]
Mapping the gas density with the kinematic Sunyaev-Zel’dovich and patchy screening effects: a self-consistent comparison
Boryana Hadzhiyska, Noah Sailer, and Simone Ferraro. Mapping the gas density with the kinematic Sunyaev-Zel’dovich and patchy screening effects: a self-consistent comparison. 6 2025
2025
-
[20]
Evidence of Galaxy Cluster Motions with the Kinematic Sunyaev-Zel’dovich Effect
Nick Hand et al. Evidence of Galaxy Cluster Motions with the Kinematic Sunyaev-Zel’dovich Effect. Phys. Rev. Lett., 109:041101, 2012
2012
-
[21]
Carlos Hernandez-Monteagudo, Licia Verde, Raul Jimenez, and David N. Spergel. Correlation properties of the kinematic sunyaev-zel’dovich effect and implications for dark energy. Astrophys. J., 643:598–615, 2006
2006
-
[22]
Colin Hill, Simone Ferraro, Nick Battaglia, Jia Liu, and David N
J. Colin Hill, Simone Ferraro, Nick Battaglia, Jia Liu, and David N. Spergel. Kinematic Sunyaev-Zel’dovich Effect with Projected Fields: A Novel Probe of the Baryon Distribution with Planck, WMAP, and WISE Data. Phys. Rev. Lett., 117(5):051301, 2016
2016
-
[23]
Hilton et al
M. Hilton et al. The Atacama Cosmology Telescope: A Catalog of >4000 Sunyaev–Zel’dovich Galaxy Clusters. Astrophys. J. Suppl., 253(1):3, 2021
2021
-
[24]
Finding the Missing Baryons Using CMB as a Backlight
Shirley Ho, Simon Dedeo, and David Spergel. Finding the Missing Baryons Using CMB as a Backlight. 2009
2009
-
[25]
Smith, and Simone Ferraro
Selim Hotinli, Kendrick M. Smith, and Simone Ferraro. Velocity Reconstruction from KSZ: Measuring fN L with ACT and DESILS. to appear on arxiv jointly with this paper
-
[26]
Hotinli, James B
Selim C. Hotinli, James B. Mertens, Matthew C. Johnson, and Marc Kamionkowski. Probing correlated compensated isocurvature perturbations using scale-dependent galaxy bias. Phys. Rev. D, 100(10):103528, 2019
2019
-
[27]
Hotinli, and Matthew C
Jordan Krywonos, Selim C. Hotinli, and Matthew C. Johnson. Constraints on cosmology beyond ΛCDM with kinetic Sunyaev Zel’dovich velocity reconstruction. 8 2024
2024
-
[28]
Reconstruction of contin- uous cosmological fields from discrete tracers with graph neural networks.arXiv preprint arXiv:2411.02496, 2024
Yurii Kvasiuk, Jordan Krywonos, Matthew C Johnson, and Moritz M¨ unchmeyer. Reconstruction of contin- uous cosmological fields from discrete tracers with graph neural networks.arXiv preprint arXiv:2411.02496, 2024
2024 arXiv
-
[29]
Autodifferentiable likelihood pipeline for the cross-correlation of CMB and large-scale structure due to the kinetic Sunyaev-Zeldovich effect
Yurii Kvasiuk and Moritz M¨ unchmeyer. Autodifferentiable likelihood pipeline for the cross-correlation of CMB and large-scale structure due to the kinetic Sunyaev-Zeldovich effect. Phys. Rev. D, 109(8):083515, 2024
2024
-
[30]
Madhavacheril, Kendrick M
Alex Lagu¨ e, Mathew S. Madhavacheril, Kendrick M. Smith, Simone Ferraro, and Emmanuel Schaan. Constraints on local primordial non-Gaussianity with 3d Velocity Reconstruction from the Kinetic Sunyaev- Zeldovich Effect. 11 2024
2024
-
[31]
Weak gravitational lensing of the CMB
Antony Lewis and Anthony Challinor. Weak gravitational lensing of the CMB. Phys. Rept., 429:1–65, 2006
2006
-
[32]
The Atacama Cosmology Telescope: reionization kSZ trispectrum methodology and limits
Niall MacCrann et al. The Atacama Cosmology Telescope: reionization kSZ trispectrum methodology and limits. Mon. Not. Roy. Astron. Soc., 532(4):4247–4260, 2024
2024
-
[33]
The Atacama Cosmology Telescope: Large-scale velocity reconstruction with the kinematic Sunyaev–Zel’dovich effect and DESI LRGs
Fiona McCarthy et al. The Atacama Cosmology Telescope: Large-scale velocity reconstruction with the kinematic Sunyaev–Zel’dovich effect and DESI LRGs. 10 2024
2024
-
[34]
Eva-Maria Mueller, Francesco de Bernardis, Rachel Bean, and Michael D. Niemack. Constraints on gravity and dark energy from the pairwise kinematic Sunyaev-Zeldovich effect. Astrophys. J., 808(1):47, 2015
2015
-
[35]
Eva-Maria Mueller, Francesco de Bernardis, Rachel Bean, and Michael D. Niemack. Constraints on massive neutrinos from the pairwise kinematic Sunyaev-Zel’dovich effect. Phys. Rev., D92(6):063501, 2015
2015
-
[36]
Madhavacheril, Simone Ferraro, Matthew C
Moritz M¨ unchmeyer, Mathew S. Madhavacheril, Simone Ferraro, Matthew C. Johnson, and Kendrick M. Smith. Constraining local non-Gaussianities with kinetic Sunyaev-Zel’dovich tomography. Phys. Rev. D, 100(8):083508, 2019. 24
2019
-
[37]
The Atacama Cosmology Telescope: arcminute-resolution maps of 18 000 square degrees of the microwave sky from ACT 2008–2018 data combined with Planck
Sigurd Naess et al. The Atacama Cosmology Telescope: arcminute-resolution maps of 18 000 square degrees of the microwave sky from ACT 2008–2018 data combined with Planck. JCAP, 12:046, 2020
2008
-
[38]
The Atacama Cosmology Telescope: DR6 Maps
Sigurd Naess et al. The Atacama Cosmology Telescope: DR6 Maps. 3 2025
2025
-
[39]
Zhen Pan and Matthew C. Johnson. Forecasted constraints on modified gravity from Sunyaev-Zel’dovich tomography. Phys. Rev. D, 100(8):083522, 2019
2019
-
[40]
Planck intermediate results
Planck Collaboration et al. Planck intermediate results. XXXVII. Evidence of unbound gas from the kinetic Sunyaev-Zeldovich effect. Astron. Astrophys., 586:A140, 2016
2016
-
[41]
Local primordial non-Gaussianity from the large-scale clustering of photometric DESI luminous red galaxies
Mehdi Rezaie et al. Local primordial non-Gaussianity from the large-scale clustering of photometric DESI luminous red galaxies. Mon. Not. Roy. Astron. Soc., 532(2):1902–1928, 2024
1902
-
[42]
Evidence for the kinematic Sunyaev-Zel’dovich effect with the Atacama Cosmology Telescope and velocity reconstruction from the Baryon Oscillation Spectroscopic Survey
Emmanuel Schaan et al. Evidence for the kinematic Sunyaev-Zel’dovich effect with the Atacama Cosmology Telescope and velocity reconstruction from the Baryon Oscillation Spectroscopic Survey. Phys. Rev., D93(8):082002, 2016
2016
-
[43]
Atacama Cosmology Telescope: Combined kinematic and thermal Sunyaev- Zel’dovich measurements from BOSS CMASS and LOWZ halos
Emmanuel Schaan et al. Atacama Cosmology Telescope: Combined kinematic and thermal Sunyaev- Zel’dovich measurements from BOSS CMASS and LOWZ halos. Phys. Rev. D, 103(6):063513, 2021
2021
-
[44]
Smith, Mathew S
Kendrick M. Smith, Mathew S. Madhavacheril, Moritz M¨ unchmeyer, Simone Ferraro, Utkarsh Giri, and Matthew C. Johnson. KSZ tomography and the bispectrum. 10 2018
2018
-
[45]
R. A. Sunyaev and Y. B. Zeldovich. The velocity of clusters of galaxies relative to the microwave background. The possibility of its measurement. Monthly Notices of the Royal Astronomical Society, 190(3):413–420, mar 1980
1980
-
[46]
How to measure CMB polarization power spectra without losing information
Max Tegmark and Angelica de Oliveira-Costa. How to measure CMB polarization power spectra without losing information. Phys. Rev. D, 64:063001, 2001
2001
-
[47]
Vanneste, S
S. Vanneste, S. Henrot-Versill´ e, T. Louis, and M. Tristram. Quadratic estimator for CMB cross-correlation. Phys. Rev. D, 98(10):103526, 2018
2018
-
[48]
The DESI one-per cent survey: exploring the halo occupation distribution of luminous red galaxies and quasi-stellar objects with AbacusSummit
Sihan Yuan et al. The DESI one-per cent survey: exploring the halo occupation distribution of luminous red galaxies and quasi-stellar objects with AbacusSummit. Mon. Not. Roy. Astron. Soc., 530(1):947–965, 2024
2024
-
[49]
DESI luminous red galaxy samples for cross-correlations
Rongpu Zhou et al. DESI luminous red galaxy samples for cross-correlations. JCAP, 11:097, 2023
2023
-
[50]
Target Selection and Validation of DESI Luminous Red Galaxies
Rongpu Zhou et al. Target Selection and Validation of DESI Luminous Red Galaxies. Astron. J., 165(2):58, 2023. 25 A Imaging Calibration for the DESI LRG Extended Sample As described in Sec. 2.1.2, the DESI extended LRG example suffers an excess in the galaxy autopowers on larg...
2023
Reviewed August 6, 2026 · model on record in the stance chip above.
Discussion (0). Sign in to comment.