REVIEW 5 major objections 5 minor 22 references
Optimizing Server Load Distribution in Multimedia IoT Environments through LSTM-Based Predictive Algorithms
T0 review · 5 major / 5 minor · reviewed 2026-08-07 · deepseek-v4-flash
Pith's one-line read Predictive load balancing using LSTM forecasts and fuzzy classification keeps servers below overload and saves energy in software-defined multimedia IoT networks.
desk verdict A coherent but thin incremental extension of the authors' own LSTM/fuzzy load-balancing work; the evaluation is too confounded and internally inconsistent to support the advertised energy and QoS gains. read the letter →
The pith
A machine-rendered reading of the paper's core claim, the machinery that carries it, and where it could break.
The reading
What carries the argument
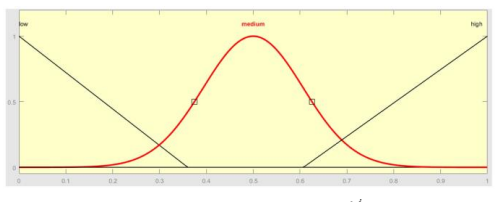
The load-bearing mechanism is the pairing of an LSTM time-series forecast with a Mamdani fuzzy classifier whose output drives a greedy migration algorithm. LSTM is a recurrent neural network that learns temporal dependencies from historical resource readings; here it is trained with Adam, MSE loss, 15 epochs, and batch size one, with input normalized by MinMaxScaler. The fuzzy classifier converts the four predicted ratios into linguistic values (low, medium, high) through membership functions and applies 81 rules to output one of four load levels. This predicted category, not the current measured load, is what selects target servers for new flows and for load migration, and the same classification decides when to shut a server down.
What would settle it
Re-run the 26-flow scenario while recording both the LSTM-predicted resource values and the measured values at each timestep, then count how often the fuzzy load level assigned from predictions differs from the level assigned from measurements; if misclassifications push a server above the over-load boundary, the method's safety depends on forgiving thresholds rather than on accurate forecasts.
Extended reading notes
Core claim
The central claim is that predictive load balancing based on LSTM forecasts plus a four-level Mamdani fuzzy classifier keeps servers in software-defined multimedia IoT networks below the over-load threshold while saving energy. Server load is defined by four normalized resource ratios: $x_i$ for CPU, $y_i$ for memory, $z_i$ for hard disk, and $w_i$ for bandwidth, each current usage divided by capacity as in Equations (1)-(4). The controller forms a $4 \times W$ consumption matrix $f_{h_i}$ for each server and feeds it to a single-layer LSTM with five neurons; lookback is five for CPU, disk, and bandwidth and two for memory. The predicted values $\hat{x}_{t+1}^i$, $\hat{y}_{t+1}^i$, $\hat{z}_{t+1}^i$, $\hat{w}_{t+1}^i$ are mapped through 81 if-then fuzzy rules to one of four levels, and Algorithm 1 routes flows to under-load servers, transfers load away from over-load and highly-load servers, and powers off under-load servers. The reported simulation claims that all four servers stay below over-load across 26 flows, whereas random and round-robin selection leave at least two servers at over-load in the same scenario.
Load-bearing premise
The load-bearing premise is that the LSTM's predicted CPU, memory, disk, and bandwidth usage is accurate enough to put each server in the right fuzzy load class, even though the paper's own memory forecast on server 2 has $R^2=0.51$ and would be used without any uncertainty margin.
Editorial extensions
If this is right
- An SDN controller can move traffic before a server actually overloads, because the LSTM forecast gives a lookahead window of one timestep.
- Under-used servers can be switched off, and their switches with them, cutting energy without sacrificing headroom.
- Because load is judged on four resources, a server with spare CPU but exhausted memory is not mistakenly treated as lightly loaded.
- The four-level classification lets the controller apply graduated responses: moderate action for highly-loaded servers and full migration only for over-loaded ones.
- The scheme remains stable under steadily increasing multimedia traffic: in the reported scenario all servers end at highly-load rather than over-load.
Reading between the lines
- The paper leaves open whether forecast error near a fuzzy boundary could send traffic to a server that is actually closer to overload than predicted; propagating the reported per-metric errors into the classification would quantify this risk.
- Because the baselines are random and round-robin selection, the experiments do not isolate the forecasting contribution; comparing the same fuzzy policy on measured current loads against the LSTM-based policy would do so.
- A testable extension is to feed the fuzzy system prediction intervals instead of point forecasts, hedging classification decisions when the LSTM is uncertain, particularly for memory usage, the metric with the weakest reported fit.
Editorial analysis
A structured set of objections, weighed in public.
Referee Report
Summary. The paper proposes a server load-balancing scheme for software-defined multimedia IoT networks. The controller measures CPU, memory, disk, and bandwidth utilization of each server, uses LSTM to forecast the next-step values of these four metrics, and then applies a four-level fuzzy classifier (under-load, normal-load, highly-load, over-load) to decide where to route new flows and whether to migrate traffic. The algorithm also powers off under-loaded servers and their associated switches to save energy. The evaluation is performed in a Mininet/Floodlight emulation with four servers of different capacities and 26 UDP flows of increasing size; the proposed method is compared with random and round-robin server selection, and the results are shown as qualitative load-level trajectories. The paper also reports LSTM prediction quality (RMSE, MAE, R2) for the four metrics on server 2 and concludes that the approach improves load distribution, service quality, and energy efficiency.
Significance. If validated, the proposed architecture could be a useful proactive load-balancing mechanism for SDN-based multimedia IoT networks, and the use of four resource metrics with a four-level fuzzy classifier is a reasonable extension of earlier three-level schemes. Credit is due for the explicit Algorithm 1, the clear testbed description, and the effort to apply LSTM to server load prediction. However, the current evidence does not support the central claim: the predictive component is not isolated from the power-management logic, no quantitative QoS or energy metrics are reported, and the reported prediction quality is modest. As it stands, the paper is better viewed as a system sketch with a preliminary demonstration rather than a validated contribution.
major comments (5)
- [Section 4, Figures 11-13] The comparison does not isolate the predictive component. The proposed method includes explicit power management: under-loaded servers and their switches are turned off, as described in the text around Figure 11. The random and round-robin baselines are described only as selection schemes, with no mention of equivalent power-down or migration logic. Therefore, the qualitative advantage shown in Figures 11-13 (no overload versus overload) could be entirely due to the power-management or migration policy, not to LSTM forecasting. Furthermore, the paper reports no quantitative metrics for QoS, throughput, latency, or energy consumption, so the abstract's claims of 'improved service quality, reduced operational costs, and increased productivity' are not directly measured. The authors should rerun the evaluation with identical power-management and migration logic across all methods, include an ablation without prediction (e.g., using current loads) and with a simpler predictor, and report numerical metrics such as overload count, energy consumption, and a QoS measure.
- [Sections 3.1 and 4] The LSTM architecture is specified twice with contradictory parameters. Section 3.1 (under 'Model Architecture Details') states a single LSTM layer with five neurons, lookback 5 (or 2 for memory), batch size 1, and 15 epochs. Section 4 states 'The LSTM model consists of two hidden layers, each with 64 hidden units. A batch size of 32 was used during training.' These configurations cannot both describe the experiments that produced Figures 14-17, and the paper does not indicate which configuration was used. This contradiction makes the evaluation unreproducible and must be resolved in a revision.
- [Section 4, dataset description] The dataset description is a placeholder: 'The dataset consists of approximately N records spanning a time period of T hours/days.' This gives no basis for judging the statistical validity of the prediction results. The authors must provide the actual number of records, the time span, the collection environment, and the exact train/test split. They should also report prediction errors for all four servers and all four metrics, not only server 2, because the load-balancing decisions in Algorithm 1 depend on forecasts for every server.
- [Section 1 and Section 4] The claim that LSTM 'has been shown to outperform traditional methods such as NLMS and ANN' is supported only by citation [4], which is a survey of deep neural networks for stock market prediction, not for server load balancing. The evaluation in this paper does not compare LSTM against NLMS or ANN on the server-load data. In addition, the comparison in Section 4 excludes the authors' own earlier NLMS-based method [8] and the earlier conference version of this work [19], which are the most relevant baselines. The authors should either include these baselines in the evaluation or substantially soften the superiority claim.
- [Section 3, 'Determining Server Load Levels Using Fuzzy Systems' and Section 4] The fuzzy classifier takes the predicted values directly as inputs without any treatment of forecast uncertainty. The reported prediction quality for memory on server 2 is R2 = 0.51, which the paper itself describes as 'good' but which leaves a large portion of variance unexplained. Since the load-level classification is entirely determined by these forecasts, the paper should report the classification accuracy of the four-level fuzzy system against ground-truth levels (e.g., a confusion matrix) and discuss how prediction errors propagate to misclassification and suboptimal balancing decisions.
minor comments (5)
- [Section 4, Figures 12 and 13] The captions are mislabeled: Figure 12 is described in the text as the random selection scheme but its caption reads 'Server Load Levels in the Round-Robin Selection Scheme,' and Figure 13 has the same round-robin caption though the text says it shows round-robin. Please correct the captions and the numbering.
- [Section 1, Introduction] The first two paragraphs of the introduction are duplicated verbatim; remove the duplicate passage.
- [Table 2] The capacity symbols are swapped in the table: 𝜗𝑖^𝑧 is described as 'Bandwidth resource capacity' and 𝜗𝑖^𝑤 as 'Hard disk resource capacity,' whereas Equations (3) and (4) use z_i for hard disk and w_i for bandwidth. The same swap appears in the descriptions of f_hdd and f_bw.
- [Section 3.1, Equation (5)] The matrix in Equation (5) contains a malformed entry ('𝑥𝑃1 𝑥𝑃1 …') and the condition '𝑖𝑓 𝑀́ < 𝑃' uses an undefined variable Ḿ; please clarify the notation and the intended structure of the matrix.
- [General] The paper does not state how this journal submission extends the authors' conference paper [19]; briefly describing the difference would help situate the contribution.
Circularity Check
No significant circularity: the LSTM/fuzzy balancing chain is not derived from its own outputs, though the comparison suffers from missing baseline controls.
full rationale
The derivation chain is self-contained in the sense required for circularity analysis. Equations (1)-(4) normalize measured resource consumption; Equation (5) assembles those values into a matrix; the LSTM forecasts x, y, z, and w on a held-out test set with reported RMSE/MAE/R2; the fuzzy system's 81 rules map those forecasts to four load classes; Algorithm 1 then selects destination servers by those classes and re-evaluates post-migration levels. No fitted parameter is renamed as a prediction, no load-balancing outcome is used to define the LSTM inputs, and no uniqueness theorem is imported from the authors' earlier work to force the choice of method. The self-citations ([8], [13], [15], [19]) are used as related-work contrasts or as labels for the Mininet/Floodlight tools (with apparent reference-numbering errors), not as the load-bearing justification for prediction accuracy or the load-balancing effect. The main weaknesses are evidentiary rather than circular: random and round-robin baselines are not given the same power-management/migration logic, no QoS or energy metrics are reported, the dataset description is a placeholder ('approximately N records spanning a time period of T hours/days'), and the claimed LSTM superiority over NLMS/ANN is imported from a stock-market survey [4] rather than measured here. These are correctness, reproducibility, and support concerns, not cases where the derivation reduces to its own inputs.
Assumptions & free parameters
free parameters (3)
- LSTM lookback window =
5 for CPU/disk/bandwidth, 2 for memory
- LSTM hidden configuration and training hyperparameters =
Contradictory: 1 layer x 5 units, 15 epochs, batch 1 versus 2 layers x 64 units, batch 32, learning rate 0.001
- Fuzzy membership boundaries and output range =
Not fully specified; output class range [-0.6, 0.4]
assumptions (3)
- domain assumption The SDN controller can accurately read CPU, memory, disk, and bandwidth usage from every server and can migrate traffic with negligible cost or delay.
- domain assumption Normalized resource forecasts in [0,1] are accurate enough that classifying a server from predicted values reliably reflects its future load.
- domain assumption Iperf UDP flows of 10-260 MB reproduce the traffic properties of multimedia IoT workloads.
Cite this review
Pith. "Pith review of Optimizing Server Load Distribution in Multimedia IoT Environments through LSTM-Based Predictive Algorithms." pith.science (2026). https://pith.science/paper/QM4PFWLM
@misc{pith2026250524806,
  author       = {Pith},
  title        = {Pith review of: Optimizing Server Load Distribution in Multimedia IoT Environments through LSTM-Based Predictive Algorithms},
  year         = {2026},
  howpublished = {\url{https://pith.science/paper/QM4PFWLM}},
  note         = {Machine review of arXiv:2505.24806}
}
read the original abstract
The Internet of Multimedia Things (IoMT) represents a significant advancement in the evolution of IoT technologies, focusing on the transmission and management of multimedia streams. As the volume of data continues to surge and the number of connected devices grows exponentially, internet traffic has reached unprecedented levels, resulting in challenges such as server overloads and deteriorating service quality. Traditional computer network architectures were not designed to accommodate this rapid increase in demand, leading to the necessity for innovative solutions. In response, Software-Defined Networks (SDNs) have emerged as a promising framework, offering enhanced management capabilities by decoupling the control layer from the data layer. This study explores the load balancing of servers within software-defined multimedia IoT networks. The Long Short-Term Memory (LSTM) prediction algorithm is employed to accurately estimate server loads and fuzzy systems are integrated to optimize load distribution across servers. The findings from the simulations indicate that the proposed approach enhances the optimization and management of IoT networks, resulting in improved service quality, reduced operational costs, and increased productivity.
Figures


Figures from the paper (14 more)




Reference graph
Works this paper leans on
-
[19]
Imanpour, S., Montazerolghaem, A., & Afshari, S. (2024, April). Load balancing of servers in software -defined internet of multimedia things using the long short-term memory prediction algorithm. In 2024 10th International Conference on web research (ICWR) (pp. 291-296). IEEE
work page 2024
-
[8]
A.Montazerolghaem , “Software-defined Internet of Multimedia Things: Energy -efficient and Load-balanced Resource Management.” IEEE Internet of Things Journal, vol. 9, 2021, 2432-2442
work page 2021
-
[4]
A. Thakkar and K. Chaudhari, "A comprehensive survey on deep neural networks for stock market: The need, challenges, and futu re directions," Expert Systems with Applications, vol. 177, p. 114800, 2021
work page 2021
-
[1]
Multimedia Internet of Things: A comprehensive surve y
A.Nauman, Y. A.Qadri, M.Amjad , Y.B. Zikria, M.K.Afzal, and S.W. Kim, . “Multimedia Internet of Things: A comprehensive surve y.” Ieee Access, vol.8, 2020, pp.8202-8250
work page 2020
-
[2]
Internet of multimedia things: Vision and challenges
S. A. Alvi, B.Afzal, G. A.Shah, L.Atzori, and W.Mahmood, “Internet of multimedia things: Vision and challenges.” Ad Hoc Networks, vol.33, 2015, pp. 87-111
work page 2015
-
[3]
SDN Controllers: Benchmarking & Performance Evaluation
L. Zhu, M. M. Karim, K. Sharif, F. Li, X. Du, and M. Guizani, "SDN controllers: Benchmarking & performance evaluation," arXiv preprint arXiv:1902.04491, 2019
work page Pith review arXiv 1902
-
[5]
L. A. Zadeh, "Fuzzy sets," Information and control, vol. 8, no. 3, 1965 pp. 338-353
work page 1965
-
[6]
Round -robin based load balancing in Software Defined Networking,
S. Kaur, K. Kumar, J. Singh, and N. S. Ghumman, "Round -robin based load balancing in Software Defined Networking," in 2015 2nd international conference on computing for sustainable global development (INDIACom), 2015: IEEE, pp. 2136-2139
work page 2015
Show all 22 references
-
[7]
LBBSRT: An efficient SDN load balancing scheme based on server response time,
H. Zhong, Y. Fang, and J. Cui, "LBBSRT: An efficient SDN load balancing scheme based on server response time," Future Generation Computer Systems, vol. 68, 2017, pp. 183-190
2017
-
[9]
Load balancing for network resource management i n software-defined networks,
P. Abhishek, A. Naik, P. Doddannavar, R. Patil, M. M. Raikar, and S. Meena, "Load balancing for network resource management i n software-defined networks," in Advances in Distributed Computing and Machine Learning: Proceedings of ICADCML 2022: Springer, 2022, pp. 193-203
2022
-
[10]
Proactive load balancing strategy towards intelligence -enabled software-defined network,
C. Fancy and M. Pushpalatha, "Proactive load balancing strategy towards intelligence -enabled software-defined network," Arabian Journal for Science and Engineering, 2021, pp. 1-8
2021
-
[11]
Adaptive Server Load Balancing in SDN Using PID Neural Network Controller,
R. Malavika and M. L. Valarmathi, "Adaptive Server Load Balancing in SDN Using PID Neural Network Controller," Computer Syste ms Science & Engineering, vol. 42, no. 1, 2022
2022
-
[12]
SDN-based hybrid server and link load balancing in multipath distributed storage systems,
L. Guillen, S. Izumi, T. Abe, T. Suganuma, and H. Muraoka, "SDN-based hybrid server and link load balancing in multipath distributed storage systems," in NOMS 2018-2018 IEEE/IFIP Network Operations and Management Symposium, 2018: IEEE, pp. 1-6
2018
-
[13]
Efficient resource allocation for multimedia streaming in software-defined internet of vehicles,
A. Montazerolghaem, "Efficient resource allocation for multimedia streaming in software-defined internet of vehicles," IEEE Transactions on Intelligent Transportation Systems, vol. 24, no. 12, 2023, pp. 14718-14731
2023
-
[14]
Optimized software -defined multimedia framework: networking and computing resource management,
A. Montazerolghaem, "Optimized software -defined multimedia framework: networking and computing resource management," Journal of Ambient Intelligence and Humanized Computing, vol. 14, no. 9, 2023, pp. 12981-13001
2023
-
[15]
Green cloud multimedia networking: NFV/SDN based energy-efficient resource allocation,
A. Montazerolghaem, M. H. Yaghmaee, and A. Leon-Garcia, "Green cloud multimedia networking: NFV/SDN based energy-efficient resource allocation," IEEE Transactions on Green Communications and Networking, vol. 4, no. 3, 2020, pp. 873-889
2020
-
[16]
Hybrid SDN networks: A multi -parameter server load balancing scheme,
T. Malbašić, P. D. Bojović, Ž. Bojović, J. Šuh, and D. Vujošević, "Hybrid SDN networks: A multi -parameter server load balancing scheme," Journal of Network and Systems Management, vol. 30, no. 2, 2022, p. 30
2022
-
[17]
Software defined networks (SDN): experimentation with Mininet topologies,
D. Kumar and M. Sood, "Software defined networks (SDN): experimentation with Mininet topologies," Indian Journal of Science and Technology, vol. 9, no. 32, 2016, pp. 1-7
2016
-
[18]
Experimenting with scalability of floodlight controller in software defined networks,
S. Asadollahi and B. Goswami, "Experimenting with scalability of floodlight controller in software defined networks," in 2017 International Conference on Electrical, Electronics, Communication, Computer, and Optimization Techniques (ICEECCOT), 2017: IEEE, pp. 288-292
2017
-
[20]
Task scheduling and load balancing in SDN -based cloud computing: A review of relevant research
Mahdizadeh, Masoumeh, Ahmadreza Montazerolghaem, and Kamal Jamshidi. "Task scheduling and load balancing in SDN -based cloud computing: A review of relevant research." Journal of Engineering Research (2024)
2024
-
[21]
Salehnia, T., MiarNaeimi, F., Izadi, S., Ahmadi, M., Montazerolghaem, A., Mirjalili, S., & Abualigah, L. (2024). A MTIS metho d using a combined of whale and moth-flame optimization algorithms. In Handbook of Whale Optimization Algorithm (pp. 625-651). Academic Press
2024
-
[22]
R., & Yaghmaee, M
Montazerolghaem, A. R., & Yaghmaee, M. H. (2013). SIP overload control testbed: Design, building and Evaluation. arXiv preprint arXiv:1307.3411
2013 arXiv
Reviewed August 7, 2026 · model on record in the stance chip above.
Discussion (0). Sign in to comment.