REVIEW 4 major objections 5 minor 16 references
The GROND GRB sample: II. Fireball parameters for four GRB afterglows
T0 review · 4 major / 5 minor · reviewed 2026-08-06 · deepseek-v4-flash
Pith's one-line read Dense radio-to-X-ray monitoring of four gamma-ray burst afterglows lets the authors derive all fireball parameters without prior assumptions: every burst exploded into a stellar-wind medium, and the shock-region magnetic field decays as…
desk verdict Useful data and careful fits, but the B(t) claim is mostly model-built and the SSC handling is unconvincing. read the letter →
The pith
A machine-rendered reading of the paper's core claim, the machinery that carries it, and where it could break.
The reading
What carries the argument
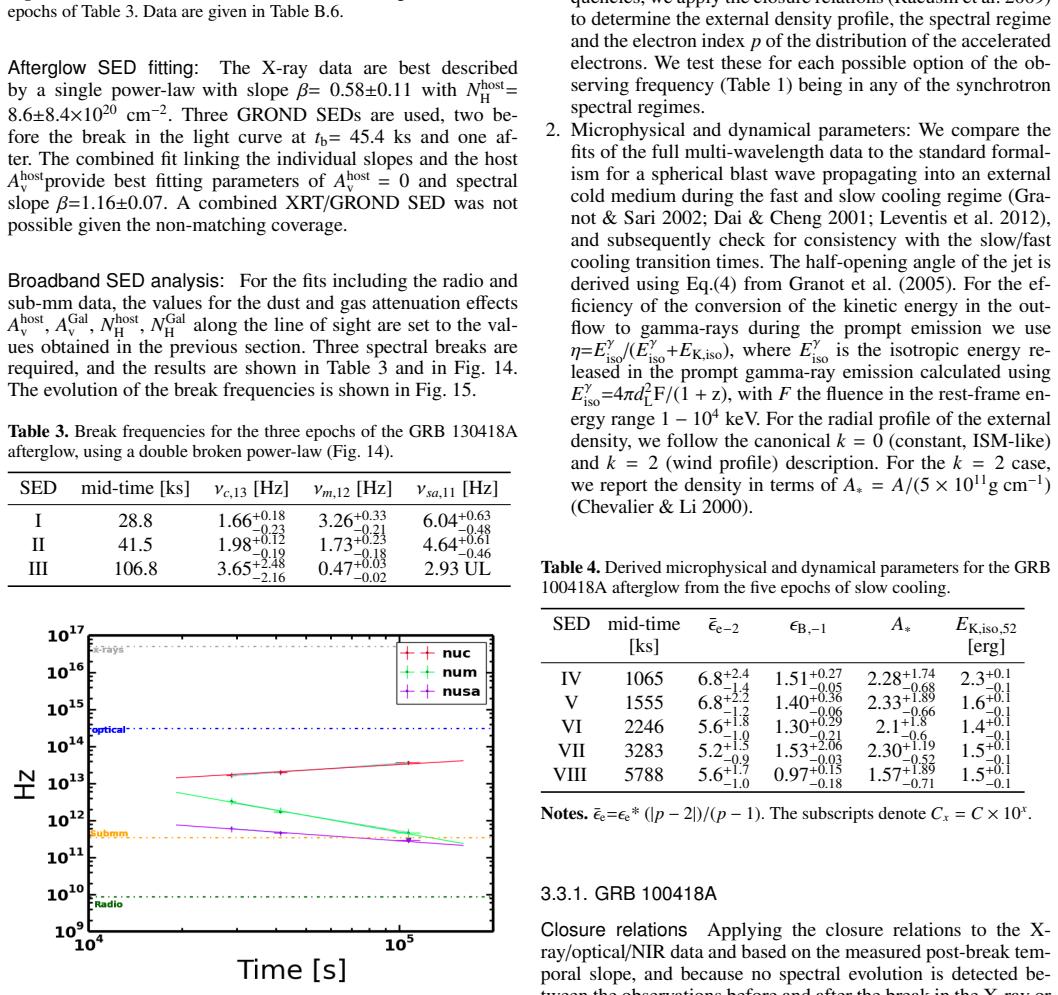
The analysis rests on the standard synchrotron fireball model of Granot & Sari (2002), with the broadband spectrum described by three break frequencies, $\nu_{\rm sa}$, $\nu_{\rm m}$, $\nu_{\rm c}$, plus a peak flux. GROND 7-band optical/NIR photometry, Swift/XRT X-ray data, and radio/sub-mm light curves at several frequencies and epochs are fit simultaneously, using closure relations to identify the spectral regime and the external density profile. The physical parameters are then extracted per epoch from the measured break frequencies with the formulas of Granot et al. (2005), and their temporal evolution—especially the magnetic field $B(t)$—is compared with theoretical scaling predictions.
What would settle it
Recompute the parameters for GRB 110715A and 130418A including SSC cooling in the epochs used here; if the derived magnetic field no longer follows $t^{-3/4}$ or the required seed field changes by orders of magnitude, the central claim fails.
Extended reading notes
Core claim
The authors show that for GRBs 100418A, 110715A, 121024A and 130418A, multi-epoch SED fits with three synchrotron break frequencies ($\nu_{\rm sa}$, $\nu_{\rm m}$, $\nu_{\rm c}$) yield per-epoch values of the electron energy fraction $\epsilon_e$, magnetic energy fraction $\epsilon_B$, wind density normalization $A_*$, and isotropic kinetic energy $E_{\rm K,iso}$, without assuming any of them. All four bursts require a wind-like external density profile ($k = 2$), and the derived magnetic field in the shocked region evolves as $t^{-3/4}$, consistent with shock amplification of the ambient magnetic field; the required seed field in the circumburst medium is about 10 mG. The break frequencies themselves evolve in time as predicted by the standard model, and $\epsilon_e$ is constant over the observed epochs.
Load-bearing premise
The derivation treats the electrons as cooling only through synchrotron emission during the epochs used to measure the magnetic field, even though for at least one burst the derived parameters imply inverse-Compton (SSC) cooling should be significant; if SSC matters, the inferred magnetic field and its time evolution would be biased.
Editorial extensions
If this is right
- The wind-like density profiles found for all four afterglows support the collapsar scenario for long GRBs and suggest that earlier ISM identifications often relied on assumptions or data that could not distinguish the profiles.
- The measured $B(t) \propto t^{-3/4}$ means the magnetic field in the shocked region is consistent with being amplified by shock compression of a pre-existing circumburst field, with a seed field of order a few mG.
- The radio and sub-mm data were decisive: without them the break frequencies $\nu_{\rm sa}$ and $\nu_{\rm m}$ could not be tracked, and the external density profile would remain ambiguous.
- The constancy of $\epsilon_e$ and the measured evolution of the break frequencies provide independent tests of the standard afterglow model across epochs.
Reading between the lines
- If the $B(t) \propto t^{-3/4}$ scaling holds for more afterglows, the common practice of treating $\epsilon_B$ as constant throughout a burst should be replaced by an evolving $\epsilon_B$, which changes energy estimates derived from afterglow modelling.
- The mG seed field, if it is a general property of GRB environments, would mean the medium around the progenitor is far more magnetized than the typical Galactic interstellar field, possibly reflecting the stellar wind or the star-forming region.
- A direct test would be to apply the same epoch-by-epoch, SSC-checked method to other GRBs with full radio-to-X-ray coverage, to see whether the wind preference and the $t^{-3/4}$ slope reproduce or whether they are peculiar to this sample.
Editorial analysis
A structured set of objections, weighed in public.
Referee Report
Summary. The paper presents a detailed multi-wavelength (radio to X-ray) analysis of four GRB afterglows observed with GROND, Swift/XRT, and radio/sub-mm facilities. The authors derive the three synchrotron break frequencies epoch by epoch, obtain physical parameters (E_K, ε_e, ε_B, A*, and jet angles) from the Granot & Sari (2002) formalism, and report two main conclusions: (1) all four bursts expanded into a stellar-wind-like circumburst medium, and (2) the magnetic field in the shocked region evolves as B(t) ∝ t^{-3/4}, which they interpret as evidence for shock compression of a seed CBM field. The paper also compiles a critical list of GRBs with (claimed) complete fireball parameter measurements and compares their results with the literature.
Significance. If the conclusions are robust, the paper provides a rare dataset with break frequencies measured at multiple epochs and a direct look at the temporal evolution of the fireball parameters. The wind-environment result for all four bursts, if free of selection bias, would be an interesting contribution to the debate on GRB progenitor environments. The B(t) ∝ t^{-3/4} claim, however, is the most novel but also the most fragile: the slope is largely an internal consistency check of the adopted synchrotron model, and it rests on epoch-by-epoch ε_B values that may be biased by neglected SSC cooling. The manuscript's strengths are the high-quality, well-calibrated GROND photometry, the explicit handling of host extinction and absorption, the exhaustive compilation in Appendix C, and the clear presentation of the closure-relation logic. These strengths are diminished by the unresolved SSC issue and by the sample-selection bias inherited from the radio-detection requirement.
major comments (4)
- [Sec. 3.3.2 and Sec. 3.3.4] The exclusion of SSC-included solutions is not justified by the presented evidence. For GRB 110715A the text states that ε_e/ε_B > 590 (which implies a Compton parameter Y ≫ 1), yet the parameters listed in Tables 6–7 are obtained from synchrotron-only fits, with the rationale that the SSC fit returns an 'unphysical' ε_B ≈ 10. For GRB 130418A the authors note A* ≈ 45 satisfies the A* > 10 criterion for IC dominance and that SSC dominated the early afterglow, but they again adopt the no-SSC fit because the SSC-included solution gives ε_B ~ 10^3. Discarding a cooling process because the model that includes it gives an uncomfortable parameter is circular: the no-SSC model itself indicates that the process should be important. The derived ε_B, A*, and hence B in Tables 8, 9, and 13 are therefore potentially strongly biased. Since the central B(t) ∝ t^{-3/4} claim (Sec. 4.2.3, Fig. 23) is built on these values, the authors must either self-consistently include SSC cooling in the parameter derivation (e.g., via a Compton parameter Y coupled to ε_e/ε_B) or demonstrate quantitatively that the synchrotron-only results are unaffected when SSC is properly included.
- [Sec. 4.2.3] The 'prediction' B(t) ∝ t^{-3/4} is not independent of the model used to derive B. The paper uses B = (32π m_p c^2 n)^{1/2} γ ε_B^{1/2} with a wind density n ∝ t^{-1} and decelerating dynamics γ ∝ t^{-1/2}. With ε_B assumed constant, this formula automatically gives B ∝ t^{-3/4}. Therefore the measured slopes in Table 13 (0.81 ± 0.05, 0.78 ± 0.04, 0.67 ± 0.04) are a check of internal consistency of the adopted standard model, not evidence for shock compression of a seed field. The text should state this explicitly and, if the claim is to be made, compare against a genuinely alternative model (e.g., a decaying micro-turbulence prescription with a different predicted B(t) scaling) using the same data. As written, the claim in Sec. 5 that the evolution 'is found to be in agreement with the prediction' of shock amplification overstates what the analysis can establish.
- [Sec. 2 and Sec. 5] The sample selection introduces a strong bias that is not adequately discussed. The paper states that of 54 GROND GRBs only 8 have radio detections, and that the four analysed bursts are those with ≥2 radio frequencies over ≥2 epochs and a clean single-synchrotron SED description. This selection likely favors afterglows with bright, well-behaved radio emission, which are more likely to be wind-like or to have favorable geometry. The conclusion that 'all four GRBs exploded into a wind environment' (Sec. 5) and the extrapolation to a 'larger percentage of GRBs associated with a wind profile' (Sec. 4.2.2) therefore conflate a property of the selected sample with a statement about the GRB population. The authors should add an explicit caveat that the wind fraction is measured in a radio-selected sub-sample, and ideally quantify the selection function from the parent GROND sample.
- [Table 13] The reported B(t) slope for GRB 130418A is not well constrained. Table 13 lists α(B) = 0.67 ± 0.04, but this is derived from only two epochs with measurements (Table 9, SED I and II), while SED III provides only limits. A linear fit to two points has no internal scatter, so the quoted uncertainty reflects only the propagated parameter errors and not the true systematics. This row should be reported as a two-point constraint with an appropriate caveat, and the combined evidence in Fig. 23 should clearly distinguish the 2-point result from the 5- and 6-point results for GRBs 100418A and 110715A.
minor comments (5)
- [Throughout] The text uses 'CMB' and 'CBM' interchangeably (e.g., 'circumburst medium (CBM)' in Sec. 3.3.1 and 'CMB profile' in the overall picture of Sec. 3.3.2). Please use CBM consistently to avoid confusion with the cosmic microwave background.
- [Eq. (1)] The third case in Eq. (1) for the double broken power-law appears to have a misprint: the argument of the outer parentheses is not well defined as written. Please verify the formula.
- [Sec. 3.2.2] In the discussion of the GRB 110715A SEDs, the text first reports a pure optical/NIR slope of β = 0.35 ± 0.12 and then a combined optical/XRT slope of β = 1.05 ± 0.01. The reason for this large difference and the final adopted value should be stated more clearly.
- [Sec. 3.3.2] The statement 'ϵ_e/ϵ_B > 590' is given without a formal uncertainty; since the ratio is derived from two parameters with errors, please provide a propagated uncertainty or a range.
- [Appendix C] The compilation in Appendix C is valuable but necessarily subjective; the text acknowledges this, but the sentence in Sec. 4.2.1 that the new GRBs 'tip the balance towards the wind environment' would benefit from an explicit dependence on the inclusion/exclusion criteria used.
Circularity Check
The B(t) ∝ t^{-3/4} agreement is a built-in consequence of the standard model used to derive B, not an independent test of shock compression; the remaining parameter derivation is largely self-contained.
-
fitted input called prediction
[Sec. 3.3.2 (B formula), Sec. 4.2.3, Fig. 23 and Table 13 (B-slope test)]
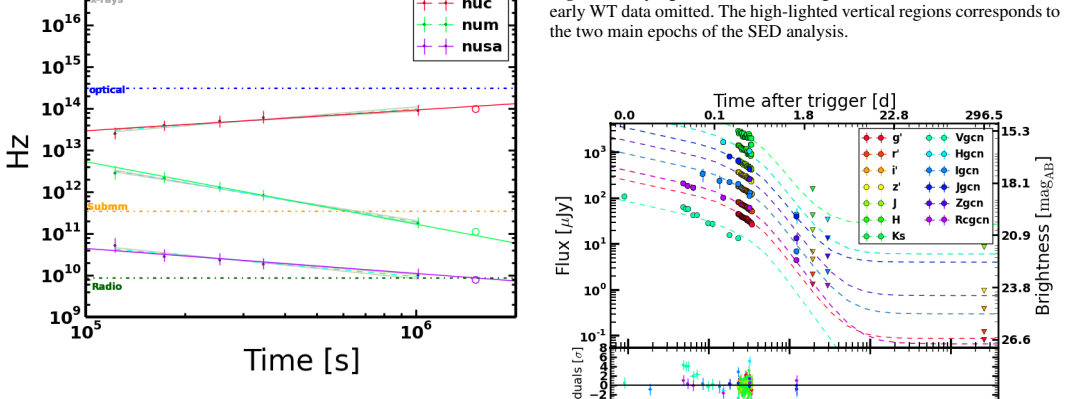
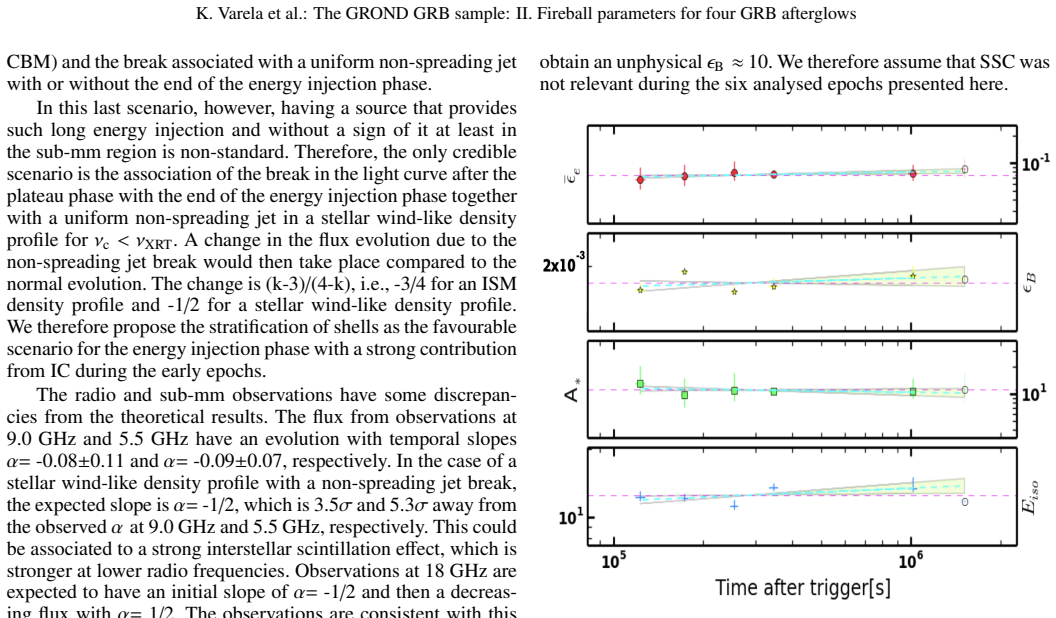
"B = (32πmpc2n)1/2γ ϵB1/2; Sari et al. 1996 ... The evolution that we find follows the predictions for a magnetic field, which originates due to shock compression, t−3/(2(4−k)) (= t−3/4 for our case of k = 2; Blandford & McKee 1976; Rybicki & Lightman 1979; Inoue et al. 2011). It has no additional assumptions or linked parameters among the analysed epochs of each afterglow. This implies that the observed evolution relies completely on the derived parameters for each SED and actually tests the evolution of the magnetic field in the shocked region independently."
The plotted B values are not directly observed; they are computed with the same Granot-Sari standard-model formula used to fit ε_B, with n and γ taken from the assumed wind deceleration dynamics. For constant ε_B that formula gives B ∝ t^{-3/4} identically, because the model has n ∝ r^{-2} and γ ∝ t^{-1/4}. The fitted ε_B slopes (0.20±0.11, 0.04±0.06, -0.29±0.03) are consistent with constant, so the derived B slope is forced near -3/4 by the assumed dynamics. The agreement is therefore a consistency check of the input model, not an independent measurement of B(t) and not an independent test of the shock-compression origin; the claim that the evolution is tested independently is not supported by the construction.
full rationale
The multi-epoch SED analysis is mostly self-contained: break frequencies are measured from broadband radio-to-X-ray data, closure relations select the wind profile, and microphysical parameters are solved epoch by epoch from published synchrotron relations. The wind-environment conclusion, the constancy of ε_e, and the break-frequency evolution tests are genuine data-driven results. The circularity is confined to the headline magnetic-field claim: B(t) is computed from the same Granot-Sari model whose dynamics already imply B ∝ t^{-3/4} for a wind and constant ε_B, so the agreement in Table 13 and Fig. 23 is partly built in. A further correctness risk, not itself a circular step, is that for GRB 110715A the paper finds ε_e/ε_B > 590 and for GRB 130418A A* ≈ 45 with early SSC dominance, yet discards the SSC-included fits because they give ε_B ≈ 10; the no-SSC ε_B values feeding the B(t) test are therefore conditional on an assumption weakened by the authors' own diagnostics. No load-bearing self-citation was found: the use of Varela et al. (2016) for GRB 121024A is a normal reference to a published analysis. Overall, the central B(t) slope claim partially reduces to the model used to derive it, so the score is 6.
Assumptions & free parameters
free parameters (5)
- Break frequencies nu_c, nu_m, nu_sa per epoch =
Tables 1-3
- Energy injection parameter q =
q = 0.23, -0.36, 0.52, 0.14 for the four GRBs (Table 14)
- Host extinction A_v^host =
0.01-0.18 mag (Table 11)
- Host column density N_H^host =
0.08-0.57 x 10^22 cm^-2
- Light curve smoothness parameters sm =
e.g., sm=15 +/- 11, 6.9 +/- 1.3
assumptions (8)
- domain assumption The standard GRB afterglow model as in Granot & Sari (2002): emission is synchrotron radiation from a decelerating relativistic blast wave.
- domain assumption Electron energy distribution is a power law with index p, with p > 2 assumed.
- domain assumption External density profile is either ISM (k=0) or wind (k=2), with no intermediate values.
- domain assumption Energy injection model for plateau phases: L(t) = L0 t^{-q}.
- domain assumption Closure relations are valid and uniquely identify the spectral regime and density profile.
- domain assumption Jet break follows the uniform non-spreading jet model.
- domain assumption Extinction laws (MW, SMC, LMC) from Pei (1992) and Galactic extinction values from Schlafly & Finkbeiner (2011).
- domain assumption Interstellar scintillation can be treated as an added systematic error on radio fluxes.
Cite this review
Pith. "Pith review of The GROND GRB sample: II. Fireball parameters for four GRB afterglows." pith.science (2026). https://pith.science/paper/QNOLFVTY
@misc{pith2026250709002,
  author       = {Pith},
  title        = {Pith review of: The GROND GRB sample: II. Fireball parameters for four GRB afterglows},
  year         = {2026},
  howpublished = {\url{https://pith.science/paper/QNOLFVTY}},
  note         = {Machine review of arXiv:2507.09002}
}
read the original abstract
Afterglows of GRBs are, in general, well described by the fireball model. Yet, deducing the full set of model parameters from observations without prior assumptions has been possible for only a handful of GRBs. With GROND, a 7-channel simultaneous optical and near-infrared imager at the 2.2m telescope of the Max-Planck Society at ESO/La Silla, a dedicated gamma-ray burst (GRB) afterglow observing program was performed between 2007 and 2016. Here, we combine GROND observations of four particularly well-sampled GRBs with public Swift/XRT data and partly own sub-mm and radio data to determine the basic fireball afterglow parameters. We find that all four bursts exploded into a wind environment. We are able to infer the evolution of the magnetic field strength from our data, and find evidence for its origin through shock amplification of the magnetic field of the circumburst medium.
Figures


Figures from the paper (16 more)






Reference graph
Works this paper leans on
-
[1]
Aksulu, M. D., Wijers, R. A. M. J., van Eerten, H. J., & van der Horst, A. J. 2020, MNRAS, 497, 4672 Alexander, K. D., Laskar, T., Berger, E., et al. 2017, ApJ, 848, 69 Antonelli, L. A., Maund, J. R., Palazzi, E., et al. 2010, GRB Coordinates Net- work, 10620 Arnaud, K. A. 1996, in Astron. Soc. Pacific Conf. Ser., V ol. 101, Astronomical Data Analysis Sof...
arXiv 2020
-
[2]
Two epochs during the energy injection phase and five epochs after the break in the light curve
SED mid-time [ks] g′(mAB) r′(mAB) i′(mAB) z′(mAB) J(mVega) H(mVega) Ks(mVega) I* 27.7 18.99 ±0.05 18.64 ±0.05 18.33 ±0.07 18.08 ±0.07 17.63 ±0.07 17.26 ±0.08 17.18 ±0.14 II* 40.2 19.11 ±0.05 18.48 ±0.07 18.77 ±0.06 18.24 ±0.07 17.81 ±0.09 17.49 ±0.10 17.15 ±0.12 I 130.9 20.20 ±0.06 19.87 ±0.06 19.56 ±0.07 19.36 ±0.07 18.93 ±0.09 18.66 ±0.12 18.34 ±0.11 II...
work page 2010
-
[3]
Radio We also use published data from the Very Large Array (VLA), the Australian Telescope Compact Array (ATCA) and the Westerbork Synthesis Radio Telescope (WSRT) (Chandra & Frail 2012; de Ugarte Postigo et al. 2012; Moin et al. 2013). A TCA follow-up observation began on April 20th. The afterglow was followed for three epochs on the 2nd, 38th and 67th d...
work page 2012
-
[8]
(J2000) = 15:50:44.10, -46:14:06.2 with an uncertainty of 0.′′4 in each coordinate (Fig
at position RA, Decl. (J2000) = 15:50:44.10, -46:14:06.2 with an uncertainty of 0.′′4 in each coordinate (Fig. A.1). VLT/X-shooter spectroscopy identified the redshift as z= 0.82 (Piranomonte et al. 2011). Observations continued on the 2nd, 4th, 6th and 8th night after the burst. The data were corrected for the Galactic foreground reddening of E(B− V)=0.5...
work page 2011
-
[9]
LABOCA started observations on July 16 at 23:21 UT, observed for about 1.47 hours, and detected the source with a flux of 11.0±2.3 mJy (de Ugarte Postigo et al. 2011). ALMA observed the source 2.5 days after the detection by Swift. The source was detected with a flux of 4.9±0.60 mJy (de Ugarte Postigo et al. 2012). Radio: ATCA Radio observations were perf...
work page 2011
-
[10]
The observations at 9.0 GHz resulted in four detections and one upper limit
and continued for more than 2.5 months at four different frequencies (5.5, 9.0, 18.0, and 44.0 GHz). The observations at 9.0 GHz resulted in four detections and one upper limit. Details on the fluxes are given in Table B.5 and Fig. 9 (Chandra & Frail 2012). Table B.4. Observed GROND magnitudes of the GRB 110715A afterglow for the epochs used in the SED an...
work page 2012
-
[11]
Radio observations include an additional systematic uncertainty of 30% to take into account the effects of interstellar scintillation. B.3. GRB 130418A Swift On April 18th 2013 the Swift Burst Alert Telescope detected GRB 130418A (de Pasquale et al
work page 2013
-
[12]
Swift slewed to the position of the GRB and started observations 129.7 seconds after the trigger
at 19:00:53 UT. Swift slewed to the position of the GRB and started observations 129.7 seconds after the trigger. The X-ray afterglow was detected by Swift/XRT at a position RA, Decl.(J2000)= 09:56:9.05, 13:39:55.4 with an uncertainty of 5.′′3. The observations were performed in Windowed Timing (WT) mode within the time interval from T0 + 136 s to T0 + 35...
work page 2007
Show all 16 references
-
[13]
The observations were performed simultaneous in 7 bands in a wavelength range from 400-2400 nm ( g′r′i′z′JHK s)
and continued for the next three hours. The observations were performed simultaneous in 7 bands in a wavelength range from 400-2400 nm ( g′r′i′z′JHK s). The optical counterpart was detected in all 7 bands at a position RA, Decl.(J2000) = 09:56:8.85, 13:40:02.0 with an uncertai...
2014
-
[15]
(2007) assumeϵe,ϵB<1/3 – 050820A: Cenko et al
– 050416A: Withνa unconstrained, Soderberg et al. (2007) assumeϵe,ϵB<1/3 – 050820A: Cenko et al. (2010) find two alternative solutions with different p. – 051022: Without optical detection, no distinction between ISM and wind environment is possible, and ϵe and ϵB are not well...
2007
-
[16]
standard
– 090510: Beniamini et al. (2015) assumeϵe= 0.1 – 090902B: Cenko et al. (2011) find a better fit for an ISM density profile, but fix either ϵB (according to their Tab.10) or ϵe (according to their text) at the equipartition value. Beniamini et al. (2015) assume ϵe= 0.1. Lemoin...
2015
-
[2003]
– 021004: Björnsson et al
– 020813: Panaitescu (2005) find no unique solution, with fireball parameters varying drastically depending on the model. – 021004: Björnsson et al. (2004) set p=2.2, and the jet break time is set from the polarisation variation, though it is not seen in the optical light curv...
2005
-
[2005]
The analysis of the white filter data of the first 150 seconds located the source at RA, Decl
observed the afterglow during the same time interval as Swift/XRT. The analysis of the white filter data of the first 150 seconds located the source at RA, Decl. (J2000.0)=17:05:26.96, 11:27:41.9 with an uncertainty of 1.′′0 (Marshall et al. 2010). The observations show an ini...
2010
-
[2010]
The afterglow was detected in all 7 bands at the position RA, Decl
and continued for 6 hours during the first night. The afterglow was detected in all 7 bands at the position RA, Decl. (J2000) = 17:05:27.09, 11:27:42.3 with an uncertainty of 0.′′4 in each coordinate (Fig. A.1). VLT/X-shooter spectroscopy of this optical afterglow revealed a r...
2010
-
[2011]
Swiftslewed immediately to the position of the burst, and the observations started 90 s after the trigger
the SwiftBurst Alert Telescope triggered on and located GRB 110715A. Swiftslewed immediately to the position of the burst, and the observations started 90 s after the trigger. The afterglow was located at RA, Decl. (J2000) = 15:50:44.07, -46:14:09.0 with an uncertainty of 2.′′...
2011
-
[2013]
It was also observed at frequencies of 4.95 GHz, 4.9 GHz and 7.9 GHz (see Table B.3)
between 2 and 157 days after the trigger. It was also observed at frequencies of 4.95 GHz, 4.9 GHz and 7.9 GHz (see Table B.3). B.2. GRB 110715A Swift On 2011 July 15 at T0 = 13:13:50 UT (Sonbas et al
2011
Reviewed August 6, 2026 · model on record in the stance chip above.
Discussion (0). Continue with ORCID to comment.