REVIEW 4 major objections 5 minor 11 references
Photospheric nitrogen abundances and carbon 12C/13C ratios of red giant stars
T0 review · 4 major / 5 minor · reviewed 2026-08-14 · deepseek-v4-flash
Pith's one-line read Red giants' carbon isotope ratios defy standard mixing theory, a 239-star survey finds.
desk verdict Honest and useful red-giant abundance paper, but the headline null result—no 12C/13C correlation with CN-cycle anomalies—is only as solid as the weak 13CN lines it rests on. read the letter →
The pith
A machine-rendered reading of the paper's core claim, the machinery that carries it, and where it could break.
The reading
What carries the argument
The analysis rests on synthetic spectrum fitting of a set of $^{12}\mathrm{CN}$ and $^{13}\mathrm{CN}$ lines in the ~8002–8005 Å window. The fit varies a molecular occupation factor $\varphi_{\mathrm{CN}}$ (which scales the CN line strengths and, together with the known carbon abundance, yields $[\mathrm{N}/\mathrm{Fe}]$) and the $^{12}\mathrm{C}/^{13}\mathrm{C}$ ratio as a free parameter; the weak $^{13}\mathrm{CN}$ feature near 8004.5 Å carries the isotope information. Telluric water-vapor lines are removed by dividing by a rapid rotator's spectrum, and solutions are graded by eye into reliable and less reliable classes.
What would settle it
Re-observe a subset of the program stars at higher signal-to-noise and measure $^{12}\mathrm{C}/^{13}\mathrm{C}$ from an independent isotopic indicator, such as $^{13}\mathrm{CO}$ lines near 2.3 $\mu$m or a different $^{13}\mathrm{CN}$ band, and check whether stars with reported $^{12}\mathrm{C}/^{13}\mathrm{C} > 30$ still retain high values when the 8004.5 Å region is not used.
Extended reading notes
Core claim
The paper reports that while $[\mathrm{N}/\mathrm{Fe}]$ behaves as first-dredge-up theory predicts—supersolar, anti-correlated with $[\mathrm{C}/\mathrm{Fe}]$, correlated with $[\mathrm{Na}/\mathrm{Fe}]$, and increasing with luminosity and rotation—the $^{12}\mathrm{C}/^{13}\mathrm{C}$ ratios are essentially decoupled from those abundance anomalies. Stars with strong CN-cycle contamination ($[\mathrm{N}/\mathrm{Fe}]\sim +0.4$) show $^{12}\mathrm{C}/^{13}\mathrm{C}$ values anywhere from about 5 to 50, even though theory predicts a tight inverse relation between $^{13}\mathrm{C}$ enrichment and nitrogen enhancement. The authors therefore argue that the photospheric $^{12}\mathrm{C}/^{13}\mathrm{C}$ of red giants is not controlled solely by the amount of CN-cycled material mixed to the surface, and that current understanding of this ratio is incomplete.
Load-bearing premise
The $^{12}\mathrm{C}/^{13}\mathrm{C}$ measurement hinges on the strength of the very weak $^{13}\mathrm{CN}$ line at about 8004.5 Å, which sits among telluric water-vapor features; if imperfect telluric removal biases that line, the reported scatter and null correlation could be an artifact.
Editorial extensions
If this is right
- If the disconnect is real, standard first dredge-up augmented by thermohaline and rotational mixing cannot fully account for the carbon isotope ratios of intermediate-mass red giants.
- A new or additional mechanism controlling $^{13}\mathrm{C}$ destruction or surface enrichment must operate independently of the processes that set C, N, and Na abundances.
- Large-sample surveys of $^{12}\mathrm{C}/^{13}\mathrm{C}$ against $[\mathrm{C}/\mathrm{N}]$ should reveal the same scatter if the effect is physical rather than a measurement artifact.
- The wide range of $^{12}\mathrm{C}/^{13}\mathrm{C}$ at fixed $[\mathrm{N}/\mathrm{Fe}]$ means isotope ratios alone are not a reliable quantitative dredge-up indicator for individual stars.
Reading between the lines
- If the highest $^{12}\mathrm{C}/^{13}\mathrm{C}$ values are real, they may point to heterogeneity in the efficiency of extra mixing on the red giant branch, possibly related to rotation history or structural differences between red clump and first-ascent stars.
- A testable extension is to correlate the residuals in $^{12}\mathrm{C}/^{13}\mathrm{C}$ with the quality of the telluric correction, for instance the depth of residual spectral features, to see whether the scatter shrinks when only the cleanest spectra are used.
- The peak near $^{12}\mathrm{C}/^{13}\mathrm{C}\approx 20$ could reflect a population that has undergone only mild mixing, while the high-ratio tail may be contaminated by systematic errors; distinguishing these possibilities would require an independent isotopic indicator such as $^{13}\mathrm{CO}$ near 2.3 $\mu$m.
Signed reviews
Editorial analysis
A structured set of objections, weighed in public.
Referee Report
Summary. This paper presents determinations of [N/Fe] and 12C/13C for 239 late-G/early-K giant stars from the Okayama Planet Search program, based on spectrum fitting to the 12CN and 13CN lines in the 8001–8006 Å region. Atmospheric parameters are taken from the authors' earlier work (Paper I), luminosities are updated with Gaia DR2 parallaxes, and the analysis also fits the molecular scaling factor phi_CN, the isotope ratio, the Fe abundance, and broadening parameters. The [N/Fe] results are supersolar on average, anti-correlated with [C/Fe] and correlated with [Na/Fe], with mixing appearing to increase with luminosity (or mass) and rotational velocity; these trends are consistent with canonical and rotation/thermohaline mixing theory and agree in broad terms with five earlier studies. In contrast, the derived 12C/13C ratios are reported to be diversified (roughly 5–50, peaking near 20) with no systematic dependence on C/N or N/Fe anomalies, in apparent conflict with Lagarde et al. (2012, 2019) predictions. The authors present comparisons with Lambert and Ries (1981), Kærgaard et al. (1982), Berdyugina (1993, 1994), Mishenina et al. (2006), and Tautvaišienė et al. (2010, 2013), and they explicitly caution that the 12C/13C determination is delicate, that even class-A values carry errors of the order of several tens of percent, and that systematic errors due to imperfect telluric-line removal cannot be ruled out.
Significance. If the isotope-ratio result is robust, the absence of any 12C/13C–[C/N] correlation in a sample of this size is an important challenge to current first-dredge-up and rotation/thermohaline mixing models for red giants, and it would warrant new observational and theoretical work. The nitrogen-abundance part is a solid, useful confirmation of established abundance trends on a large homogeneous sample, with the comparisons against five independent studies in figures 5–9 providing meaningful external validation; the online data table is a valuable community product. However, the central negative claim about 12C/13C depends entirely on the fidelity of weak 13CN features that the authors themselves describe as difficult, telluric-affected, and carrying errors comparable to the observed scatter. The significance of the paper therefore hinges on a quantitative error treatment that is currently absent, and the reported diversification and null correlation cannot yet be distinguished from measurement artifacts.
major comments (4)
- [§3.2, §5.3] No per-star uncertainties are provided for 12C/13C, and the only quantitative statement, that 'errors at least on the order of several tens percent may be involved even for the reliable class-A solutions' (§3.2), is of the same order as the reported dispersion (σ = 7.5 on a mean of 17.9 for the 115 class-A stars). With individual errors comparable to the quoted scatter, neither the claim of diversification (range 5–50) nor the claimed null correlation with [C/N] and [N/Fe] is established: the observed scatter could be dominated by measurement noise, and the theoretically predicted trend (12C/13C dropping from roughly 25 to 10 across the relevant abundance range in figure 12) could be washed out entirely. I request per-star error bars derived from the fitting covariance and from propagation of the adopted atmospheric-parameter uncertainties, together with a demonstration that the intrinsic dispersion and the absence of correlation survive under a realistic noise model.
- [§2, §3.1, §5.3] The paper itself flags the principal hazard to its central claim: §2 states that imperfect telluric removal occasionally influenced the weak 13CN lines near 8004.7 Å, §3.1 concedes that the 13CN determination is 'difficult and delicate', and §5.3 admits that 'we cannot rule out a possibility that our large 12C/13C values might suffer appreciable systematic errors'. Because the telluric correction is a division by a rapid rotator with no per-star diagnostic of residual contamination, a systematic residual that suppresses the weak 13CN feature would inflate 12C/13C and could generate exactly the large high-ratio values that drive the reported diversity and the lack of correlation with CN-cycle indicators. The manuscript needs a quantitative sensitivity test, such as refitting after perturbing the telluric residual at the 13CN wavelengths by plausible amounts, or analyzing separately the subset of spectra judged to have the cleanest telluric removal, and it must show that the null result is robust under that test. As it stands, the central negative result cannot be distinguished from this acknowledged systematic effect.
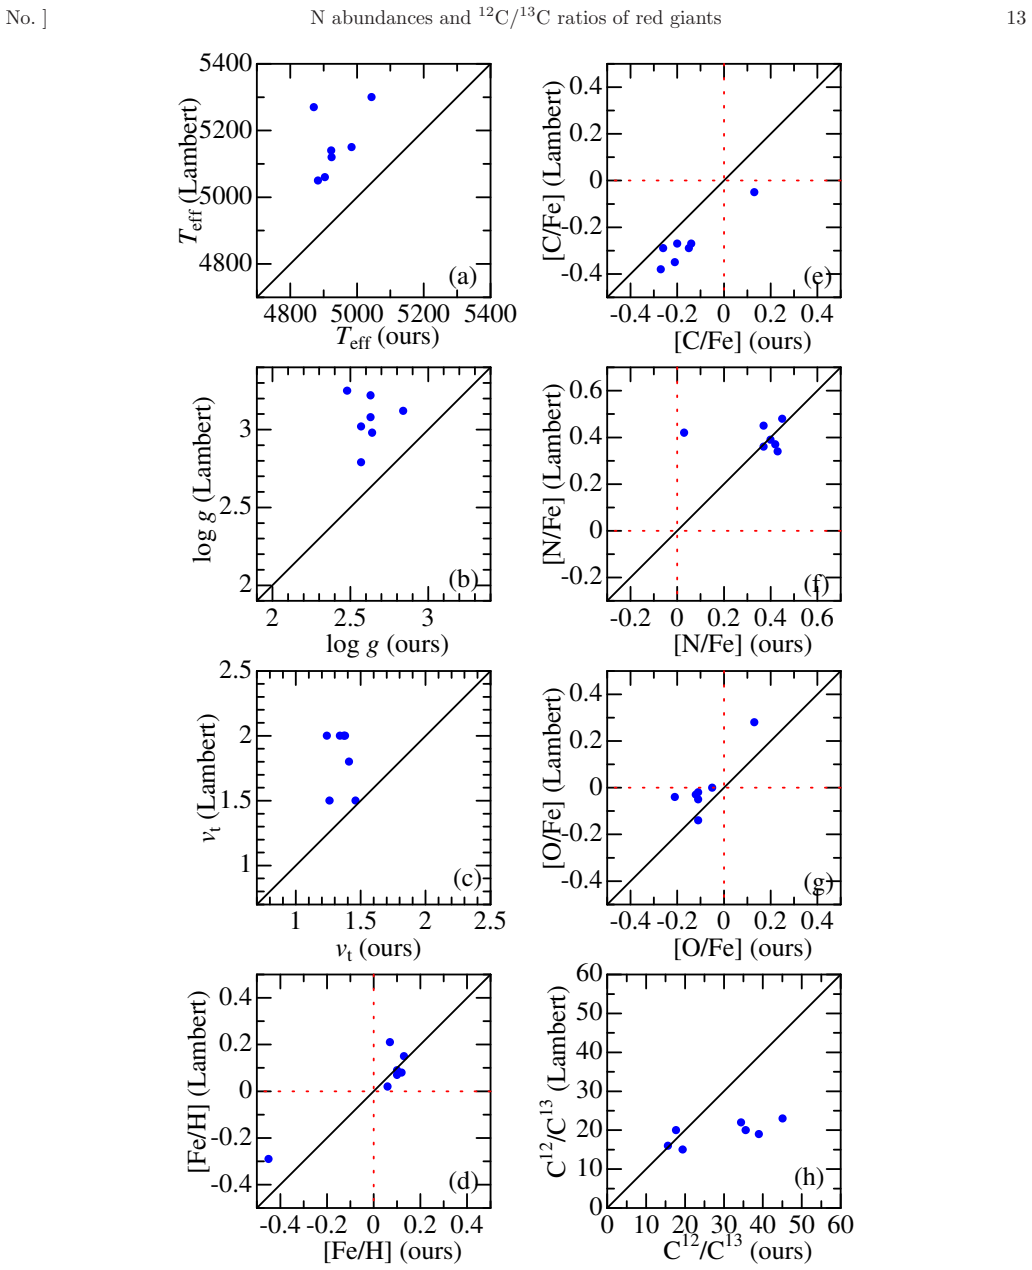
- [§4.1, Table 2] The comparison with Lambert and Ries (1981) in figure 5h shows a systematic offset toward smaller published 12C/13C values, which the authors attribute to differences in microturbulence without demonstrating it. Table 2 evaluates the parameter sensitivity of log φCN and of the derived N, C, O, and Na abundances, but the sensitivity of the 12C/13C ratio itself to Teff, log g, and vt is never quantified. Given that the paper's central claim is a null correlation of 12C/13C with mixing indicators, the dependence of the isotope ratio on the adopted atmospheric parameters should be computed explicitly (for example, by perturbing each parameter for a few representative stars and refitting), both to test the proposed vt explanation of the offset and to bound model-dependent systematics that could masquerade as astrophysical scatter.
- [§3.1, §5.3] Of the 191 adopted 12C/13C values, 76 are class-B solutions described as 'not necessarily satisfactory fit though acceptable', and only 115 are class-A. The paper reports the mean and dispersion for the combined sample and notes a similar mean for class A alone, but it does not state whether the high-ratio tail (12C/13C > 30) or the apparent absence of correlation with [C/N] and [N/Fe] is robust when only the 115 class-A stars are considered. This check is necessary because the class-B measurements are, by the authors' own definition, the ones most likely to be affected by the telluric-residual problem described in §2, and the central qualitative conclusion must not rest on their inclusion.
minor comments (5)
- [§1] The sentence 'That is,, N abundances can be obtained...' contains a duplicated comma.
- [§1] The citation 'Carberg et al. 2012' is a typo for Carlberg et al. (2012).
- [§4.1] The reference to 'their larger vt (figure 4c)' should point to figure 5c, which is the microturbulence comparison with Lambert and Ries; figure 4 shows the spectral fits.
- [§5.1] The phrase 'the results of [N/Fe] and 12C/13 de-rived' is missing the final 'C' in the isotope-ratio symbol.
- [§4, figures 5–9] The comparison figures would be more informative with a 1:1 line and the number of common stars stated in each panel; in particular, figure 7h, the only direct external check of the 12C/13C scale, deserves a brief quantitative statement of the agreement beyond the figure caption.
Circularity Check
No circularity: derived abundances are spectral fits validated against external benchmarks.
full rationale
The paper's derivation chain is self-contained: [N/Fe] and 12C/13C are obtained by synthetic-spectrum fitting of the 12CN/13CN lines in the 8002–8005 Å region, with [N/Fe] derived as [phi_CN] - [C/Fe] (Eq. 1). This equation is the standard algebraic inversion of the C x N product that controls CN line strength, not a circular prediction, because phi_CN is fit from the CN spectrum while [C/Fe] comes from independently measured C I lines, and the resulting N abundances are checked against the external studies of Lambert & Ries, Berdyugina, Tautvaisiene et al., and others. The 12C/13C ratio is fixed by the relative strengths of 12CN and 13CN lines; the reported absence of correlation with [C/N] or [N/Fe] is therefore an empirical result rather than an input of the fit. The paper does rely heavily on the authors' earlier Papers I and II for stellar parameters, [C/Fe], [O/Fe], and [Na/Fe], but this self-citation is not load-bearing in a circular sense: those quantities are benchmarked against external works (Figures 5-9) and the theoretical comparison uses independent Lagarde et al. models. The paper's own caveats about telluric-contamination residuals affecting weak 13CN lines and the 'several tens percent' error estimate are measurement-validity risks that could bias the null result, but they are not circularity: no parameter is fitted to a subset of data and then renamed as a prediction, and no equation reduces to its own input by construction. Hence no significant circularity.
Assumptions & free parameters
free parameters (3)
- 12C/13C ratio (per star) =
ranging ~5-50, peak ~20
- varphi_CN (molecular scaling factor, per star) =
not reported per star; solar value -0.15 dex
- solar log varphi_CN offset =
-0.15 dex
assumptions (4)
- domain assumption LTE and 1D plane-parallel model atmospheres from Paper I are adequate for CN line formation.
- domain assumption The CN molecule population is proportional to the product of C and N abundances.
- domain assumption The C abundances from Paper I (from C i lines) are accurate.
- domain assumption Telluric line division with a rapid rotator removes telluric contamination without introducing systematic residuals at 13CN wavelengths.
Cite this review
Pith. "Pith review of Photospheric nitrogen abundances and carbon 12C/13C ratios of red giant stars." pith.science (2026). https://pith.science/paper/QROKLEG7
@misc{pith2026190807670,
  author       = {Pith},
  title        = {Pith review of: Photospheric nitrogen abundances and carbon 12C/13C ratios of red giant stars},
  year         = {2026},
  howpublished = {\url{https://pith.science/paper/QROKLEG7}},
  note         = {Machine review of arXiv:1908.07670}
}
read the original abstract
Nitrogen abundances and carbon isotope ratios (12C/13C) in the atmospheres of red giants are known to be influenced by dredge-up of H-burning products and serve as useful probes to study the nature of evolution-induced envelope mixing. We determined the [N/Fe] and 12C/13C ratios for 239 late-G/early-K giant stars by applying the spectrum-fitting technique to the 12CN and 13CN lines in the ~8002-8005A region, with an aim to investigate how these quantities are related to other similar mixing-affected indicators which were already reported in our previous work. It was confirmed that [N/Fe] values are generally supersolar (typically by several tenths dex though widely differ from star to star), anti-correlated with [C/Fe], and correlated with [Na/Fe], as expected from theory. As seen from their dependence upon stellar parameters, it appears that mixing tends to be enhanced with an increase of stellar luminosity (or mass) and rotational velocity, which is also reasonable from the theoretical viewpoint. In contrast, the resulting 12C/13C ratios turned out to be considerably diversified in the range of ~5-50 (with a peak around ~20), without showing any systematic dependence upon C or N abundance anomalies caused by the mixing of CN-cycled material. It thus appears that our understanding on the photospheric 12C/13C ratios in red giants is still incomplete, for which more observational studies would be required.
Figures


Figures from the paper (10 more)



Reference graph
Works this paper leans on
-
[1]
2006, in 36th COSPAR Scientific Assembly, 36, 3749 Berdyugina, S
Baglin, A., et al. 2006, in 36th COSPAR Scientific Assembly, 36, 3749 Berdyugina, S. V. 1993, Astron. Lett., 19, 378 Berdyugina, S. V. 1994, Astron. Lett., 20, 631 Bressan, A., Marigo, P., Girardi, L., Salasnich, B., Dal Cer o, C., Rubele, S., & Nanni, A., 2012, MNRAS, 427, 127 Bressan, A., Marigo, P., Girardi, L., Nanni, A., Rubele, S., 2013, EPJ Web of C...
arXiv 2006
-
[2]
Adopted data of spectral lines. Species λair χlow log gf Source (˚ A) (eV) (dex)Fe i 7998.944 4.371 +0.1489 CCSM 12CN 7999.214 1.400 − 2.0287 CCSM 12CN 7999.214 1.600 − 1.8041 CCSM 13CN 7999.408 0.090 − 1.6383 CCSM 13CN 7999.460 1.460 − 1.2644 CCSM 13CN 7999.465 0.220 − 1.7282 CCSM 12CN 7999.846 0.100 − 1.9830 CCSM 12CN 8000.261 0.190 − 1.4962 CCSM 12CN 8...
work page 2012
-
[5]
(a) Teff , (b) log g, (c) vt, (d) [Fe/H]
Comparison of the adopted atmospheric parameters and the re sulting abundances with those of Lambert and Ries (1981) for 7 stars in common. (a) Teff , (b) log g, (c) vt, (d) [Fe/H]. (e) [C/Fe], (f) [N/Fe], (g) [O/Fe], and (h) 12C/13C. 14 Y. Takeda et al. [Vol. , 4600 4800 5000 5200 4600 4800 5000 5200 Teff (ours) Teff (Kaergaard) (a) 2 2.5 3 2 2.5 3 log g ...
work page 1981
-
[6]
Comparison of the adopted atmospheric parameters and the re sulting abundances with those of Kærgaard et al. (1982) for 16 stars in common. Otherwise, the same as in figure
work page 1982
-
[7]
Comparison of the adopted atmospheric parameters and the re sulting abundances with those of Berdyugina (1993,
work page 1993
-
[8]
Comparison of the adopted atmospheric parameters and the re sulting abundances with those of Mishenina et al. (2006) for 11 stars in common. Otherwise, the same as in figure
work page 2006
-
[9]
Comparison of the adopted atmospheric parameters and the re sulting abundances with those of Tautvai˘ sien˙ e et al. (2010,
work page 2010
-
[12]
Teff -dependence (top and middle panels) and mutual relation (bo ttom panels) of log[ X(N)/X(N)0] (logarithmic mass fraction ratio of N at the surface relative to the initial val ue) and X(12C)/X(13C) ratio theoretically simulated by Lagarde et al. (2012). The left panels are for z = 0.004 (0 .3× solar metallicity) and the right are for z = 0.014 (1 × sola...
work page 2012
Show all 11 references
-
[13]
[Fe/H], (b) 12C/13C vs
(a) [C/N] vs. [Fe/H], (b) 12C/13C vs. [C/N], and (c) [N/C] vs. [O/C] correlations derived for the 239 program stars. Panels (a) and (b) should be compared with Fig. 6 and Fi g. 11 of Lagarde et al. (2019), respectively; and panel (c) is for comparison with Fig. 13h of Takeda, ...
2019
-
[1997]
used i n Paper I for evaluating stellar luminosities with the Gaia DR2 parallaxes (Gaia Collaboration et al. 2016,
2016
-
[2018]
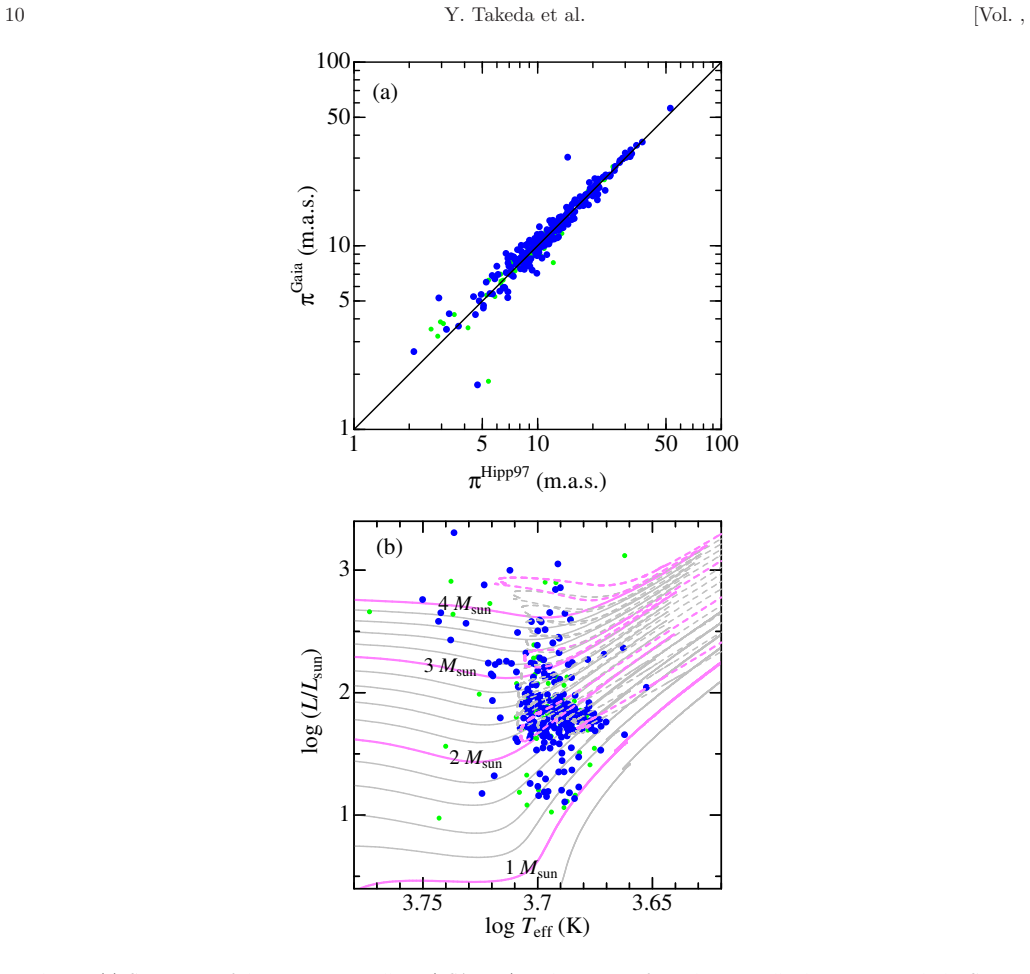
adopt ed in this paper. Our sample stars are denoted by larger (blue ) symbols, while those stars studied only in Paper I (but not included in this study as well as in Paper II) are by smaller (green) ones. (b) Theoretical evolutionary tracks illustrated on the log Teff –log L/...
2012
Reviewed August 14, 2026 · model on record in the stance chip above.
Discussion (0). Continue with ORCID to comment.