Origin of the chromospheric three-minute oscillations in sunspot umbrae
Pith reviewed 2026-05-25 17:18 UTC · model grok-4.3
The pith
Numerical simulations show that both chromospheric acoustic resonances and direct upward propagation of three-minute waves explain the observed oscillations in sunspot umbrae.
A machine-rendered reading of the paper's core claim, the machinery that carries it, and where it could break.
Core claim
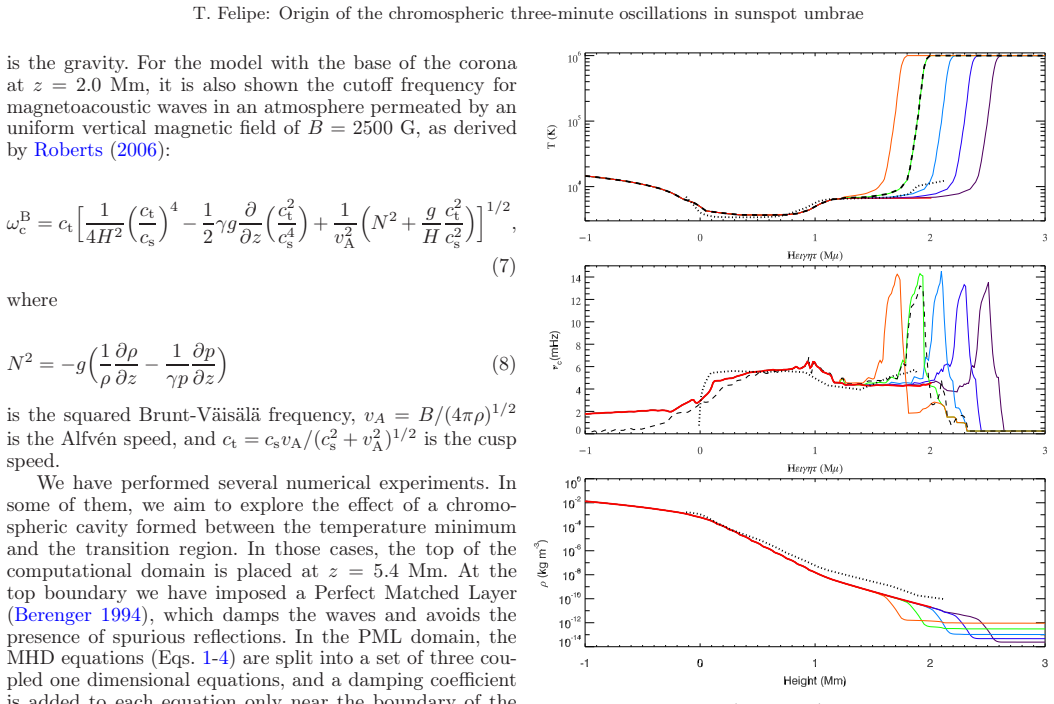
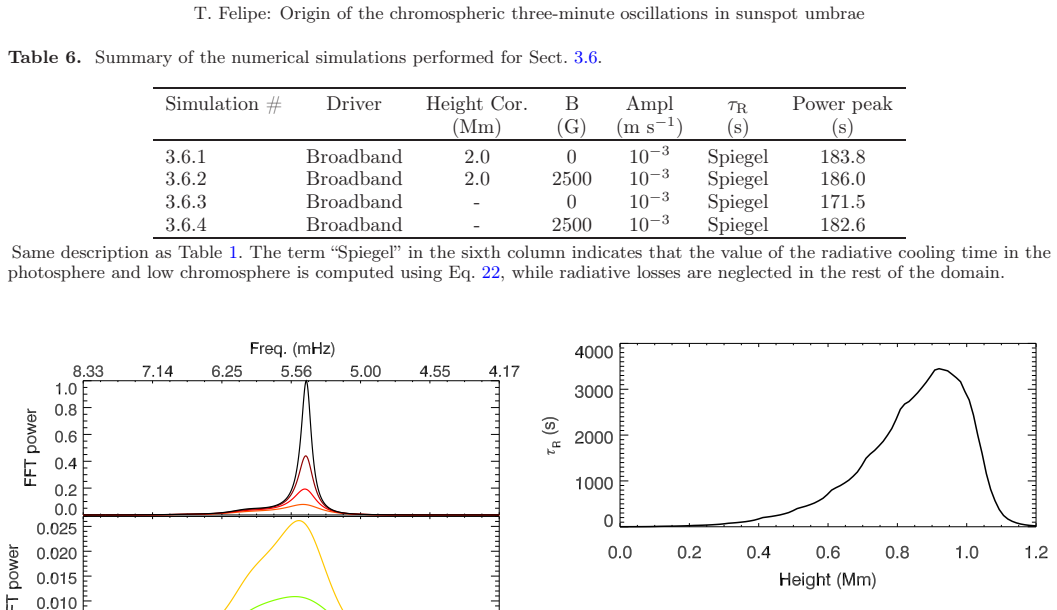
The chromospheric acoustic resonator model and the propagation of waves in the three-minute band directly from the photosphere can explain the observed chromospheric three-minute oscillations. They are both important in different scenarios. Resonances are produced by waves trapped between the temperature minimum and the transition region. Strong magnetic fields and radiative losses remove energy from the waves inside the cavity, resulting in weaker amplitude resonances.
What carries the argument
The chromospheric acoustic resonator formed by partial trapping of waves between the temperature minimum and the transition region, combined with density-driven amplification of three-minute waves propagating upward from the photosphere.
If this is right
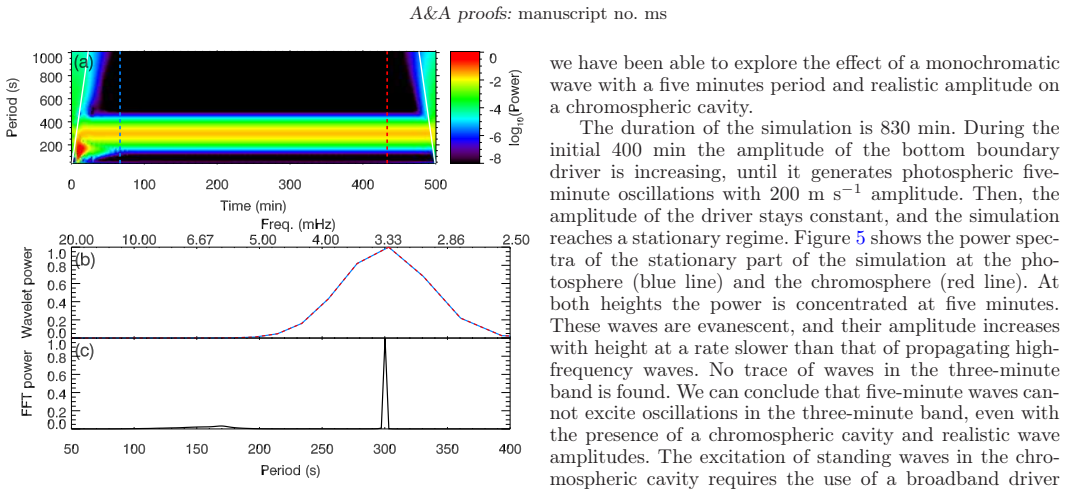
- Waves with periods in the three-minute band must already exist at the photosphere for either mechanism to produce the observed chromospheric dominance.
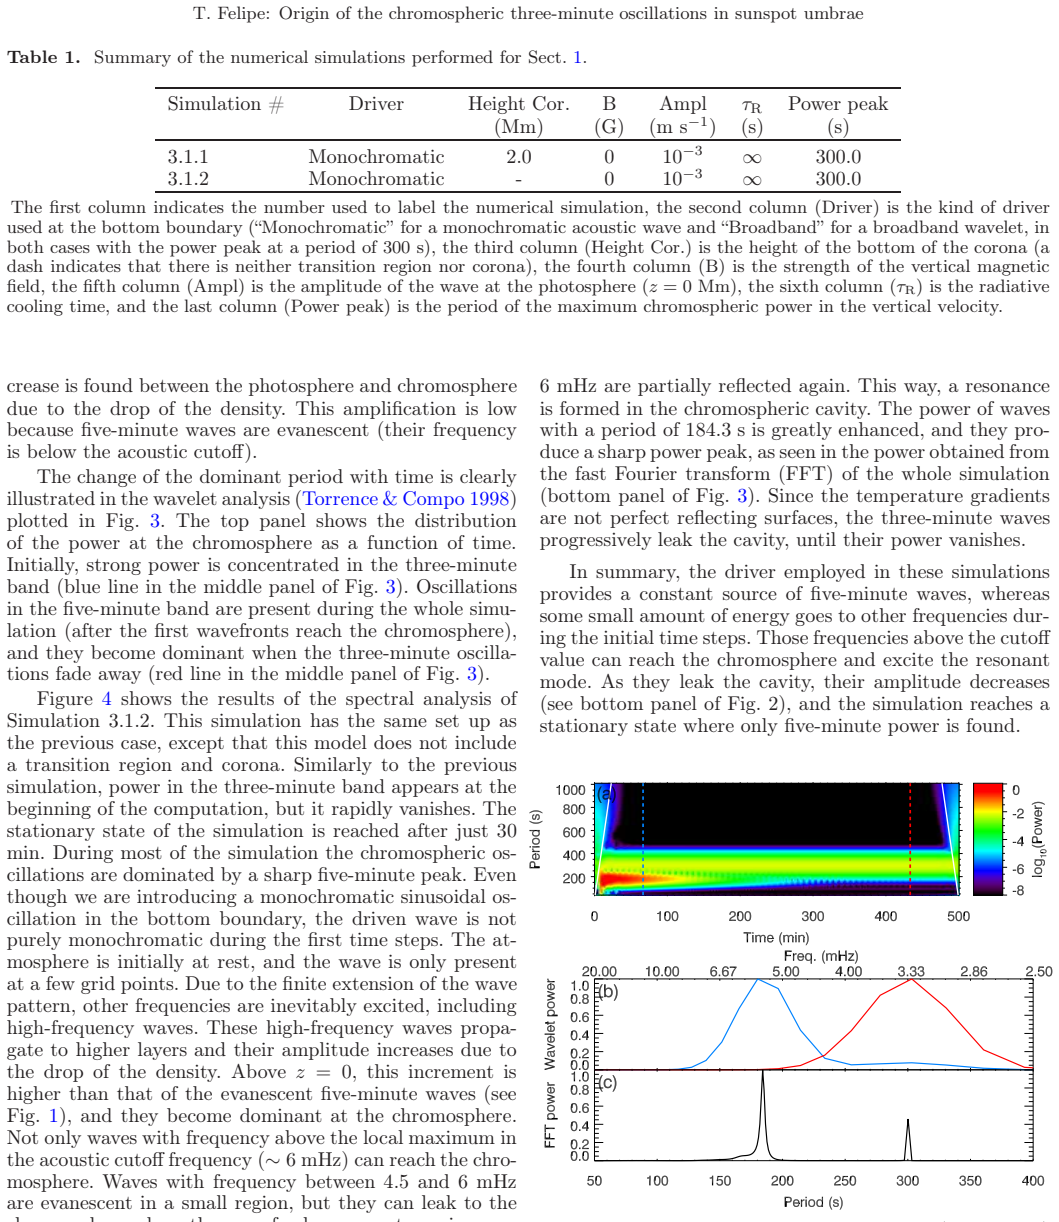
- The drop in density with height amplifies three-minute waves more than evanescent five-minute waves, shifting the dominant period.
- Partial wave trapping between the temperature minimum and transition region creates resonances that strongly enhance three-minute power.
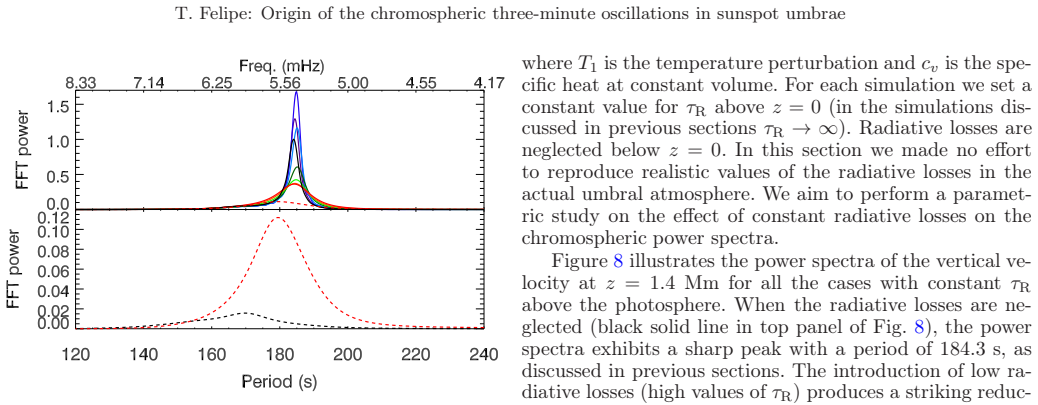
- Increasing the vertical magnetic field strength or shortening the radiative cooling time reduces resonance amplitudes by removing energy from the trapped waves.
Where Pith is reading between the lines
- Removing the transition region from the model would eliminate the resonator contribution and leave only the direct-propagation effect.
- Simultaneous multi-height observations could check whether photospheric three-minute power correlates with chromospheric resonance strength across different sunspots.
- Adding horizontal magnetic field components in future runs might reveal how the mechanisms operate away from the umbral axis.
Load-bearing premise
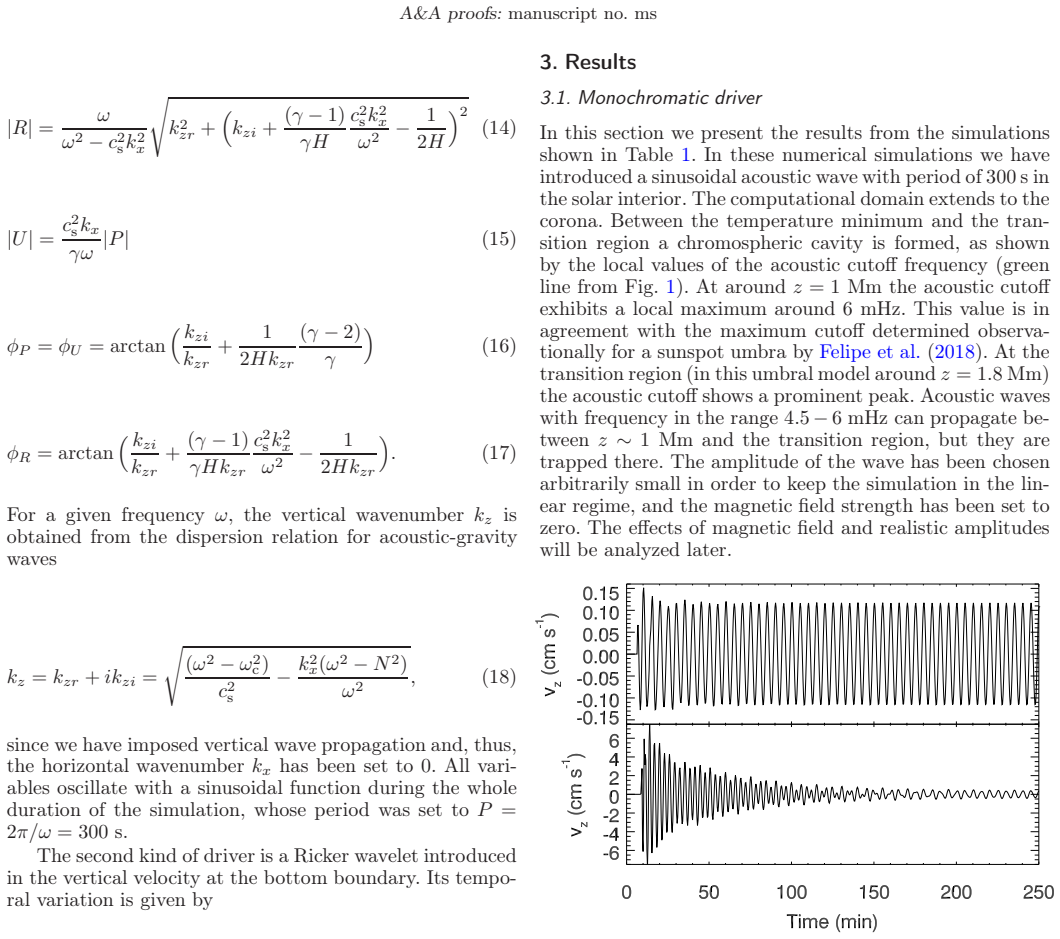
The numerical model assumes that a piston-driven lower boundary and chosen values of radiative cooling time, transition-region height, and vertical magnetic field strength produce a realistic representation of wave driving and damping in the real solar atmosphere.
What would settle it
Chromospheric spectra showing dominant three-minute power without detectable three-minute power at the photosphere would contradict the requirement that both mechanisms need photospheric three-minute waves.
Figures
read the original abstract
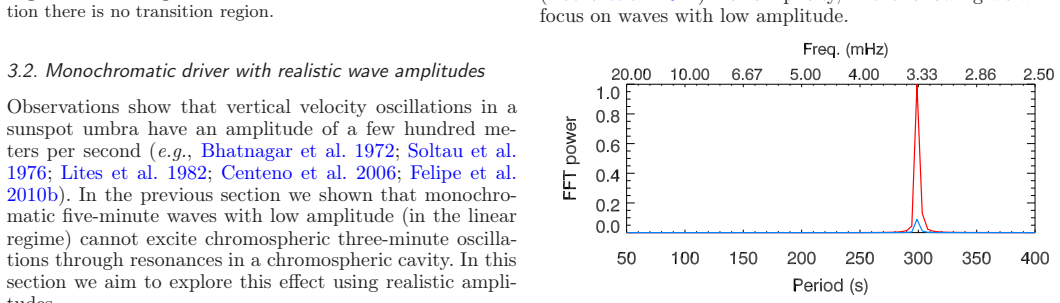
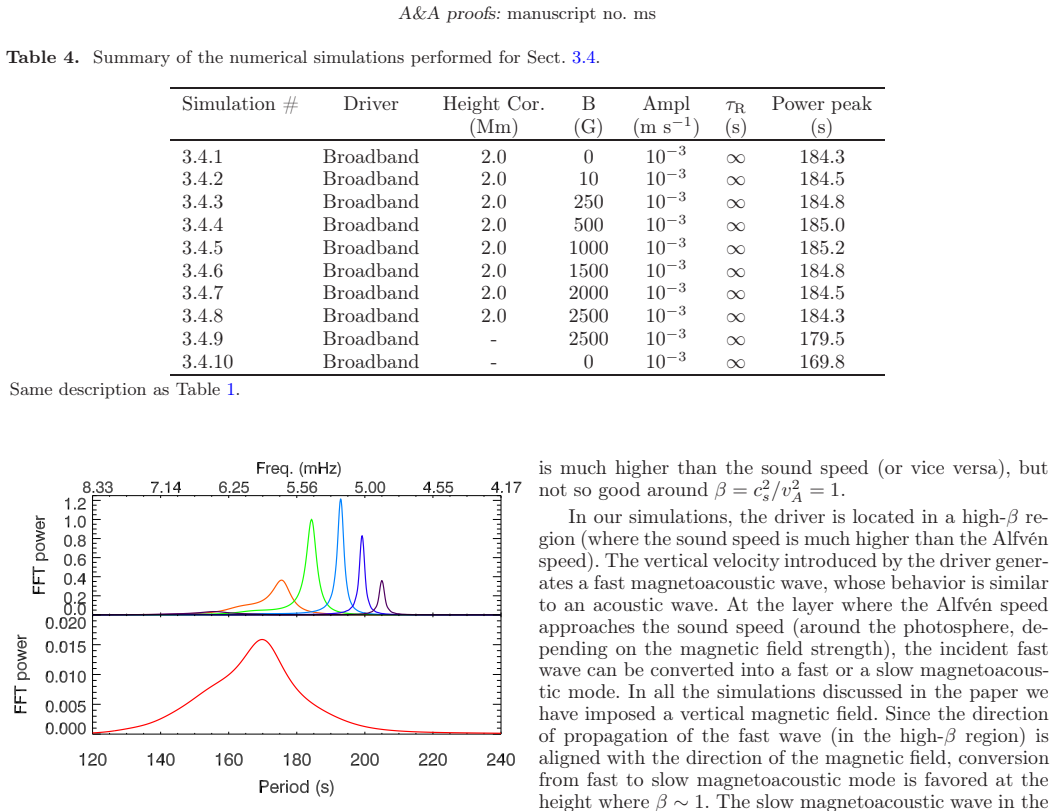
Sunspot umbrae show a change in the dominant period of their oscillations from five minutes in the photosphere to three minutes in the chromosphere. In this paper, we explore the two most popular models proposed to explain the three-minute oscillations: the chromospheric acoustic resonator and the propagation of waves with frequency above the cutoff value directly from lower layers. We employ numerical simulations of wave propagation from the solar interior to the corona. Waves are driven by a piston at the bottom boundary. We have performed a parametric study of the measured chromospheric power spectra in a large number of numerical simulations with differences in the driving method, the height of the transition region (or absence of transition region), the strength of the vertical magnetic field, and the value of the radiative cooling time. We find that both mechanisms require the presence of waves with period in the three-minute band at the photosphere. These waves propagate upward and their amplitude increases due to the drop of the density. Their amplification is stronger than that of evanescent low-frequency waves. This effect is enough to explain the dominant period observed in chromospheric spectral lines. However, waves are partially trapped between the photosphere and the transition region, forming an acoustic resonator. This chromospheric resonant cavity strongly enhances the power in the three-minute band. The chromospheric acoustic resonator model and the propagation of waves in the three-minute band directly from the photosphere can explain the observed chromospheric three-minute oscillations. They are both important in different scenarios. Resonances are produced by waves trapped between the temperature minimum and the transition region. Strong magnetic fields and radiative losses remove energy from the waves inside the cavity, resulting in weaker amplitude resonances.
Editorial analysis
A structured set of objections, weighed in public.
Referee Report
Summary. The paper presents 1-D MHD simulations of wave propagation in sunspot umbrae driven by a piston at the lower boundary. Through a parametric study varying the driving method, transition-region height, vertical magnetic-field strength, and radiative cooling time, it concludes that both direct upward propagation of waves in the three-minute band (amplified by the density drop) and partial trapping forming a chromospheric acoustic resonator (between the temperature minimum and transition region) can explain the observed shift from five-minute photospheric to three-minute chromospheric oscillations, with both mechanisms important in different scenarios and strong fields/radiative losses weakening resonances.
Significance. If the chosen parameter ranges produce realistic wave driving and damping, the work provides a clear numerical demonstration that density stratification preferentially amplifies three-minute waves while partial trapping produces resonance, thereby supporting both proposed models without requiring one to the exclusion of the other. The parametric exploration of four free parameters is a strength, as is the explicit statement that resonances arise from trapping between the temperature minimum and transition region.
major comments (2)
- [Abstract / parametric study description] Abstract and parametric-study description: the central claim that 'this effect is enough to explain the dominant period observed in chromospheric spectral lines' and that both mechanisms operate rests on the model reproducing realistic power ratios, yet no combination of the four varied parameters (driving method, TR height, B, cooling time) is shown to match published observed photospheric-to-chromospheric power spectra or absolute amplitudes in sunspot umbrae.
- [Parametric study description] Parametric study description: numerical convergence with respect to grid resolution, domain size, or time-stepping is not reported, leaving open whether the reported resonance peaks and amplification factors are robust within the 1-D MHD setup.
minor comments (2)
- [Abstract] Abstract: no quantitative error bars or uncertainty ranges are attached to the reported dominance of the three-minute band or resonance strengths.
- [Abstract] Abstract: the statement that 'strong magnetic fields and radiative losses remove energy from the waves inside the cavity' would benefit from a specific figure or table showing the dependence of resonance amplitude on B and cooling time.
Simulated Author's Rebuttal
We thank the referee for their constructive review and for recognizing the value of our parametric exploration. We address each major comment below.
read point-by-point responses
-
Referee: [Abstract / parametric study description] Abstract and parametric-study description: the central claim that 'this effect is enough to explain the dominant period observed in chromospheric spectral lines' and that both mechanisms operate rests on the model reproducing realistic power ratios, yet no combination of the four varied parameters (driving method, TR height, B, cooling time) is shown to match published observed photospheric-to-chromospheric power spectra or absolute amplitudes in sunspot umbrae.
Authors: Our study is a parametric exploration of physical mechanisms, not a quantitative fit to specific observations. We demonstrate that density stratification preferentially amplifies three-minute waves over five-minute waves whenever photospheric three-minute power is present, and that partial trapping can further enhance this band. This is sufficient to produce three-minute dominance in the chromosphere across the explored parameter space. Exact matching to published spectra would require additional constraints on the photospheric driver spectrum and precise atmospheric structure that lie outside the scope of the four parameters varied here. We will revise the abstract and discussion sections to clarify that the mechanisms provide viable explanations for the observed period shift rather than claiming reproduction of particular observational datasets. revision: partial
-
Referee: [Parametric study description] Parametric study description: numerical convergence with respect to grid resolution, domain size, or time-stepping is not reported, leaving open whether the reported resonance peaks and amplification factors are robust within the 1-D MHD setup.
Authors: We agree that convergence information should have been included. In the revised manuscript we will add a new subsection under Numerical Methods that specifies the grid spacing (10 km through the chromosphere), the time-stepping criterion based on the CFL condition, and results from additional runs performed at doubled spatial resolution. These tests confirm that resonance peak locations and amplification factors change by less than 5 percent, establishing robustness within the 1-D setup. revision: yes
Circularity Check
No significant circularity
full rationale
The paper conducts forward 1D MHD simulations driven by an independent piston boundary condition, with a parametric exploration of radiative cooling time, transition-region height, and magnetic-field strength. The reported dominance of three-minute power is an emergent output of density stratification and partial trapping within those simulations, directly compared to established observational periods rather than obtained by fitting any model parameter to the target three-minute band. No self-definitional reductions, fitted inputs renamed as predictions, or load-bearing self-citations appear in the derivation chain.
Axiom & Free-Parameter Ledger
free parameters (4)
- height of the transition region
- strength of the vertical magnetic field
- radiative cooling time
- driving method at bottom boundary
axioms (2)
- domain assumption Linear wave propagation in a gravitationally stratified, magnetized atmosphere with a temperature minimum and transition region
- domain assumption Radiative losses can be approximated by a constant cooling time
Reference graph
Works this paper leans on
-
[1]
Abdelatif, T. E., Lites, B. W., & Thomas, J. H. 1986, ApJ, 311, 1015 Alfvén, H. 1947, MNRAS, 107, 211 A vrett, E. H. 1981, in The Physics of Sunspots, ed. L. E. Cram & J. H. Thomas, 235–255
work page 1986
- [2]
-
[3]
Beckers, J. M. & Schultz, R. B. 1972, Sol. Phys., 27, 61
work page 1972
-
[4]
Beckers, J. M. & Tallant, P. E. 1969, Sol. Phys., 7, 351
work page 1969
- [5]
-
[6]
Berenger, J. P. 1994, Journal of Computational Physics, 114 , 185
work page 1994
-
[7]
Bhatnagar, A., Livingston, W. C., & Harvey, J. W. 1972, Sol. P hys., 27, 80
work page 1972
-
[8]
Botha, G. J. J., Arber, T. D., Nakariakov, V. M., & Zhugzhda, Y . D. 2011, ApJ, 728, 84
work page 2011
-
[9]
Campos, L. M. B. C. 1986, Reviews of Modern Physics, 58, 117
work page 1986
-
[10]
Centeno, R., Collados, M., & Trujillo Bueno, J. 2006, ApJ, 64 0, 1153
work page 2006
-
[11]
Chae, J., Lee, J., Cho, K., et al. 2017, ApJ, 836, 18 de la Cruz Rodríguez, J., Rouppe van der Voort, L., Socas-Nav arro, H., & van Noort, M. 2013, A&A, 556, A115 De Moortel, I. & Nakariakov, V. M. 2012, Philosophical Trans actions of the Royal Society of London Series A, 370, 3193
work page 2017
-
[12]
Felipe, T., Braun, D. C., Crouch, A. D., & Birch, A. C. 2016, Ap J, 829, 67
work page 2016
- [13]
- [14]
- [15]
- [16]
-
[17]
Giovanelli, R. G. 1978, Sol. Phys., 59, 293
work page 1978
-
[18]
Gurman, J. B. & Leibacher, J. W. 1984, ApJ, 283, 859
work page 1984
-
[19]
Hansteen, V. H. 1997, in ESA Special Publication, Vol. 404, F ifth SOHO W orkshop: The Corona and Solar Wind Near Minimum Ac- tivity, ed. A. Wilson, 45
work page 1997
-
[20]
Hu, F. Q. 1996, Journal of Computational Physics, 129, 201 Jefferies, S. M., McIntosh, S. W., Armstrong, J. D., et al. 200 6, ApJ, 648, L151
work page 1996
- [21]
-
[22]
Khomenko, E., Centeno, R., Collados, M., & Trujillo Bueno, J . 2008, ApJ, 676, L85
work page 2008
- [23]
-
[24]
Khomenko, E. & Collados, M. 2015, Living Reviews in Solar Phy sics, 12, 6 Kraśkiewicz, J., Murawski, K., & Musielak, Z. E. 2019, A&A, 6 23, A62 Krishna Prasad, S., Jess, D. B., & Khomenko, E. 2015, ApJ, 812 , L15
work page 2015
-
[25]
Lites, B. W. 1986, ApJ, 301, 1005
work page 1986
-
[26]
Lites, B. W. 1992, in NATO ASIC Proc. 375: Sunspots. Theory an d Observations, ed. J. H. Thomas & N. O. W eiss, 261–302
work page 1992
-
[27]
Lites, B. W. & Thomas, J. H. 1985, ApJ, 294, 682
work page 1985
- [28]
-
[29]
Maltby, P., A vrett, E. H., Carlsson, M., et al. 1986, ApJ, 306 , 284
work page 1986
-
[30]
Mihalas, D. & Mihalas, B. W. 1984, Foundations of Radiation H ydro- dynamics (Oxford: Oxford University Press)
work page 1984
-
[31]
Parchevsky, K. V., Zhao, J., & Kosovichev, A. G. 2008, ApJ, 67 8, 1498
work page 2008
- [32]
-
[33]
Reznikova, V. E., Shibasaki, K., Sych, R. A., & Nakariakov, V . M. 2012, ApJ, 746, 119
work page 2012
- [34]
-
[35]
2006, Philosophical Transactions of the Royal S ociety of London Series A, 364, 447
Roberts, B. 2006, Philosophical Transactions of the Royal S ociety of London Series A, 364, 447
work page 2006
-
[36]
C., Khomenko, E., & Collados, M
Santamaria, I. C., Khomenko, E., & Collados, M. 2015, A&A, 57 7, A70
work page 2015
- [37]
-
[38]
Schunker, H., Cameron, R. H., Gizon, L., & Moradi, H. 2011, Sol. Phys., 271, 1
work page 2011
-
[39]
Snow, B., Botha, G. J. J., & Régnier, S. 2015, A&A, 580, A107
work page 2015
- [40]
-
[41]
Spiegel, E. A. 1957, ApJ, 126, 202
work page 1957
-
[42]
Stangalini, M., Giannattasio, F., Del Moro, D., & Berrilli, F. 2012, A&A, 539, L4
work page 2012
-
[43]
Stark, B. A. & Musielak, Z. E. 1993, ApJ, 409, 450
work page 1993
-
[44]
Thomas, J. H. 1982, ApJ, 262, 760
work page 1982
-
[45]
Thomas, J. H. 1983, Annual Review of Fluid Mechanics, 15, 321
work page 1983
-
[46]
Torrence, C. & Compo, G. P. 1998, Bulletin of the American Met eo- rological Society, 79, 61
work page 1998
- [47]
-
[48]
Ulmschneider, P., Rammacher, W., Musielak, Z. E., & Kalkofe n, W. 2005, ApJ, 631, L155 Vögler, A., Shelyag, S., Schüssler, M., et al. 2005, 429, 335 Wójcik, D., Murawski, K., & Musielak, Z. E. 2018, MNRAS, 481, 262
work page 2005
-
[49]
Zhao, J., Felipe, T., Chen, R., & Khomenko, E. 2016, ApJ, 830, L17
work page 2016
-
[50]
Zhugzhda, I. D., Locans, V., & Staude, J. 1983, Sol. Phys., 82 , 369
work page 1983
-
[51]
Zhugzhda, Y. D. 2008, Sol. Phys., 251, 501
work page 2008
-
[52]
Zhugzhda, Y. D. & Locans, V. 1981, Soviet Astronomy Letters, 7, 25 Article number, page 13 of 13
work page 1981
discussion (0)
Sign in with ORCID, Apple, or X to comment. Anyone can read and Pith papers without signing in.