Quantifying Realizable Flexibility Limits in Fast and Ultra-Fast EV Charging Using Real-World Data
Pith reviewed 2026-06-30 05:33 UTC · model grok-4.3
The pith
EV flexibility in fast and ultra-fast charging is bounded by battery management system limits and connection times rather than being a freely controllable resource.
A machine-rendered reading of the paper's core claim, the machinery that carries it, and where it could break.
Core claim
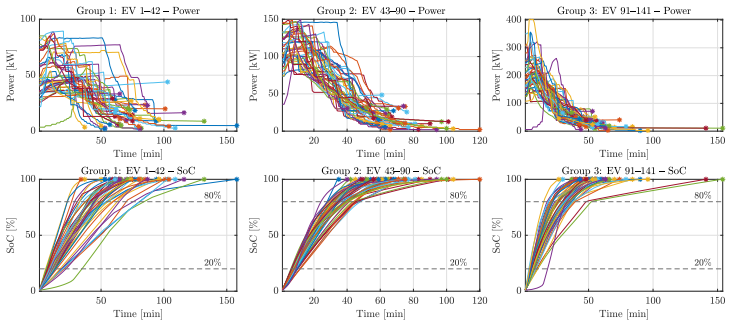
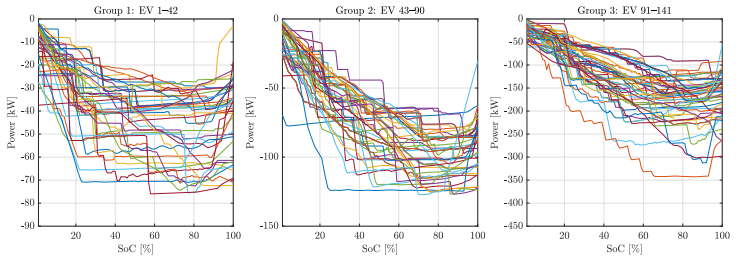
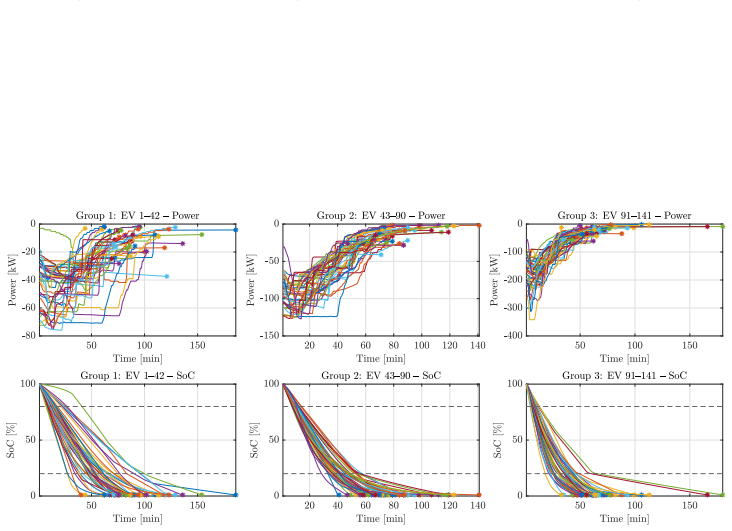
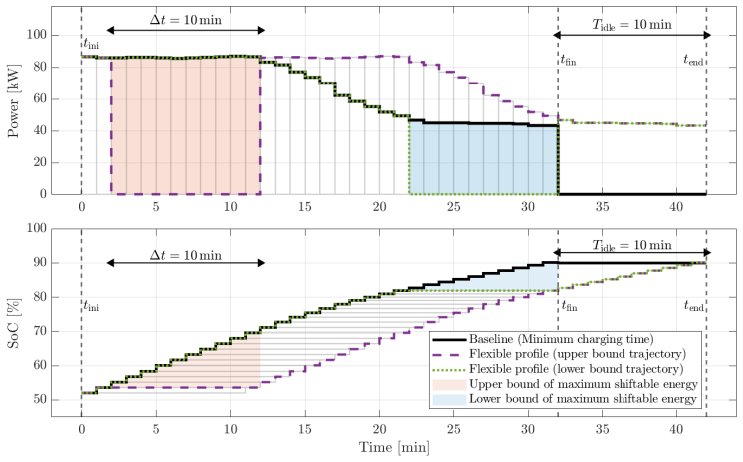
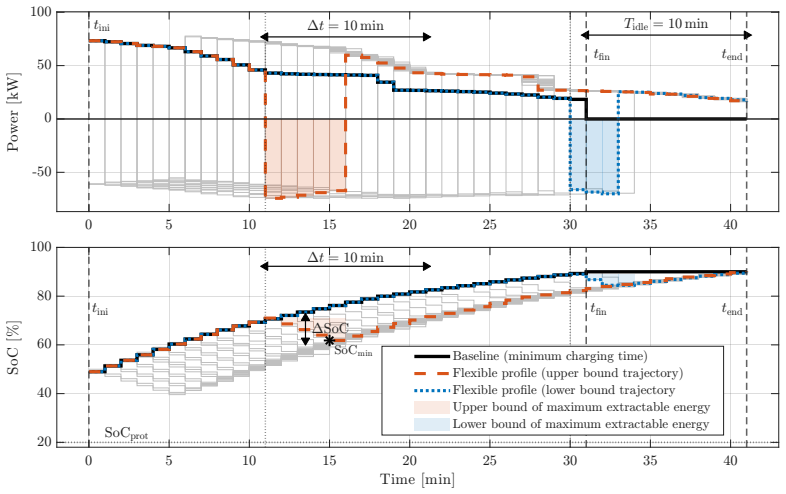
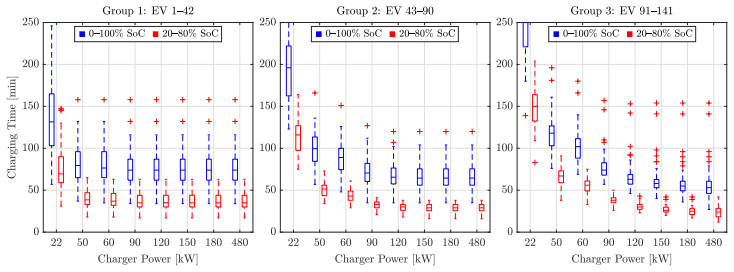
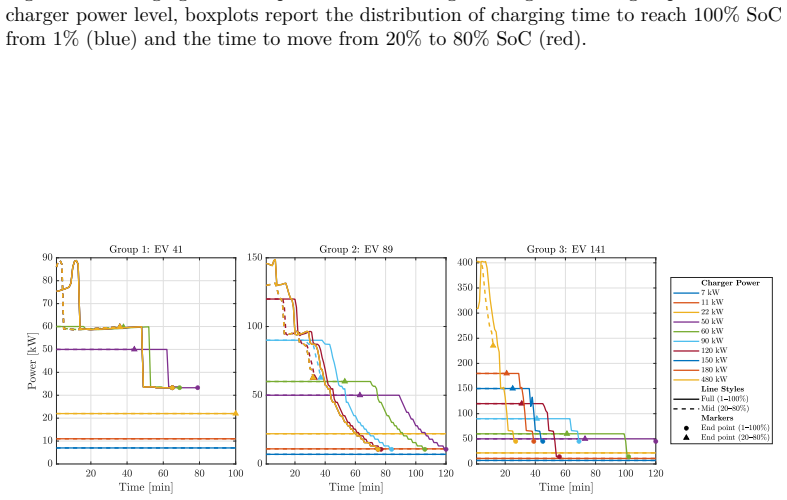
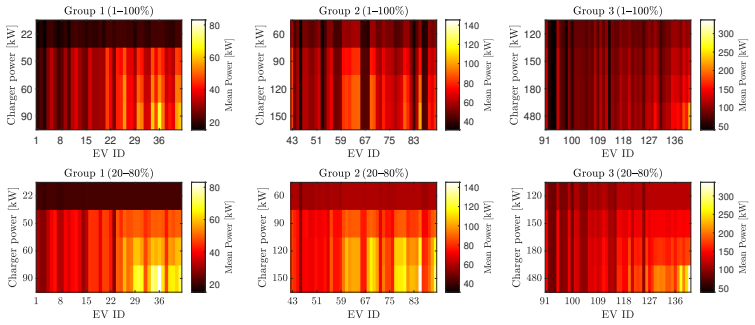
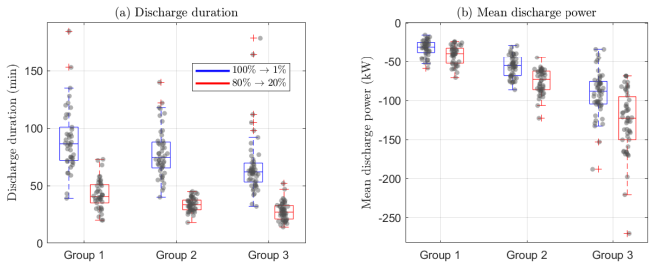
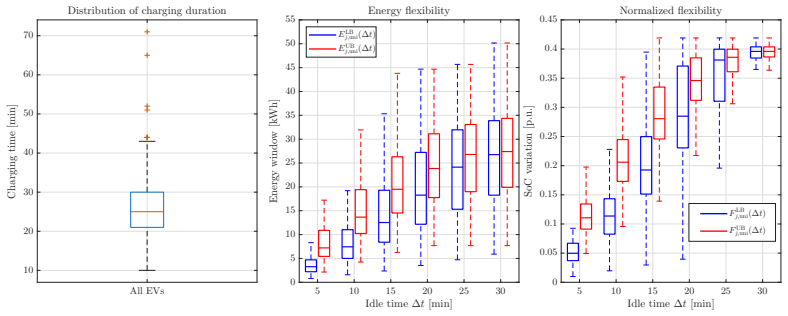
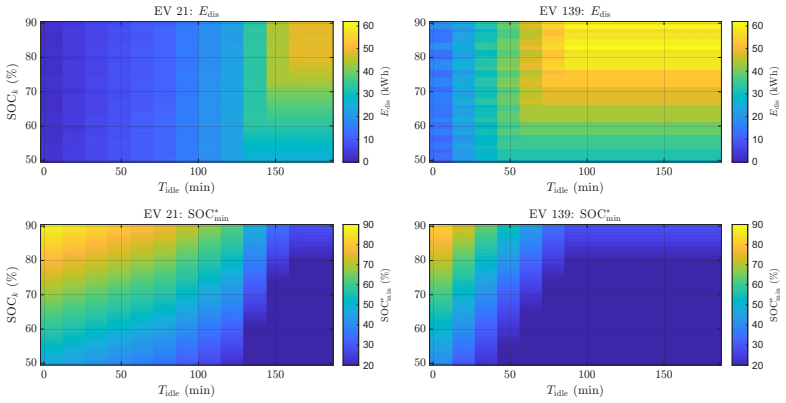
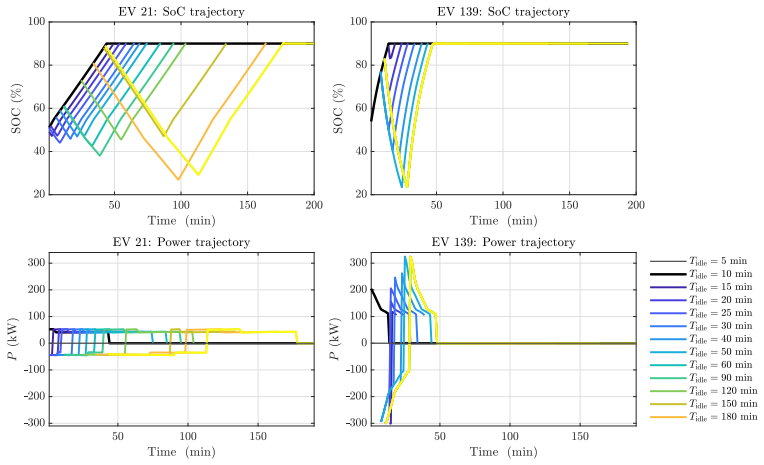
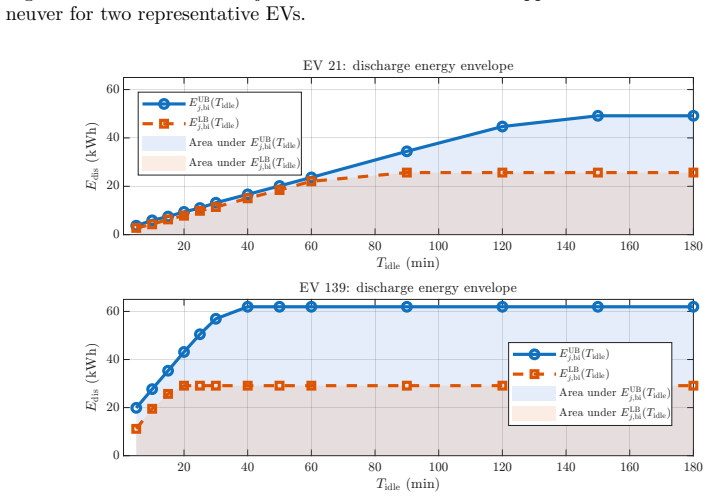
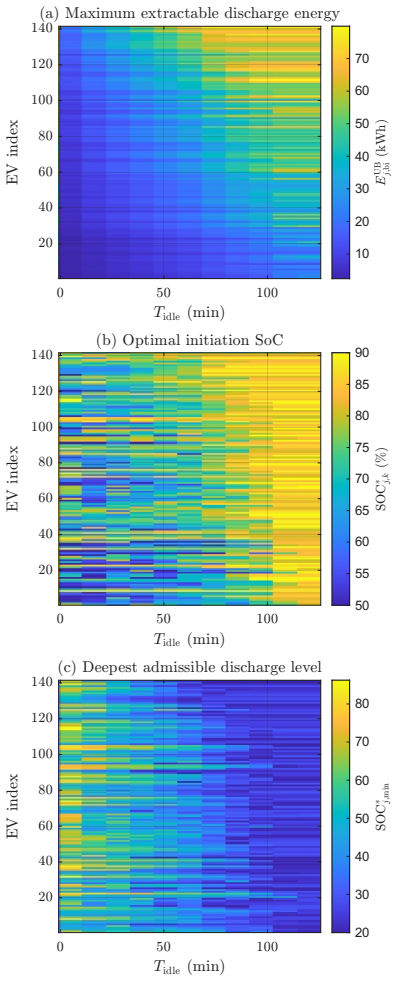
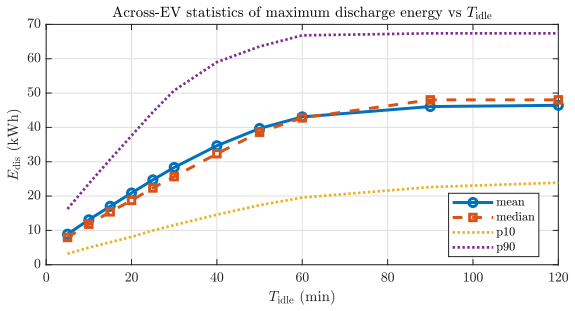
Based on 252 real charging sessions, 141 representative Power-SoC profiles are reconstructed to capture real-world charging dynamics. Unidirectional flexibility is defined through bounds on the maximum shiftable charging energy, while bidirectional flexibility is quantified as the bounds of the maximum extractable discharge energy under feasibility constraints. Results show that flexibility depends on charging state and connection time, with charging beyond 80 percent SoC increasing duration with limited gains, higher charger power saturating due to BMS limits, and the maximum extractable bidirectional energy able to exceed twice its value depending on activation point.
What carries the argument
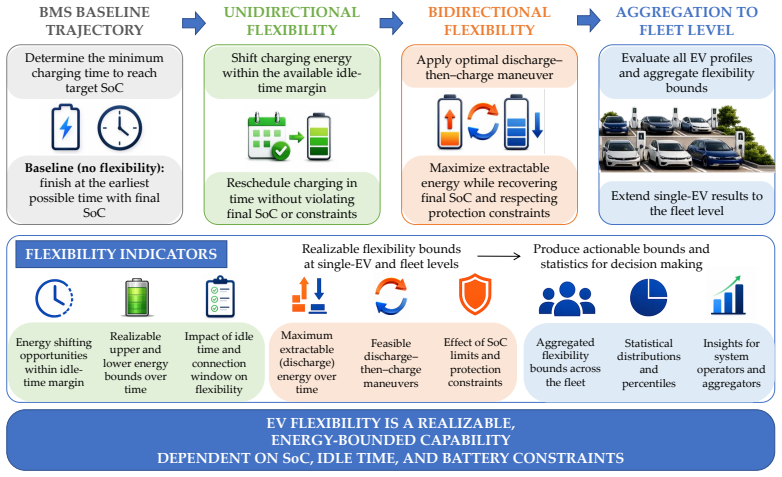
Trajectory-aware data-driven framework that reconstructs Power-SoC profiles from real sessions to set bounds on shiftable charging energy and extractable discharge energy.
If this is right
- Flexibility depends on charging state and connection time.
- Charging beyond 80 percent SoC increases duration with limited gains.
- Higher charger power saturates due to BMS limits.
- Charging time in the 20-80 percent range drops by over 60 percent and mean power increases by up to 40 percent.
- The maximum extractable bidirectional energy can exceed twice its value depending on the activation point.
Where Pith is reading between the lines
- Aggregators could use the reported bounds to set conservative bids in flexibility markets rather than assuming full controllability.
- The framework could be extended to test how multiple EVs interact when their individual bounds are aggregated for system services.
- Real-time grid simulations could apply these limits to measure the gap between optimistic and realizable flexibility procurement.
Load-bearing premise
The 252 real charging sessions and 141 reconstructed Power-SoC profiles are representative of real-world BMS behavior, connection time availability, and battery-protection limits across fast and ultra-fast DC chargers.
What would settle it
A new dataset of charging sessions whose reconstructed profiles show flexibility bounds independent of state of charge or connection time, or that permit substantially more bidirectional energy extraction than the reported limits.
Figures
read the original abstract
The rapid growth of electric vehicles (EVs) is increasing the need to accurately quantify their flexibility as a resource for power system operation. However, most existing approaches rely on simplified or power-controllable models that overlook the intrinsic constraints of fast and ultra-fast DC charging. In practice, flexibility is fundamentally shaped by battery management system (BMS) behavior, connection time availability, and battery-protection limits. This paper introduces a trajectory-aware data-driven framework to quantify EV charging flexibility as an energy-bounded and time-constrained process. Based on 252 real charging sessions, 141 representative Power-SoC profiles are reconstructed to capture real-world charging dynamics. Unidirectional flexibility is defined through bounds on the maximum shiftable charging energy, while bidirectional flexibility is quantified as the bounds of the maximum extractable discharge energy under feasibility constraints. Results show that flexibility depends on charging state and connection time. Charging beyond 80% SoC increases duration with limited gains, while higher charger power saturates due to BMS limits. Charging time in the 20%-80% range drops by over 60%, and mean power increases by up to 40%. The maximum extractable bidirectional energy can exceed twice its value depending on the point at which flexibility is activated. These results highlight that EV flexibility is not a controllable resource, but a bounded and time-dependent capability. As such, the proposed framework provides actionable limits that can be directly used by system operators and aggregators for scheduling, peak shaving, and short-duration flexibility services.
Editorial analysis
A structured set of objections, weighed in public.
Referee Report
Summary. The paper introduces a trajectory-aware data-driven framework for quantifying EV charging flexibility in fast and ultra-fast DC charging. Using 252 real charging sessions, it reconstructs 141 Power-SoC profiles to define unidirectional flexibility via bounds on maximum shiftable charging energy and bidirectional flexibility via bounds on maximum extractable discharge energy. The central claim is that flexibility is a bounded, time-dependent capability shaped by BMS behavior, connection time, and protection limits rather than a controllable resource, yielding actionable limits for system operators in scheduling, peak shaving, and short-duration services.
Significance. If the data processing and representativeness hold, the work provides a concrete alternative to simplified power-controllable EV models by grounding flexibility bounds in observed trajectories. The emphasis on real-world constraints from BMS and charger saturation is a useful contribution for power-system applications. However, the absence of disclosed reconstruction methods, validation, and statistical measures on the derived bounds limits the immediate transferability of the results.
major comments (3)
- [Abstract] Abstract: the reconstruction of 141 Power-SoC profiles from 252 sessions is presented without any description of the method, exclusion criteria, error metrics, or validation against independent data. Because the central claim that flexibility is bounded rather than controllable rests directly on these profiles being representative of BMS behavior and protection limits, the lack of these details is load-bearing.
- [Abstract] Abstract (results paragraph): the reported quantitative findings (e.g., charging time in 20%-80% SoC drops by over 60%, mean power increases by up to 40%, extractable bidirectional energy can exceed twice its value) are given without error bars, confidence intervals, or cross-validation against a held-out set of sessions. This undermines the generalizability asserted for system-operator use.
- [Framework definition (implied in abstract)] The framework is defined directly from the measured sessions with no equations shown that reduce the reported bounds to independent parameters or external validation; the mapping from observed trajectories to actionable limits therefore remains internal to the sample.
minor comments (1)
- [Abstract] The abstract states results from 252 sessions and 141 profiles but supplies no table or figure reference for the underlying distributions or charger-type breakdown.
Simulated Author's Rebuttal
We thank the referee for the constructive feedback highlighting the need for greater transparency in the abstract. We address each major comment below and indicate where revisions will be made to strengthen the manuscript.
read point-by-point responses
-
Referee: [Abstract] Abstract: the reconstruction of 141 Power-SoC profiles from 252 sessions is presented without any description of the method, exclusion criteria, error metrics, or validation against independent data. Because the central claim that flexibility is bounded rather than controllable rests directly on these profiles being representative of BMS behavior and protection limits, the lack of these details is load-bearing.
Authors: The abstract is a concise summary; the full manuscript (Section II) details the session filtering process, exclusion criteria for incomplete or anomalous trajectories, and internal consistency validation against raw charger data. To address the concern directly in the abstract, we will add a brief clause describing the reconstruction approach and directing readers to the methods for full details on representativeness. revision: yes
-
Referee: [Abstract] Abstract (results paragraph): the reported quantitative findings (e.g., charging time in 20%-80% SoC drops by over 60%, mean power increases by up to 40%, extractable bidirectional energy can exceed twice its value) are given without error bars, confidence intervals, or cross-validation against a held-out set of sessions. This undermines the generalizability asserted for system-operator use.
Authors: These metrics are means computed across the 141 profiles. We agree that variability measures would improve reporting. In revision we will append standard deviations or interquartile ranges to the key percentages in the abstract and main results; a formal held-out cross-validation was not performed given the modest sample, but internal robustness checks across subsets were used. revision: partial
-
Referee: [Framework definition (implied in abstract)] The framework is defined directly from the measured sessions with no equations shown that reduce the reported bounds to independent parameters or external validation; the mapping from observed trajectories to actionable limits therefore remains internal to the sample.
Authors: The framework is intentionally empirical to reflect observed BMS and protection constraints that resist simple parametric reduction. Equations (3)–(6) in Section III explicitly define the state- and time-dependent bounds on shiftable and extractable energy directly from the trajectories. We will insert a short reference to these definitions in the revised abstract. External validation on independent datasets lies outside the present study scope. revision: partial
Circularity Check
No circularity: empirical bounds derived directly from measured sessions without self-referential reduction
full rationale
The paper presents a data-driven framework that reconstructs Power-SoC profiles from 252 real charging sessions and defines unidirectional and bidirectional flexibility bounds directly from those observed trajectories. No equations, fitted parameters, or self-citations are shown that reduce the reported limits to inputs by construction; the central claims remain statistical summaries of the collected data rather than predictions forced by prior definitions or author-specific theorems. The derivation chain is therefore self-contained as an empirical characterization exercise.
Axiom & Free-Parameter Ledger
axioms (1)
- domain assumption The 252 charging sessions and 141 reconstructed profiles capture the intrinsic constraints of BMS behavior, connection time availability, and battery-protection limits.
Reference graph
Works this paper leans on
-
[1]
rep., International Energy Agency (IEA), accessed: 2026-05-25 (2026)
International Energy Agency, Global ev outlook 2026: Electric vehi- cle charging, Tech. rep., International Energy Agency (IEA), accessed: 2026-05-25 (2026)
2026
-
[2]
A. Akbari, V. Vahidinasab, H. Arasteh, E. Kazemi-Robati, Ru- ral/residential microgrids: Concepts, status quo, model and application, in: Residential Microgrids and Rural Electrifications, 1st Edition, Else- vier, 2021, Ch. 7, pp. 131–161. doi:10.1016/B978-0-323-90177-2.00007-4. 47
-
[3]
Y. Wang, X. Fan, W. Jiang, X. Bi, H. Ameer, X. Chen, Perspectives on electric vehicle charging guidance based on virtual power plant, eTransportation 28 (2026) 100580. doi:https://doi.org/10.1016/j.etran.2026.100580
-
[4]
S. Englberger, K. Abo Gamra, B. Tepe, M. Schreiber, A. Jossen, H. Hesse, Electric vehicle multi-use: Optimiz- ing multiple value streams using mobile storage systems in a vehicle-to-grid context, Applied Energy 304 (2021) 117862. doi:https://doi.org/10.1016/j.apenergy.2021.117862
-
[5]
R. Chemudupaty, T. Hornek, I. Pavi, S. Potenciano Menci, Optimizing trading of electric vehicle charging flexibility in the continuous intraday market under user and market uncertainties, Applied Energy 381 (2025) 125103. doi:https://doi.org/10.1016/j.apenergy.2024.125103
-
[6]
P. Franzese, D. Iannuzzi, S. Meo, Ultrafast charging technologies for electric vehicles: Classification, architectures, installations, and de- sign challenges, IEEE Electrification Magazine 13 (4) (2025) 30–47. doi:10.1109/MELE.2025.3624757
-
[7]
M. P. Herrera, G. Hug, Modeling charging demand and quantifying flex- ibility bounds for large-scale bev fleets, in: 2025 IEEE Kiel PowerTech, 2025, pp. 1–6. doi:10.1109/PowerTech59965.2025.11180551
-
[8]
S. Tang, Y. Mu, H. Jia, X. Jin, X. Yu, Flexibility potential of elec- tric vehicle charging: A trip chain analysis under bi-criterion stochas- tic dynamic user equilibrium, Advances in Applied Energy 19 (2025). doi:10.1016/j.adapen.2025.100240
-
[9]
E. Nukic, V. Levi, D. Cetenovic, N. Vojnovic, Probabilistic flex- ibility assessment of shared charging stations for electric vehi- cles, Sustainable Energy, Grids and Networks 44 (2025) 102014. doi:https://doi.org/10.1016/j.segan.2025.102014
-
[10]
K. Wu, C. Xiang, Integrated deep learning framework for electric ve- hicles’ flexibility forecasting and optimal dispatch, Applied Energy 414 (2026) 127821. doi:https://doi.org/10.1016/j.apenergy.2026.127821
-
[11]
Q. Yu, J. Li, D. Feng, X. Liu, J. Yuan, H. Zhang, X. Wang, Modeling electric vehicle behavior: Insights from long-term 48 charging and energy consumption patterns through empir- ical trajectory data, Applied Energy 380 (2025) 125066. doi:https://doi.org/10.1016/j.apenergy.2024.125066
-
[13]
Y. Li, K. Wang, X. Feng, D. Guo, X. Gao, D. Mou, Y. Wu, S. Yang, Battery-electric vehicle-charging station-power grid synergies: A tech- nical roadmap from vehicle to grid, eTransportation 28 (2026) 100569. doi:https://doi.org/10.1016/j.etran.2026.100569
-
[14]
X. Zhang, Q. Zhao, L. Guo, S. Wang, Flexibility region quantification and optimal scheduling of fast charging stations considering ev user dis- charge willingness, Ieee Transactions on Transportation Electrification 11 (6) (2025) 12692–12706. doi:10.1109/tte.2025.3594615
-
[15]
Q. Chen, X. Liu, T. Zhang, Quantifying the flexibility potential of electric vehicles in buildings and determining the investment strat- egy for charging infrastructure, eTransportation 24 (2025) 100403. doi:https://doi.org/10.1016/j.etran.2025.100403
-
[16]
G. Chen, N. R. Shishvan, Z. Guo, J. Qin, Quantifying spatiotemporal charging flexibility of electric vehicles as virtual grid assets to acceler- ate sustainable energy transition, Cell Reports Physical Science 6 (11) (2025) 102905. doi:https://doi.org/10.1016/j.xcrp.2025.102905
-
[17]
S. Lai, Z. Y. Dong, H. Yang, Y. Tao, C. Yip, J. Qiu, J. Zhao, Renewable energy following strategy via quantified aggregated heterogeneous elec- tric vehicle flexibility, IEEE Transactions on Smart Grid 16 (5) (2025) 3873–3886. doi:10.1109/TSG.2025.3580386
-
[18]
F. Al Taha, T. L. Vincent, E. Bitar, An efficient method for quan- tifying the aggregate flexibility of plug-in electric vehicle popula- tions, IEEE Transactions on Smart Grid 16 (4) (2025) 3142–3154. doi:10.1109/TSG.2024.3384871. 49
-
[19]
C. Diaz-Londono, P. Maffezzoni, L. Daniel, G. Gruosso, Flexibility of electric vehicle chargers in residential, workplace, and public lo- cations based on real-world data, in: IEEE EUROCON 2023 - 20th International Conference on Smart Technologies, 2023, pp. 354–359. doi:10.1109/EUROCON56442.2023.10199090
-
[20]
C. B. Saner, J. Saha, D. Srinivasan, A charge curve and battery man- agement system aware optimal charging scheduling framework for elec- tric vehicle fast charging stations with heterogeneous customer mix, IEEE Transactions on Intelligent Transportation Systems 24 (12) (2023) 14890–14902. doi:10.1109/TITS.2023.3303621
-
[21]
C. Berk Saner, J. Saha, D. Srinivasan, A social welfare theory-inspired lexicographic optimal charging scheduling framework for modular ev fast charging stations, IEEE Transactions on Intelligent Transportation Systems 25 (11) (2024) 18648–18660. doi:10.1109/TITS.2024.3451498
-
[22]
X. Li, Z. Wang, L. Zhang, Z. Huang, F. Guo, A. Sivakumar, D. U. Sauer, Electric vehicle charging flexibility assessment for load shifting based on real-world charging pattern identification, eTransportation 23 (2025) 100367. doi:https://doi.org/10.1016/j.etran.2024.100367
-
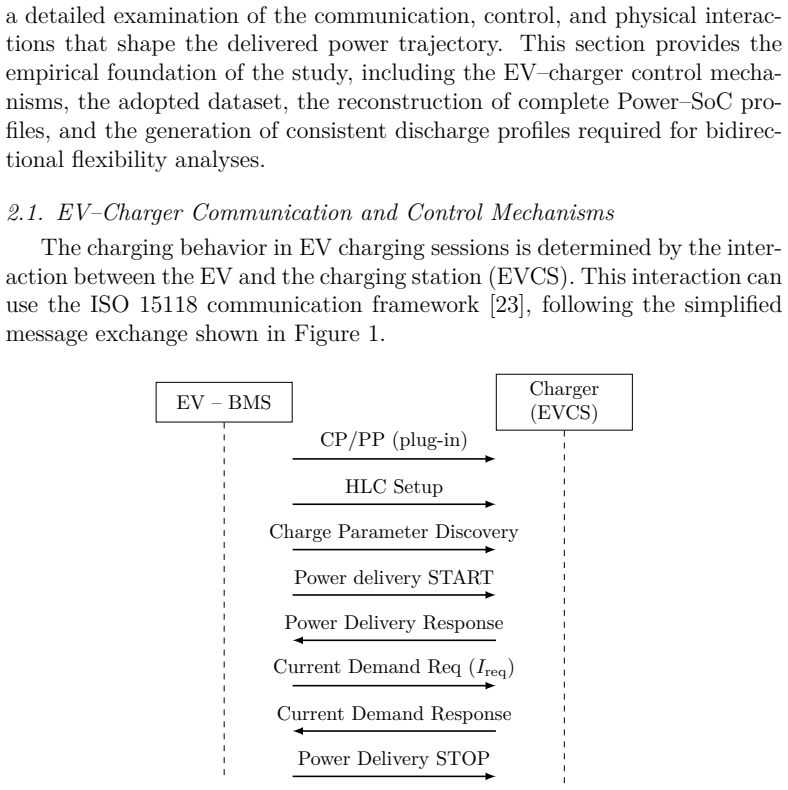
[23]
M. Shin, H. Kim, H. Kim, H. Jang, Building an interoperability test system for electric vehicle chargers based on iso/iec 15118 and iec 61850 standards, Applied Sciences 6 (6) (2016). doi:10.3390/app6060165
-
[24]
URL https://www.fastnedcharging.com/en/brands-overview
Fastned, Check your charge speed and compatibility brands overview, accessed: August, 2025 (2025). URL https://www.fastnedcharging.com/en/brands-overview
2025
-
[25]
C. Diaz-Londono, G. Fambri, P. Maffezzoni, G. Gruosso, Enhanced ev charging algorithm considering data-driven workplace chargers catego- rization with multiple vehicle types, eTransportation 20 (2024) 100326. doi:https://doi.org/10.1016/j.etran.2024.100326
-
[26]
G. L. Plett, Extended kalman filtering for battery management systems of lipb-based hev battery packs: Part 2. modeling and identification, Journal of Power Sources 134 (2) (2004) 262–276. doi:10.1016/j.jpowsour.2004.02.032. 50
-
[27]
M. Wentao, R. Shizhuo, G. Peng, Review of state of power estimation for li-ion batteries: Methods, issues, and prospects, J. Electrochem. Sci. Technol 16 (1) (2025) 15–36. doi:10.33961/jecst.2024.00724
-
[28]
M. Dubarry, C. Truchot, B. Y. Liaw, Synthesize bat- tery degradation modes via a diagnostic and prognos- tic model, Journal of Power Sources 219 (2012) 204–216. doi:https://doi.org/10.1016/j.jpowsour.2012.07.016
-
[29]
C. Diaz-Londono, G. D. Agundis-Tinajero, P. Maffezzoni, G. Gruosso, J. M. Guerrero, Evaluating the electrical network impact of ev charging strategies used by operators across residential, workplace, and public users, IEEE Open Journal of Vehicular Technology 6 (2025) 1721–1735. doi:10.1109/OJVT.2025.3581803
-
[30]
M. E. F. Octaviano, L. R. de Araujo, D. R. R. Penido, Allocation of bess and state of charge management in unbalanced distribution networks considering the state of health, Electric Power Systems Research 242 (2025) 111467. doi:https://doi.org/10.1016/j.epsr.2025.111467. 51
discussion (0)
Sign in with ORCID, Apple, or X to comment. Anyone can read and Pith papers without signing in.