REVIEW 3 major objections 3 minor 35 references
Spectral Microlensing of Extragalactic H II Regions by Stellar-Mass Black Holes
T0 review · 3 major / 3 minor · reviewed 2026-08-05 · deepseek-v4-flash
Pith's one-line read The paper claims that a Milky Way black hole aligned with a compact extragalactic H II region would brighten emission lines while preserving their intrinsic ratios, at a predicted rate near one event per million years.
desk verdict Novel idea, correct lensing, tiny rate: the paper's own numbers make it a concept note rather than a detection roadmap, but it is honest and worth a serious referee. read the letter →
The pith
A machine-rendered reading of the paper's core claim, the machinery that carries it, and where it could break.
The reading
What carries the argument
The central object is the point-mass Einstein radius of a foreground black hole projected to the source plane, compared with the physical size of an H II region, a cloud of ionized hydrogen emitting bright recombination and forbidden lines. The main identity is the fractional line excess m_i = (mu - 1) epsilon_i and its achromatic ratio m_i / m_j = epsilon_i / epsilon_j, which turns lensing into a multi-line spectroscopic diagnostic. The event-rate machinery combines a uniform-disk magnification formula, with peak magnification mu_peak = sqrt(4(theta_E / theta_S)^2 + 1), an optical-depth integral over Galactic disk and halo black-hole densities, and an impact-parameter correction N_eff = b N
What would settle it
Measure, with high-resolution H-alpha and near-infrared imaging, the joint distribution of physical size and fractional line luminosity of H II regions in face-on star-forming galaxies at z ~ 0.01-0.5. If sub-10-pc regions typically contribute less than ~0.1% of a galaxy's total line emission, then at magnification mu = 10 the line excess m_i = (mu - 1) epsilon_i is below 1%, under the 7-sigma threshold even at SNR = 110, and the proposed observable would be undetectable for typical targets.
Extended reading notes
Core claim
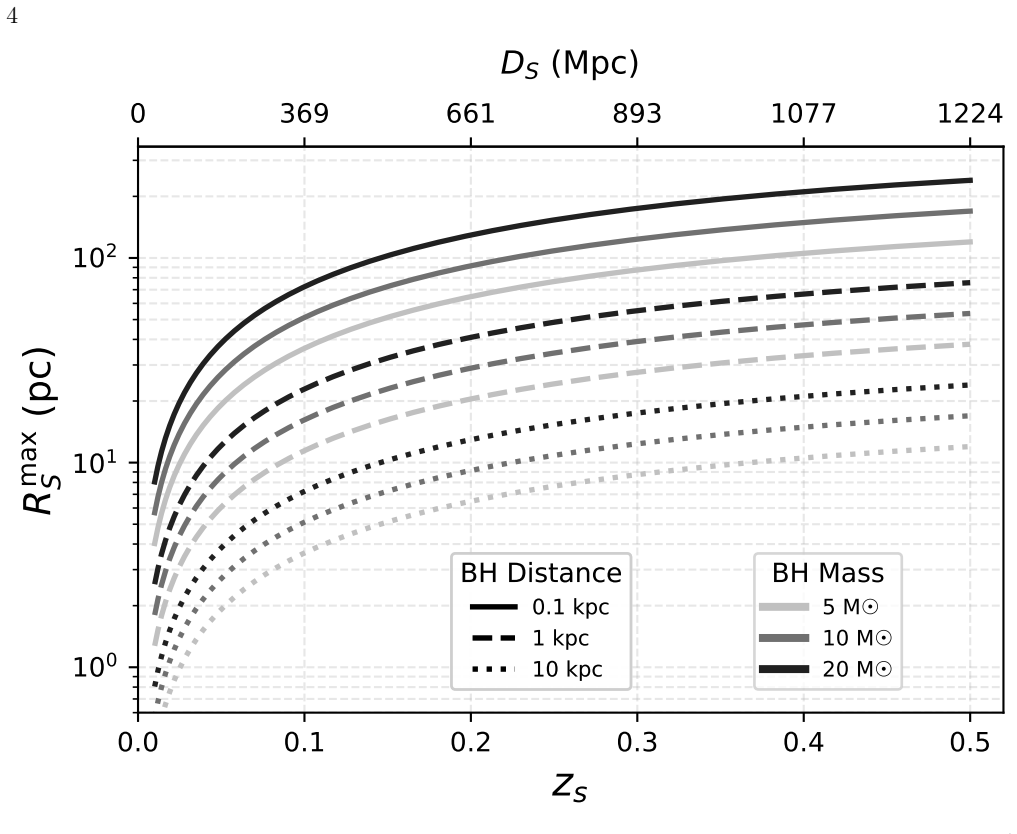
The central claim is that a foreground stellar-mass black hole whose Einstein radius, projected to the source plane, is comparable to the physical size of a background H II region produces a measurable spectral microlensing signal. For an H II region that contributes a fraction epsilon_i of the galaxy's total emission in line i, the fractional line excess is m_i = (mu - 1) epsilon_i. Because gravitational lensing is achromatic, the same factor (mu - 1) multiplies every line, so m_i / m_j = epsilon_i / epsilon_j: the observed excess ratios reproduce the region's intrinsic line ratios independent of the magnification. The author shows that for typical black holes at 0.1-10 kpc the Einstein rad
Load-bearing premise
A lensed H II region must contribute about one percent of the galaxy's total light in the observed emission lines while staying spatially smaller than about ten parsecs; if dust, blending, or a different size distribution makes its effective line fraction much smaller, the predicted 9% excess at tenfold magnification falls below the stated detection significance.
Editorial extensions
If this is right
- Spectral microlensing would open a window onto isolated stellar-mass black holes in the Galactic halo and at high latitudes, regions where dense-field stellar microlensing cannot operate.
- Candidate events can be identified by comparing lensed and unlensed epochs: coherent fractional excesses in multiple emission lines with an unchanged continuum, and with excess ratios matching known line ratios, would distinguish lensing from false positives.
- Because the strongest magnifications come from compact, dust-obscured H II regions, the practical follow-up path lies in infrared and radio recombination lines rather than optical spectroscopy.
- Even with no detected event, a wide-field search would place independent upper limits on the density of isolated black holes in low-density Galactic environments, constraining formation and natal-kick models.
- Existing multi-epoch spectroscopic surveys separated by roughly a decade could be mined for discrete line-flux excesses even though they are too sparse to track continuous microlensing light curves.
Reading between the lines
- Editorial: The achromatic ratio identity should work for any compact line-emitting source, not just H II regions—for example, extragalactic masers, planetary nebulae, or broad-line regions with angular sizes below the Einstein radius could be used, extending the method's reach.
- Editorial: The single most testable assumption is the effective fractional contribution epsilon_i of sub-10-pc regions to a galaxy's line flux; the paper invokes values around 1% from nearby catalogs, but dust attenuation and blending in more distant galaxies could lower this by orders of magnitude. A measurement of the epsilon distribution for galaxies at z ~ 0.01-0.5 would directly set the real
- Editorial: One could search archival narrow-band imaging for line-only transients—objects bright in H-alpha but absent from broad-band difference images—as a cheaper way to set upper limits before dedicated time-domain spectroscopy exists.
Editorial analysis
A structured set of objections, weighed in public.
Referee Report
Summary. The paper proposes detecting isolated Galactic stellar-mass black holes by searching for wavelength-independent, narrow emission-line excesses in the integrated spectra of background star-forming galaxies. A foreground BH with a milliarcsecond Einstein radius can magnify a compact extragalactic H II region with physical size ≲10 pc; the fractional line excess is m_i = (mu−1) epsilon_i, and the ratio of excesses between two lines equals the intrinsic line ratio, providing an achromaticity-based diagnostic (Eqs. 5–6). The authors derive the optical depth for disk and halo BH populations, estimate the event rate with a global optical depth and a typical Einstein crossing time, and then apply an impact-parameter correction to obtain N_eff,det ~ 10^-6 yr^-1 for N_gal = 10^3 and N_HII = 10^2. They also discuss archival multi-epoch spectroscopy and future infrared/radio surveys as possible search strategies.
Significance. If the central detectability assumption holds, the method would open a genuinely new probe of isolated stellar-mass BHs at high Galactic latitudes and in the halo, a regime where traditional stellar microlensing is inefficient. The lensing and optical-depth derivations (Eqs. 1–3, A1–A3) are standard and correctly executed under the stated approximations, and the finite-source magnification and impact-parameter correction are handled transparently. The paper uses public synthetic BH catalogs and PHANGS-HST/MUSE data, and it is explicit about the extremely low event rate and the dust-obscuration challenge. The main weakness is that the detection significance and the event-rate estimate rest on an unverified value of epsilon_i for the compact, size-selected H II regions that dominate high-magnification events; the manuscript does not report or bound this quantity for the relevant compact sample.
major comments (3)
- [§2.2, Eq. (5); Appendix C] The 7σ detection threshold is derived from (mu−1)epsilon_i ≈ sqrt(2) S_i/SNR_i with epsilon_i ≈ 1% and mu ≈ 10, giving SNR_i ≳ 110. This assumes the lensed compact H II region contributes 1% of the galaxy's integrated line flux. The 0.1–10% range quoted in Sec. 1 applies to the full H II region luminosity function and is dominated by extended giant regions; the compact, dust-obscured cores that satisfy Eq. (3) at high magnification are likely to have far smaller epsilon_i. Appendix C uses the PHANGS–MUSE/HST catalog to estimate N_HII but does not report epsilon_i for the size-limited (<10 pc) sample. If the typical epsilon_i of lensable compact regions is 0.1% or lower, the required SNR becomes ~1100 or higher, invalidating the stated detectability. Please quantify epsilon_i for the size-selected compact sample, or explicitly characterize the resulting uncertainty in the detection claim.
- [§2.2, Eqs. (8)–(9); Appendix D] The effective rate N_eff,det = b N_det filters only on impact parameter (mu > 10) and does not condition on the detection significance, which also depends on epsilon_i and SNR_i. Because compact region size gives high mu but likely low epsilon_i, the product N_gal N_HII tau/t_E is a geometric alignment rate rather than a detectable-event rate. The manuscript should either present N_eff,det as an upper limit or integrate over the joint distribution of H II region size, line flux fraction, and impact parameter. This is not a circularity issue; it is a missing term in the detectability calculation.
- [§2.1, observational strategy paragraph] The proposed two-stage strategy states that 'once a candidate is identified, follow-up observations can monitor the microlensing light curve.' For candidates found in archival multi-epoch spectra separated by ~10 years (e.g., SDSS vs DESI), the event duration is ~100 days and the event will have ended by the time the candidate is recognized. Archival searches can only reveal a past one-epoch excess and line-ratio anomaly; they cannot provide light-curve confirmation. Real-time spectroscopic time-domain surveys would be required for the monitoring stage. Please clarify this distinction, as it affects the practical search strategy.
minor comments (3)
- [Eq. (9) and Sec. 2.2 text] The numerical normalization is inconsistent: inserting the adopted fiducials (tau = 2.49e-10, t_E = 78 days) into Eq. (9) gives N_det ~ 7e-5 yr^-1, whereas the text says the predicted rate is 'at most 10^-5 per year'. Please harmonize the stated rate with the equation and with the effective rate quoted in the abstract.
- [Figure 3 caption/axis] The top panel y-axis label appears as '10 1' in the draft; this should be '10^-1' (i.e., 0.1 pc) to be consistent with the panel's range.
- [General] Given that the method's feasibility hinges on epsilon_i, the paper should include at least a rough uncertainty budget for the chain of inputs (epsilon_i, N_gal, N_HII, v_perp, tau). Currently Eq. (9) is presented as a point estimate without propagation of the order-of-magnitude spreads in the input catalogs.
Circularity Check
No significant circularity: the derivation is self-contained, using standard lensing physics and external population data with no fitted parameters forced to produce the target result.
full rationale
The paper's core relation m_i = (μ−1)ε_i (Eq. 5) follows directly from the definition of ε_i as the fractional contribution of a single H II region to the total galaxy line flux, combined with the achromatic magnification assumption. The ratio m_i/m_j = ε_i/ε_j (Eq. 6) is a formal identity given that definition, but the physical content—that the same factor (μ−1) applies to all lines—is an independent consequence of gravitational lensing achromaticity, not an input fitted to the outcome. The event rate estimate (Eq. 9 and Appendix C) uses external synthetic BH catalogs (Olejak et al. 2020) and published H II region surveys (PHANGS, AMUSING++, CALIFA, VESTIGE) to set the BH density, number counts, and transverse velocities; no parameter is adjusted to make N_det or N_eff,det come out to a desired value. The impact-parameter correction (Appendix D) is a standard application of Witt & Mao (1994). The paper explicitly states the low rate and acknowledges the dependence on the assumed ε_i ~ 1% for compact, dust-obscured regions, which is an empirical uncertainty rather than a circularity. No self-citations are load-bearing, and no uniqueness theorem is invoked from the authors' prior work. The derivation chain is therefore independent of its conclusions.
Assumptions & free parameters
free parameters (5)
- epsilon_i =
~1%
- N_gal =
1000
- N_HII =
100
- v_perp =
200 km/s
- mu_thr =
10 (b_thr = 0.1)
assumptions (6)
- standard math Point-mass gravitational lensing with Einstein radius theta_E (Eq. 1).
- domain assumption D_LS is approximately D_S for extragalactic sources (source at Mpc-Gpc, lens at kpc).
- domain assumption H II regions can be approximated as uniform disks for magnification (Eq. 3).
- standard math Gravitational lensing is achromatic, so all lines are magnified by the same mu.
- domain assumption The BH density and spatial distribution in the disk and halo follow the Olejak et al. (2020) synthetic catalogs.
- domain assumption Only the target H II region is magnified while the galaxy continuum and other line-emitting regions are not.
Cite this review
Pith. "Pith review of Spectral Microlensing of Extragalactic H II Regions by Stellar-Mass Black Holes." pith.science (2026). https://pith.science/paper/RHHOOLWH
@misc{pith2026260800688,
  author       = {Pith},
  title        = {Pith review of: Spectral Microlensing of Extragalactic H II Regions by Stellar-Mass Black Holes},
  year         = {2026},
  howpublished = {\url{https://pith.science/paper/RHHOOLWH}},
  note         = {Machine review of arXiv:2608.00688}
}
abstract
Most of the Milky Way's predicted stellar-mass black holes remain hidden, especially at high Galactic latitudes or in the Galactic halo, where traditional dense-field stellar microlensing is ineffective. We propose an alternative method to map this isolated population via the spectral microlensing of compact, extragalactic H II regions. Projected onto the source plane, the physical Einstein radius of a Galactic black hole can match the typical core sizes of H II regions in distant galaxies. Microlensing triggers an achromatic magnification, producing distinct narrow emission-line excesses in integrated galaxy spectra. Because gravitational lensing is wavelength-independent, intrinsic line ratios are preserved, offering a robust discriminant against false-positive astrophysical transients. Notably, the efficiency of this method depends critically on the size of the H II regions: while extended regions suffer from low optical depth, compact regions with a physical size $\lesssim 10$ pc offer significantly higher magnifications. These compact cores, however, are heavily dust-obscured at optical wavelengths, making infrared and radio observations the primary windows for this method. Even so, the spatial sparseness of background H II regions and the stringent alignment requirement for high magnification limit the expected event rate to $\sim 10^{-6}$ per year. Nevertheless, this method offers a unique opportunity to detect stellar-mass black holes and constrain their abundance in such low-density environments.
Figures


Reference graph
Works this paper leans on
-
[1]
2022, ApJS, 259, 35, doi: 10.3847/1538-4365/ac4414
Abdurro’uf, Accetta, K., Aerts, C., et al. 2022, ApJS, 259, 35, doi: 10.3847/1538-4365/ac4414
-
[2]
2020, ApJS, 249, 3, doi: 10.3847/1538-4365/ab929e
Ahumada, R., Allende Prieto, C., Almeida, A., et al. 2020, ApJS, 249, 3, doi: 10.3847/1538-4365/ab929e
-
[3]
2019, arXiv e-prints, arXiv:1902.05569, doi: 10.48550/arXiv.1902.05569
Akeson, R., Armus, L., Bachelet, E., et al. 2019, arXiv e-prints, arXiv:1902.05569, doi: 10.48550/arXiv.1902.05569
-
[4]
2025, Symmetry, 17, 1393, doi: 10.3390/sym17091393
Bambi, C. 2025, Symmetry, 17, 1393, doi: 10.3390/sym17091393
-
[5]
T., Chandar, R., Kreckel, K., et al
Barnes, A. T., Chandar, R., Kreckel, K., et al. 2026, A&A, 706, A95, doi: 10.1051/0004-6361/202555751
-
[6]
Belfiore, F., Leroy, A. K., Williams, T. G., et al. 2023, A&A, 678, A129, doi: 10.1051/0004-6361/202347175
-
[7]
2025, A&A, 696, A78, doi: 10.1051/0004-6361/202450963
Boselli, A., Fossati, M., Roehlly, Y., et al. 2025, A&A, 696, A78, doi: 10.1051/0004-6361/202450963
-
[8]
Boselli, A., Fossati, M., Roehlly, Y., et al. 2026, arXiv e-prints, arXiv:2605.02648. https://arxiv.org/abs/2605.02648 CSST Collaboration, Gong, Y., Miao, H., et al. 2026, Science China Physics, Mechanics, and Astronomy, 69, 239501, doi: 10.1007/s11433-025-2809-0 DESI Collaboration, Aghamousa, A., Aguilar, J., et al. 2016, arXiv e-prints, arXiv:1611.00036...
work page Pith review arXiv 2026
Show all 35 references
-
[9]
Lazio, T. J. L. W. 2009, IEEE Proceedings, 97, 1482, doi: 10.1109/JPROC.2009.2021005
2009
-
[10]
2023a, MNRAS, 518, 1057, doi: 10.1093/mnras/stac3140
El-Badry, K., Rix, H.-W., Quataert, E., et al. 2023a, MNRAS, 518, 1057, doi: 10.1093/mnras/stac3140
-
[11]
2023b, MNRAS, 521, 4323, doi: 10.1093/mnras/stad799
El-Badry, K., Rix, H.-W., Cendes, Y., et al. 2023b, MNRAS, 521, 4323, doi: 10.1093/mnras/stad799
-
[12]
2022, A&A, 659, A191, doi: 10.1051/0004-6361/202141727
Emsellem, E., Schinnerer, E., Santoro, F., et al. 2022, A&A, 659, A191, doi: 10.1051/0004-6361/202141727
2022 doi
-
[13]
F., Morisset, C., et al
Espinosa-Ponce, C., S´ anchez, S. F., Morisset, C., et al. 2020, MNRAS, 494, 1622, doi: 10.1093/mnras/staa782
2020 doi
-
[14]
L., Belczynski, K., Wiktorowicz, G., et al
Fryer, C. L., Belczynski, K., Wiktorowicz, G., et al. 2012, ApJ, 749, 91, doi: 10.1088/0004-637X/749/1/91 Gaia Collaboration, Panuzzo, P., Mazeh, T., et al. 2024, A&A, 686, L2, doi: 10.1051/0004-6361/202449763
2012 doi
-
[15]
P., Mather, J
Gardner, J. P., Mather, J. C., Clampin, M., et al. 2006, SSRv, 123, 485, doi: 10.1007/s11214-006-8315-7
2006 doi
-
[16]
2023, MNRAS, 520, 4902, doi: 10.1093/mnras/stad114
Groves, B., Kreckel, K., Santoro, F., et al. 2023, MNRAS, 520, 4902, doi: 10.1093/mnras/stad114
2023 doi
-
[17]
Guo, M., Inayoshi, K., Michiyama, T., & Ho, L. C. 2020, ApJ, 901, 39, doi: 10.3847/1538-4357/abacc1
2020 doi
-
[18]
2016, MNRAS, 462, 1757, doi: 10.1093/mnras/stw1716
Gutkin, J., Charlot, S., & Bruzual, G. 2016, MNRAS, 462, 1757, doi: 10.1093/mnras/stw1716
2016 doi
-
[19]
D., & Polnarev, A
Hog, E., Novikov, I. D., & Polnarev, A. G. 1995, A&A, 294, 287 Ivezi´ c,ˇZ., Kahn, S. M., Tyson, J. A., et al. 2019, ApJ, 873, 111, doi: 10.3847/1538-4357/ab042c
1995 doi
- [20]
-
[21]
C., Edgar, B
Kennicutt, Jr., R. C., Edgar, B. K., & Hodge, P. W. 1989, ApJ, 337, 761, doi: 10.1086/167147
1989 doi
-
[22]
Y., Lu, J
Lam, C. Y., Lu, J. R., Udalski, A., et al. 2022, ApJL, 933, L23, doi: 10.3847/2041-8213/ac7442
2022 doi
-
[23]
2013, ApJL, 778, L41, doi: 10.1088/2041-8205/778/2/L41
Liu, G., Calzetti, D., Hong, S., et al. 2013, ApJL, 778, L41, doi: 10.1088/2041-8205/778/2/L41
2013 doi
-
[24]
J., et al
Liu, H.-L., Liu, T., Evans, II, N. J., et al. 2021, MNRAS, 505, 2801, doi: 10.1093/mnras/stab1352
2021 doi
-
[25]
K., et al
Barrera-Ballesteros, J. K., et al. 2024, MNRAS, 528, 6099, doi: 10.1093/mnras/stae345
2024 doi
- [26]
-
[27]
Murchikova, L., & Sahu, K. C. 2025, ApJL, 988, L12, doi: 10.3847/2041-8213/ade7f8
2025 doi
-
[28]
2020, A&A, 638, A94, doi: 10.1051/0004-6361/201936557
Sobolewska, M. 2020, A&A, 638, A94, doi: 10.1051/0004-6361/201936557
2020 doi
-
[29]
C., Anderson, J., Casertano, S., et al
Sahu, K. C., Anderson, J., Casertano, S., et al. 2022, ApJ, 933, 83, doi: 10.3847/1538-4357/ac739e
2022 doi
-
[30]
C., Anderson, J., Casertano, S., et al
Sahu, K. C., Anderson, J., Casertano, S., et al. 2025, ApJ, 983, 104, doi: 10.3847/1538-4357/adbe6e
2025 doi
-
[31]
2022, A&A, 658, A188, doi: 10.1051/0004-6361/202141907
Santoro, F., Kreckel, K., Belfiore, F., et al. 2022, A&A, 658, A188, doi: 10.1051/0004-6361/202141907
2022 doi
-
[32]
E., Brown, J
Sukhbold, T., Ertl, T., Woosley, S. E., Brown, J. M., & Janka, H.-T. 2016, ApJ, 821, 38, doi: 10.3847/0004-637X/821/1/38
2016 doi
-
[33]
X., Woosley, S
Timmes, F. X., Woosley, S. E., & Weaver, T. A. 1996, ApJ, 457, 834, doi: 10.1086/176778
1996 doi
- [34]
-
[35]
Wootten, A., & Thompson, A. R. 2009, IEEE Proceedings, 97, 1463, doi: 10.1109/JPROC.2009.2020572
2009
Reviewed August 5, 2026 · model on record in the stance chip above.
Discussion (0). Sign in to comment.