REVIEW 3 major objections 5 minor 1 cited by
Deep learning interpretability for rough volatility
T0 review · 3 major / 5 minor · reviewed 2026-08-12 · deepseek-v4-flash
Pith's one-line read A neural network trained to read rough Heston parameters from volatility surfaces relies most on short-maturity, deep in-the-money options.
desk verdict First interpretability study for rough Heston calibration nets: consistent finding that short-maturity deep ITM vols dominate, but the evidence is qualitative and the training design may shape the result. read the letter →
The pith
A machine-rendered reading of the paper's core claim, the machinery that carries it, and where it could break.
The reading
What carries the argument
The load-bearing object is the trained feedforward neural network (one hidden layer, ELU activations, trained on 10,000 synthetic rough Heston implied-volatility surfaces with ZCA-whitened inputs) viewed as an inverse map from surface points to the six parameters {ρ, V0, κ, θ, ν, H}. The argument is carried by four attribution methods that assign each surface point a relevance score for each predicted parameter: LIME (local linear surrogate), DeepLIFT (backpropagated activation differences), LRP (layer-wise relevance propagation), and SHAP (Shapley-value-based global attributions). The convergence of all four methods on the same surface regions is what turns the attributions into a claim about the model's perceived sensitivity structure.
What would settle it
Train the same FNN architecture and data pipeline on rough Heston surfaces with H fixed at 0.5 (the non-rough Brownian limit) and compare the LIME, DeepLIFT, LRP, and SHAP attribution maps. If the short-maturity deep in-the-money region remains the top contributor, the paper's explanation that the network keys on rough Heston's distinctive left wing is wrong; if the attribution shifts toward at-the-money or spreads evenly, the claim is supported.
Extended reading notes
Core claim
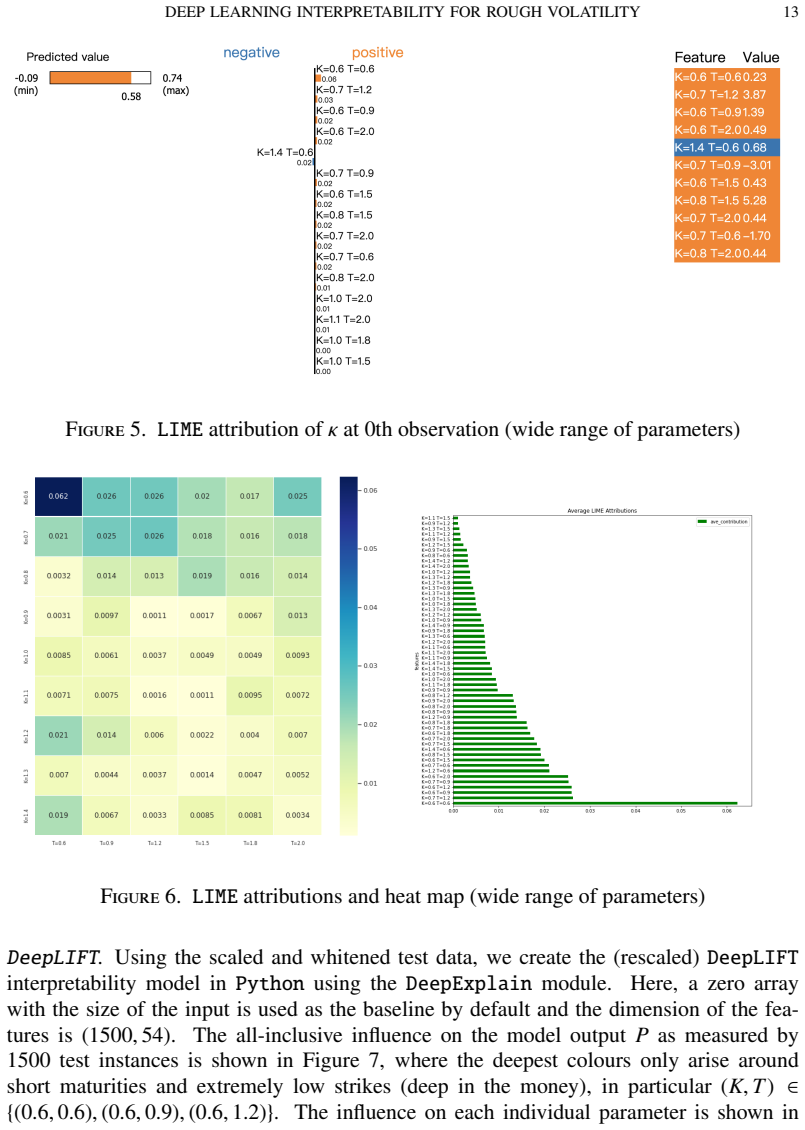
The central discovery is that the FNN's learned inverse map from implied volatility surfaces to rough Heston parameters is dominated, across LIME, DeepLIFT, LRP, and SHAP, by the deep in-the-money, short-maturity region of the smile—most consistently the point (K, T) = (0.6, 0.6) on the authors' grid. The mean-reversion speed κ, the volatility-of-volatility ν, and the roughness parameter H are read almost exclusively from this left wing at short maturities; ρ is read from both wings at extreme expiries; V0 from short-maturity wings; and θ from long maturities according to LRP and DeepLIFT, though the SHAP global analysis instead highlights short-expiry deep-ITM points. The authors explain the left-wing dominance by the known result that rough Heston's short-maturity left wing is dramatically steeper than plain Heston's, so the network weights the surface region most distinctive of the rough model. They contrast this with their prior interpretability study of the plain Heston model, where short maturity mattered but no clear moneyness preference appeared.
Load-bearing premise
The analysis treats the trained feedforward network as a faithful surrogate for the rough Heston model's true parameter-to-surface map, even though that map is probably not one-to-one and the network itself fails to predict κ and ρ out-of-sample on the narrower parameter range.
Editorial extensions
If this is right
- Calibration error on the short-maturity, deep in-the-money region will propagate most strongly into parameter estimates, so FNN-based calibrations of rough Heston should validate accuracy there first.
- The out-of-sample failures for κ and ρ on the narrow-range network confirm that the parameter-to-surface map is not bijective; attributions for weakly identified parameters should be interpreted with caution.
- The agreement among LIME, DeepLIFT, LRP, and SHAP indicates that the left-wing dominance is a stable property of the learned map rather than an artifact of one attribution algorithm.
- The comparison with plain Heston implies that interpretability patterns can serve as a diagnostic: a network calibrated on data that does not exhibit rough Heston's steep left wing would be expected to show a different attribution profile.
Reading between the lines
- A natural extension would be to train the same network on market-calibrated parameter distributions instead of uniform draws; the uniform prior may itself inflate the influence of the left wing.
- Applying the same attribution pipeline to other rough models (e.g., rough Bergomi) would test whether deep-ITM short-maturity dominance is a universal signature of rough volatility.
- If the attribution pattern persists on real SPX data, calibration algorithms should either up-weight trustworthy deep ITM quotes or use robust losses to limit the influence of illiquid noise in that region.
- The paper's own observation that SHAP's global reading for θ contradicts the local methods' long-maturity picture suggests that local-versus-global disagreements may themselves carry information about parameter identifiability.
Signed reviews
Editorial analysis
A structured set of objections, weighed in public.
Referee Report
Summary. The paper trains a feedforward neural network (FNN) to invert the rough Heston model's implied volatility surface into its six parameters (ρ, V0, κ, θ, ν, H) using synthetic data generated from two parameter ranges, and then applies four interpretability techniques (LIME, DeepLIFT, LRP, and DeepSHAP) to the trained network. The main finding is that the network attributes its parameter predictions predominantly to short-maturity deep in-the-money implied volatilities, with ρ read from both wings and θ from longer maturities; this pattern is reported as consistent across the four attribution methods. The authors interpret this as aligning with the rough-Heston-specific left-wing behavior of the volatility surface, and compare with a previous plain-Heston interpretability study. The paper also reports calibration accuracy and out-of-sample performance for the two networks, acknowledging non-identifiability of the parameter-to-surface map and large out-of-sample errors for κ and ρ.
Significance. If the central interpretability claim is robust, the paper offers a genuinely useful case study for deep calibration in rough volatility, showing where a neural-network calibrator concentrates its attention and providing a caution that liquid at-the-money quotes are not necessarily the dominant drivers of the learned inverse map. The convergence of four different attribution methods on the same qualitative pattern, and the consistency with known results on the rough Heston left wing (Keller-Ressel and Majid, Fukasawa), are notable strengths. However, the significance is currently tempered by the lack of any quantitative validation of the FNN attributions against the true forward map, the absence of error bars or seed-stability checks, and the acknowledged non-identifiability of the inverse problem; these issues leave open the possibility that the headline pattern is an artifact of the network training or the chosen grid.
major comments (3)
- [§3.5, Tables 4-5, §5] The central claim, stated in Section 5 as 'short-maturity deep in-the-money volatilities actually provide the largest contribution overall', is presented as a property of the rough Heston model and its neural-network calibrator, but the attribution evidence comes from a single trained FNN whose inverse map is acknowledged in Section 3.5 to be 'not bijective'. The out-of-sample errors in Tables 4 and 5 are large for κ (0.1167) and ρ (0.1650) even for the broad-range network used in the interpretability study. These facts raise a load-bearing concern: the network's feature attributions may reflect how the training objective resolved non-identifiability and how the uniform parameter sampling shaped the loss landscape, rather than the intrinsic sensitivity structure of the rough Heston surface. To support the model-level interpretation in Section 4.3 and Section 5, the paper should either directly compare FNN attributions with the true local sensitivity of the forward map (e.g., finite-difference derivatives of σ_imp with respect to each parameter along the same grid), or add a retraining analysis with different random seeds, different sampling distributions, and perhaps different network architectures, to show that the attribution pattern is stable and not an artifact of a particular learned inverse.
- [§3.3, §4.1, Figures 6-12] The single most important feature identified by every attribution method is the grid corner (K,T)=(0.6,0.6), which is the extreme lower-left point of the chosen strike-maturity grid (K ∈ {0.6,...,1.4}, T ∈ {0.6,...,2}). No robustness check is provided against the choice of grid boundaries. If the strike grid extended to lower strikes, the 'deep in-the-money' attribution might shift toward newly included points, and the specific claim about the left wing at short maturities could be affected. The authors should either extend the grid (e.g., include strikes 0.2-0.5) or perform a test on a sub-grid that removes the corner from the boundary, to demonstrate that the headline pattern is not a boundary artifact.
- [§4.1-4.2, Figures 5-12, §3.5] All attribution results are reported for a single trained network (the broad-range FNN), with no error bars, confidence intervals, or stability analysis across network initializations. The paper states in Section 3.5 that the FNN calibration was repeated under different configurations, but the interpretability study is based on a single final network, and the four attribution methods are evaluated on that same network. Consequently, the observed agreement among LIME, DeepLIFT, LRP, and SHAP does not by itself rule out network-specific artifacts or chance patterns. The authors should compute attribution heatmaps for at least several random seeds (and ideally for both scaling approaches) and report the dispersion of the average absolute attribution for the top features, to establish that the qualitative pattern is statistically stable.
minor comments (5)
- [§3.5, Figures 3-4] The 'accuracy' curves in Figures 3 and 4 are not defined for a regression problem; please clarify the metric or replace it with a standard regression accuracy measure, e.g., 1 - normalized mean squared error.
- [§3.4, §4.1] The attribution methods are applied to scaled and ZCA-whitened data, but the paper does not explain how attributions computed on whitened features are mapped back to the original (K,T) grid shown in the heatmaps. Since ZCA is an invertible linear transformation, the back-transformation should be stated explicitly to avoid ambiguity.
- [§4.2] The sentence 'it should be noted that the feature influencing the prediction most is far from the money' is confusing because the feature (K,T)=(0.6,0.6) is deep in the money for a call option with spot 1; the authors likely mean 'far from at-the-money' rather than 'far from the money', and should rephrase.
- [§3.5, Tables 4-5] The error metric in equation (3.3) is a mean-squared logarithmic ratio, so the reported numbers are dimensionless; stating this explicitly next to the tables would help readers interpret the magnitudes.
- [§4.1, LIME description] The description of LIME omits practical implementation details such as the number of perturbed samples, the kernel width, and how the neighborhood is defined; adding these would improve reproducibility.
Circularity Check
No significant circularity: the attribution study is descriptive, and the only self-citation ([17]) is a transparent, non-load-bearing comparison baseline.
full rationale
The paper makes no derivation from first principles that could reduce to its inputs. It trains an FNN on synthetic implied-volatility surfaces generated from the rough Heston model, then applies LIME, DeepLIFT, LRP, and SHAP to describe which surface regions drive the network's parameter predictions. The central finding—short-maturity deep in-the-money volatilities provide the largest contribution—is a descriptive property of the fitted network, not a quantity derived from an input that already contains it. The paper explicitly concedes that the parameter-to-surface map is 'probably not bijective' and reports out-of-sample failures for kappa and rho (Tables 4 and 5), so it does not overclaim that the network perfectly represents the model. The only self-citation is [17], the authors' earlier Heston interpretability paper, used transparently as a methodological template and as the comparison baseline in Tables 6 and 7; the rough-Heston attribution scores are computed independently from the present FNN and do not reduce to [17]. External theoretical results [23, 32] are cited as supporting mathematical facts about rough-Heston behavior, not as inputs to the attribution computation. No fitted parameter is renamed as a prediction, and no equation is equivalent by construction to the conclusion. Thus the work is self-contained for what it claims: an interpretability analysis of a specific trained network.
Assumptions & free parameters
free parameters (3)
- Synthetic parameter support (broad range) =
rho [-1,-0.3564]; V0 [0.0157,0.1089]; kappa [0.0724,0.7057]; theta [0.0433,0.2099]; nu [0.1632,0.5247]; H [0,0.4472]
- Strike-maturity grid =
K in {0.6,...,1.4}; T in {0.6,...,2}
- FNN hidden layer size =
6 neurons (inferred from 372 total parameters)
assumptions (4)
- domain assumption Synthetic implied volatility labels from the rough Heston model via the El Euch-Rosenbaum characteristic function are accurate enough to train a reliable surrogate.
- domain assumption The parameter-to-surface map is identifiable on the training support.
- domain assumption Feature attributions from LIME, DeepLIFT, LRP, and SHAP are meaningful for this FNN regression.
- domain assumption Uniform sampling over the chosen parameter box reflects practically relevant volatility surfaces.
Cite this review
Pith. "Pith review of Deep learning interpretability for rough volatility." pith.science (2026). https://pith.science/paper/RNLAT7YD
@misc{pith2026241119317,
  author       = {Pith},
  title        = {Pith review of: Deep learning interpretability for rough volatility},
  year         = {2026},
  howpublished = {\url{https://pith.science/paper/RNLAT7YD}},
  note         = {Machine review of arXiv:2411.19317}
}
read the original abstract
Deep learning methods have become a widespread toolbox for pricing and calibration of financial models. While they often provide new directions and research results, their `black box' nature also results in a lack of interpretability. We provide a detailed interpretability analysis of these methods in the context of rough volatility - a new class of volatility models for Equity and FX markets. Our work sheds light on the neural network learned inverse map between the rough volatility model parameters, seen as mathematical model inputs and network outputs, and the resulting implied volatility across strikes and maturities, seen as mathematical model outputs and network inputs. This contributes to building a solid framework for a safer use of neural networks in this context and in quantitative finance more generally.
Figures
Forward citations
Cited by 1 Pith paper
-
Integrating the implied regularity into implied volatility models: A study on free arbitrage model
A new moneyness-dependent Hurst exponent is inserted into an implied volatility formula that is claimed to beat SABR and fSABR, but the key H=1/2 at-the-money result is built into the formula rather than discovered.
Reference graph
Works this paper leans on
-
[1]
E. A bi Jaber and O. El Euch, Multifactor approximation of rough volatility models , SIAM Journal on Financial Mathematics, 10 (2019), pp. 309–349
work page 2019
-
[2]
E. A bi Jaber, M. Larsson, and S. Pulido, Affine volterra processes, The Annals of Applied Probability, 129 (1999), pp. 3155–3200
work page 1999
-
[3]
M. B. A laya, A. K ebaier, and D. S arr, Deep calibration of interest rates model , arXiv:2110.15133, (2021)
work page Pith review arXiv 2021
- [4]
- [5]
-
[6]
F. B aschetti, G. B ormetti, and P. Rossi, Deep calibration with random grids , Quantitative Finance, (2024), pp. 1–23
work page 2024
- [7]
- [8]
Show all 47 references
-
[9]
B ayer, M
C. B ayer, M. Fukasawa, and S. Nakahara, On the weak convergence rate in the discretization of rough volatility models, SIAM Journal on Financial Mathematics, 13 (2022), pp. SC66–SC73
2022
-
[10]
B ayer, E
C. B ayer, E. J. Hall, and R. Tempone, Weak error rates for option pricing under linear rough volatility, International Journal of Theoretical and Applied Finance, 25 (2022), p. 2250029
2022
-
[11]
B ayer, B
C. B ayer, B. Horvath, A. Muguruza, B. Stemper, and M. Tomas, On deep calibration of (rough) stochas- tic volatility models, arXiv:1908.08806, (2019)
2019 arXiv
-
[12]
B ennedsen, A
M. B ennedsen, A. L unde, and M. S. Pakkanen, Hybrid scheme for Brownian semistationary processes , Finance and Stochastics, 21 (2017), pp. 931–965
2017
-
[13]
F. E. B enth, N. Detering, and S. Lavagnini, Accuracy of deep learning in calibrating hjm forward curves, Digital Finance, (2021), pp. 1–40
2021
-
[14]
A. E. B olko, K. Christensen, M. S. Pakkanen, and B. Veliyev, A GMM approach to estimate the rough- ness of stochastic volatility, Journal of Econometrics, 235 (2023), pp. 745–778
2023
-
[15]
B onesini, G
O. B onesini, G. Callegaro, and A. Jacquier, Functional quantization of rough volatility and applications to the VIX, Quantitative Finance, 23 (2023), pp. 1769–1792
2023
-
[16]
B onesini, A
O. B onesini, A. J acquier, and A. Pannier, Rough volatility, path-dependent PDEs and weak rates of convergence, arXiv:2304.03042, (2023)
2023 arXiv
-
[17]
B rigo, X
D. B rigo, X. Huang, A. Pallavicini, and H. S´aez de Oc´ariz Borde, Interpretability in deep learning for finance: a case study for the Heston model, arXiv:2104.09476, (2021)
2021 arXiv
-
[18]
C arr and D
P. C arr and D. Madan, Option valuation using the fast Fourier transform , Journal of Computational Finance, 2 (1999), pp. 61–73. DEEP LEARNING INTERPRETABILITY FOR ROUGH VOLATILITY 23
1999
-
[19]
D ecreusefond and A
L. D ecreusefond and A. S. Ü st¨unel, Stochastic analysis of the fractional Brownian motion , Potential analysis, 10 (1999), pp. 177–214
1999
-
[20]
E l Euch, J
O. E l Euch, J. Gatheral, and M. Rosenbaum, Roughening Heston, Risk, (2019), pp. 84–89
2019
-
[21]
E l Euch and M
O. E l Euch and M. Rosenbaum, The characteristic function of rough Heston models , Mathematical Fi- nance, 29 (2019), pp. 3–38
2019
-
[22]
O. E. E uch and M. Rosenbaum, Perfect hedging in rough Heston models, The Annals of Applied Proba- bility, 28 (2018), pp. 3813–3856
2018
-
[23]
F ukasawa, Short-time at-the-money skew and rough fractional volatility , Quantitative Finance, 17 (2017), pp
M. F ukasawa, Short-time at-the-money skew and rough fractional volatility , Quantitative Finance, 17 (2017), pp. 189–198
2017
-
[24]
F ukasawa andA
M. F ukasawa andA. Hirano, Refinement by reducing and reusing random numbers of the hybrid scheme for Brownian semistationary processes, Quantitative Finance, 21 (2021), pp. 1127–1146
2021
-
[25]
G atheral, T
J. G atheral, T. Jaisson, and M. Rosenbaum, Volatility is rough, Quantitative Finance, 18 (2018), pp. 933– 949
2018
-
[26]
G uennoun, A
H. G uennoun, A. J acquier, P. Roome, and F. Shi, Asymptotic behavior of the fractional Heston model , SIAM Journal on Financial Mathematics, 9 (2018), pp. 1017–1045
2018
-
[27]
H orvath, A
B. H orvath, A. J acquier, A. M uguruza, and A. Søjmark, Functional central limit theorems for rough volatility, Finance and Stochastics, (2024), pp. 1–47
2024
-
[28]
I tkin, Deep learning calibration of option pricing models: some pitfalls and solutions , arXiv preprint arXiv:1906.03507, (2019)
A. I tkin, Deep learning calibration of option pricing models: some pitfalls and solutions , arXiv preprint arXiv:1906.03507, (2019)
2019 arXiv
-
[29]
J acquier, C
A. J acquier, C. M artini, and A. Muguruza, On VIX Futures in the rough Bergomi model , Quantitative Finance, 18 (2018), pp. 45–61
2018
-
[30]
J acquier and Z
A. J acquier and Z. Zuric, Random neural networks for rough volatility, arXiv:2305.01035, (2023)
2023
-
[31]
K eller-Ressel, M
M. K eller-Ressel, M. Larsson, and S. Pulido, Affine rough models, in Rough V olatility, SIAM, 2023
2023
-
[32]
K eller-Ressel and A
M. K eller-Ressel and A. Majid, A comparison principle between rough and non-rough Heston mod- els—with applications to the volatility surface, Quantitative Finance, 20 (2020), pp. 919—-933
2020
-
[33]
B. K im, R. Khanna, and O. O. Koyejo, Examples are not enough, learn to criticize! Criticism for inter- pretability, Advances in NeurIPS, 29 (2016)
2016
-
[34]
L ewis, Option Valuation under Stochastic Volatility, Finance Press, Newport Beach, 2001
A. L ewis, Option Valuation under Stochastic Volatility, Finance Press, Newport Beach, 2001
2001
-
[35]
L ipton, The vol smile problem, Risk, (2002)
A. L ipton, The vol smile problem, Risk, (2002)
2002
-
[36]
S. L iu, A. B orovykh, L. A. G rzelak, and C. W. O osterlee, A neural network-based framework for financial model calibration, Journal of Mathematics in Industry, 9 (2019), p. 9
2019
-
[37]
S. M. L undberg and S.-I. Lee, A unified approach to interpreting model predictions, NeurIPS, 30 (2017)
2017
-
[38]
B. B. M andelbrot and J. W. Van Ness, Fractional Brownian motions, fractional noises and applications, SIAM review, 10 (1968), pp. 422–437
1968
-
[39]
M iller, Explanation in Artificial Intelligence: Insights from the social sciences, Artificial intelligence, 267 (2019), pp
T. M iller, Explanation in Artificial Intelligence: Insights from the social sciences, Artificial intelligence, 267 (2019), pp. 1–38
2019
-
[40]
M olnar, Interpretable Machine Learning, 2022
C. M olnar, Interpretable Machine Learning, 2022
2022
-
[41]
H. S. O baid, S. A. D heyab, and S. S. S abry, The impact of data pre-processing techniques and dimen- sionality reduction on the accuracy of machine learning, in 2019 9th IEMECON Conference (iemecon), IEEE, 2019, pp. 279–283
2019
-
[42]
P annier and C
A. P annier and C. Salvi, A path-dependent PDE solver based on signature kernels , arXiv:2403.11738, (2024)
2024
-
[43]
M. T. R ibeiro, S. S ingh, and C. Guestrin, Why should I trust you? Explaining the predictions of any classifier, in Proceedings of the 22nd ACM SIGKDD International Conference, 2016, pp. 1135–1144
2016
-
[44]
R oeder and G
D. R oeder and G. Dimitroff, Volatility model calibration with neural networks a comparison between direct and indirect methods, arXiv:2007.03494, (2020)
2020 arXiv
-
[45]
S. E. R ømer, Empirical analysis of rough and classical stochastic volatility models to the SPX and VIX markets, Quantitative Finance, 22 (2022), pp. 1805–1838
2022
-
[46]
R osenbaum and J
M. R osenbaum and J. Zhang, Deep calibration of the quadratic rough Heston model, Risk, (2022)
2022
-
[47]
S hrikumar, P
A. S hrikumar, P. Greenside, and A. Kundaje, Learning important features through propagating activation differences, in International conference on machine learning, PMLR, 2017, pp. 3145–3153. 24 BO YUAN, DAMIANO BRIGO, ANTOINE JACQUIER, AND NICOLA PEDE Appendix A. F igures on...
2017
Reviewed August 12, 2026 · model on record in the stance chip above.
Discussion (0). Continue with ORCID to comment.