REVIEW 4 major objections 4 minor 62 references
Mapping the Excitation Mechanisms in the LINER I Active Galactic Nucleus NGC 5005: Positive Feedback and a Thin LINER Cocoon
T0 review · 4 major / 4 minor · reviewed 2026-08-07 · deepseek-v4-flash
Pith's one-line read Using HST narrowband imaging, this paper claims that NGC 5005's nucleus is a faint Seyfert-like AGN wrapped in a thin shock-excited LINER cocoon, with nearby star-forming clumps possibly triggered by the radio jet.
desk verdict First resolved S-BPT map of a LINER I nucleus is a solid addition, but the thin cocoon and jet-triggered star formation are threshold- and PSF-sensitive. read the letter →
The pith
A machine-rendered reading of the paper's core claim, the machinery that carries it, and where it could break.
The reading
What carries the argument
The spatially resolved S-BPT (Baldwin–Phillips–Terlevich) diagram built per WFC3 pixel from narrowband [O III], Hβ, Hα, and [S II] images. Each pixel's $\log([\mathrm{O\,III}]/\mathrm{H}\beta)$ vs $\log([\mathrm{S\,II}]/\mathrm{H}\alpha)$ position assigns it to Seyfert, LINER, or H II classes using Kewley et al. division lines. The new step is splitting LINER pixels at $\log([\mathrm{O\,III}]/\mathrm{H}\beta) = -0.28$ into green and blue groups, which spatially separates the inner LINER body from the surrounding high-excitation cocoon. This per-pixel mapping is what allows the paper to locate the cocoon and connect excitation classes to radio jet and CO morphologies.
What would settle it
Re-map the central 200 pc with an instrument whose PSF is at least a factor of two smaller than the claimed cocoon thickness (or after PSF deconvolution), and with matched IFU kinematics: if the ring of pixels with $\log([\mathrm{O\,III}]/\mathrm{H}\beta) \ge -0.28$ does not remain as a distinct ~10–20 pc shell, and if no shock-broadened line profiles appear at that radius, the cocoon and its positive-feedback interpretation lose their primary support.
Extended reading notes
Core claim
The paper's central claim is that NGC 5005's inner few hundred parsecs contain four distinct ionization regimes arranged in a nested structure. At the center, Seyfert-like pixels form a biconical (two opposed cone-like) structure colocated with the optical nucleus and a hard X-ray source; this is photoionization by a low-luminosity AGN, with an estimated bolometric luminosity between $10^{41}$ and $2\times10^{42}$ erg s$^{-1}$. Enclosing those cones is a thin LINER-like cocoon, 10–20 pc thick, defined by pixels with $\log([\mathrm{O\,III}]/\mathrm{H}\beta) \ge -0.28$ within the LINER region of the S-BPT diagram; the paper argues this cocoon is shock-excited gas, possibly from a $\sim200$ km s$^{-1}$ outflow or from filtered AGN radiation outside the ionization cones. Beyond it, a $\sim1$ kpc LINER zone is attributed to AGN photoionization, and a $\gtrsim2$ kpc LINER zone to post-AGB stars and inflow shocks. Clumpy H II regions at 90–500 pc overlap the 1.5 GHz jet and an Hα bubble, which the paper interprets as jet- or outflow-driven compression that triggers localized star formation, while a $\sim4$ kpc H II ring is ordinary star formation in a bar-driven molecular ring.
Load-bearing premise
That the thin LINER cocoon is a genuine physical shell of shock-excited gas rather than an artifact of the eye-chosen $\log([\mathrm{O\,III}]/\mathrm{H}\beta) \ge -0.28$ split acting on gas blurred by the ~10 pc point-spread function, since the claimed shell thickness is only 10–20 pc.
Editorial extensions
If this is right
- LINER galaxies can host a faint AGN whose photoionization is visible only within ~20 pc, so nuclear Seyfert-like signatures in BPT maps do not require a powerful quasar.
- The thin cocoon provides a resolved example of shock excitation in the ISM, so similar cocoons should be sought around other low-luminosity AGN with HST-class resolution.
- Jet-ISM interaction is a viable positive-feedback channel: the H II clumps and the Hα bubble inside 500 pc may be star formation triggered by the radio jet or outflow, not by the AGN radiation field alone.
- The kiloparsec LINER zones need not be AGN-powered; in NGC 5005, post-AGB stars and inflow shocks can account for the extended LINER-like emission outside ~2 kpc.
- The H II ring at ~4 kpc is consistent with star formation along bar-driven molecular gas streams, implying that large-scale morphology and small-scale AGN feedback coexist in the same galaxy.
Reading between the lines
- A concrete testable extension: if the cocoon is shock-excited, its line ratios should vary with position along the shell and its kinematics should show broadening or velocity gradients of tens to ~200 km/s; this can be checked with IFU spectroscopy at HST resolution.
- An implicit consequence the paper does not pursue: the same cocoon-splitting threshold applied to other LINER galaxies could reveal whether thin high-excitation shells are generic around low-luminosity AGN or rare, which would discriminate between outflow-shock and filtered-radiation models.
- The positive-feedback interpretation predicts that the young stellar populations in the H II clumps near the jet are younger than stars elsewhere in the ring; resolved color-magnitude or SED fitting of those clumps would test the triggering claim.
Signed reviews
Editorial analysis
A structured set of objections, weighed in public.
Referee Report
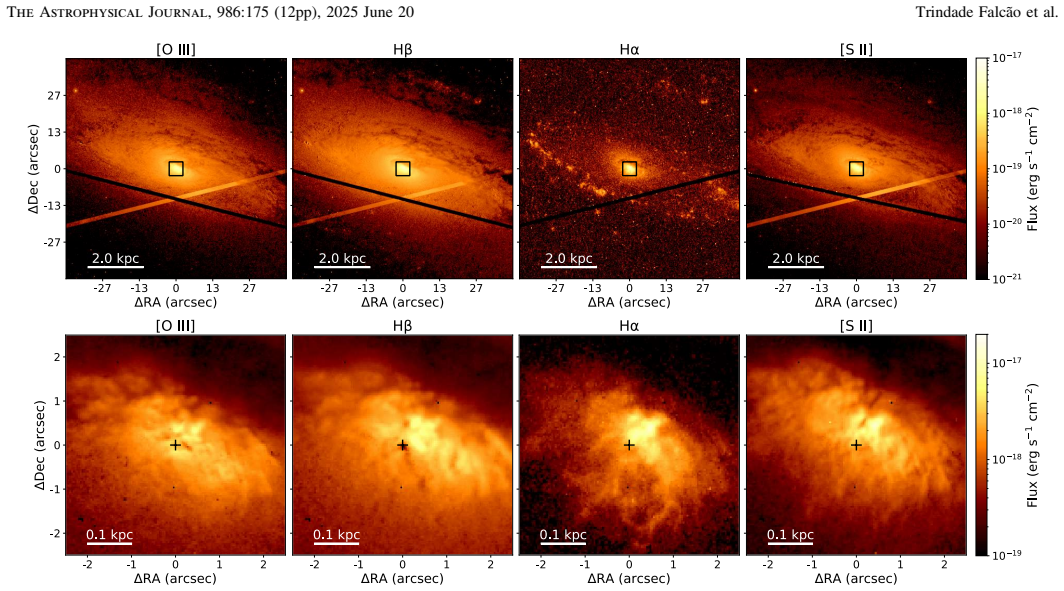
Summary. The paper presents HST/WFC3 narrowband imaging of the LINER I galaxy NGC 5005, derives per-pixel S-BPT classifications using [O III]/Hβ versus [S II]/Hα, and constructs spatially resolved excitation maps from 4 pc pixels over an 8 kpc field. It reports a compact Seyfert-like nucleus, a ~20 pc thick LINER cocoon, a central ~1 kpc LINER region, an extended >2 kpc LINER zone, and H II regions including a ~4 kpc star-forming ring. The authors interpret the inner H II regions as possibly triggered by jet–ISM interactions and the cocoon as shock-excited gas.
Significance. If the small-scale claims hold, this is the first spatially resolved BPT study of a LINER-dominated galaxy at ~10 pc resolution and would be an important step in linking low-luminosity AGN to spatially resolved ionization structure. The data reduction is standard and the large-scale maps (Map 1) are a useful resource. However, the central new claims—the Seyfert biconical nucleus, the LINER cocoon, and the positive-feedback interpretation—rest on per-pixel classifications that are sensitive to the assumed Hα fraction and a post-hoc threshold, and on spatial scales comparable to the PSF. The paper provides no propagated uncertainties and no forward-model test, so these claims are not yet secure.
major comments (4)
- [§2.3, §3.2] The classification depends on the assumed Hα fraction in the F658N bandpass. The paper adopts 45% but reports that using 30% shifts the fractions substantially (Map 3 Seyfert-like from 0.41% to 0.11%, cocoon-like from 2.69% to 3.92%) and, per §4.1.2, moves the secondary Seyfert-like cone into the cocoon class. Since the Seyfert-like cone and the cocoon are the core new results, the paper must show that the central conclusions are invariant under this systematic, or provide a full uncertainty map.
- [§3.2, Figure 4] The blue/green LINER split at log([O III]/Hβ) ≥ −0.28 is chosen after visually identifying a diagonal branch in the S-BPT diagram. This makes the cocoon a post-hoc selection rather than a prediction. A statistical or physical justification (e.g., a two-component fit to the LINER distribution, a bimodality test, or an independent diagnostic) is needed before the cocoon can be described as a distinct physical structure.
- [§4.1.1] The claimed cocoon thickness (~10–20 pc) is only 1–2 times the WFC3/UVIS PSF FWHM (~10 pc), and the "biconical" Seyfert-like region comprises just 10 pixels. With a bright nuclear [O III] source and a hard threshold in [O III]/Hβ, PSF wings can produce an annular cocoon-like structure even if the underlying excitation profile is smooth. The authors should forward-model the PSF (e.g., smooth a smooth radial profile and apply the same classification pipeline) or show that the cocoon persists with different thresholds and after deconvolution.
- [§4.1.2, §5] The "positive feedback" interpretation is based only on spatial coincidence between radio jet contours and H II-like pixels; no stellar population ages, extinction-corrected equivalent widths, or kinematic data are used to demonstrate recent star formation triggered by the jet. The abstract and conclusions present this as a finding despite the speculative wording in §4.1.2. Either the authors should add independent evidence or clearly label this as a working hypothesis to be tested with future IFU/age-sensitive observations.
minor comments (4)
- [§2.2] The continuum filters F547M and F814W have 695 s exposures, much shorter than the line-filter exposures; the S/N threshold is applied to the line images but not to the continuum-subtracted products. The noise contribution from continuum subtraction should be included in the uncertainty budget.
- [§3.2] The pixel fractions quoted in the text and in Figure 4 would be easier to interpret if they included the number of pixels in each class for Maps 1–3, given the large differences in map area.
- [§4.2.2] The large-scale LINER fraction increases from 2.68% to ~15% when the lower Hα limit is adopted; this should be stated alongside the first mention of the large-scale LINER emission to make the systematic uncertainty clear.
- [Appendix A.2] Equation (A7) defines E(B−V) using a reference color C, but the text does not state how the reference region (the green circle in Figure 1) was selected or how the results depend on that choice. A brief discussion of this sensitivity would help.
Circularity Check
Mild self-definitional labeling of the LINER cocoon from a post-hoc [O III]/Hβ threshold; the main BPT classification is externally benchmarked and not circular.
-
self definitional
[Section 3.2, Figure 4; Section 4.1.1; Conclusions]
"To explore this, we reclassified LINER pixels by log([OIII]/Hβ): those with log([OIII]/Hβ) ≥ −0.28 were assigned to a “blue LINER” group, and the rest to a “green LINER” group. ... blue LINER-like pixels form a surrounding structure around the Seyfert-like “cones,” resembling the LINER-like cocoon morphology reported by W. P. Maksym et al. (2016) and J. Ma et al. (2021)."
The “blue LINER” class is defined by the same log([OIII]/Hβ) ≥ −0.28 cut that is later labeled “cocoon-like” in the pixel fractions and maps, so the “higher-excitation” property of the cocoon is true by construction for every pixel in that class rather than being an independently detected property. The threshold was itself chosen after visually identifying the diagonal branch in the same S-BPT diagram, meaning the claim that a distinct higher-excitation LINER subpopulation exists partly restates the selection rule.
full rationale
The core sr-S-BPT mapping is not circular: each pixel is classified using the fixed Kewley et al. (2006) dividing lines in the log([O III]/Hβ)–log([S II]/Hα) plane, with a 3σ S/N cut, and the resulting large-scale structures (the r ∼ 1 kpc LINER zone and the r ∼ 4 kpc H II ring) are compared with external radio and CO maps. No physical constant is fit to data and then renamed as a prediction. The only mild circularity is the post-hoc split of LINER pixels into “blue” and “green” groups at log([O III]/Hβ) = −0.28 after visually identifying a diagonal branch; the “higher-excitation LINER-like cocoon” is then essentially the selected subset relabeled. This weakens the physical distinctness of the cocoon and the 10–20 pc thickness claim, which is at the PSF scale, but it does not invalidate the main excitation maps or the outer H II ring. Self-citations to the same group’s earlier cocoon papers (Maksym et al. 2016; Ma et al. 2021) are comparative rather than load-bearing, and no uniqueness theorem is imported.
Assumptions & free parameters
free parameters (3)
- Halpha fraction in F658N bandpass =
0.45 (with 0.30 lower limit)
- Blue/green LINER threshold =
log([O III]/Hbeta) = -0.28
- Intrinsic stellar color ratio C (F547M/F814W) =
Not quoted numerically (value from low-dust green circle region)
assumptions (6)
- domain assumption Calzetti et al. (2000) extinction curve applies with a single E(B-V) per pixel
- domain assumption The low-dust reference region (green circle, Figure 1) has the same intrinsic stellar color as all other regions
- domain assumption Each WFC3 pixel's line emission is a single ionization zone
- standard math Kewley et al. (2006) S-BPT boundary lines are valid for narrowband-derived ratios
- domain assumption The [O III] flux within 1.5 kpc is entirely produced by AGN photoionization
- domain assumption Literature bolometric corrections (Heckman 2005; Duras 2020; Lamastra 2009) apply to this source
Cite this review
Pith. "Pith review of Mapping the Excitation Mechanisms in the LINER I Active Galactic Nucleus NGC 5005: Positive Feedback and a Thin LINER Cocoon." pith.science (2026). https://pith.science/paper/RS2KU23L
@misc{pith2026250614931,
  author       = {Pith},
  title        = {Pith review of: Mapping the Excitation Mechanisms in the LINER I Active Galactic Nucleus NGC 5005: Positive Feedback and a Thin LINER Cocoon},
  year         = {2026},
  howpublished = {\url{https://pith.science/paper/RS2KU23L}},
  note         = {Machine review of arXiv:2506.14931}
}
abstract
We present a spatially resolved Baldwin-Phillips-Terlevich analysis of the narrow-line region (NLR) in the low-ionization nuclear emission-line region (LINER) I galaxy NGC 5005 using Hubble Space Telescope narrowband imaging of [O III]${\lambda}$5007, H${\beta}$, H${\alpha}$, and [S II]${\lambda}{\lambda}$6717,6731. With a resolution of ${\lesssim}$0.1 (${\lesssim}$10 pc at z = 0.003), we dissect the NLR into H II (star-forming), Seyfert, and LINERs across spatial scales extending up to r$\sim$8 kpc from the nucleus. Our results reveal a compact nuclear region exhibiting Seyfert-like emission, consistent with photoionization by a low-luminosity active galactic nucleus (AGN). Surrounding this Seyfert-like nucleus is a thin ($\sim$20 pc thick) higher-excitation LINER-like cocoon, likely arising from shock-excited gas in the interstellar medium (ISM). Beyond this cocoon, a centrally localized extended (r$\sim$1 kpc) LINER-like region surrounds the Seyfert-like nucleus and cocoon, likely ionized by the AGN, while a more extended (r${\gtrsim}$2 kpc) LINER-like zone may be ionized by a combination of post-AGB stars and shocks from gas inflows. We also detect H II-like regions at both small and large scales. In the inner 500 pc, these regions may be triggered by jet-ISM interactions, potentially inducing localized star formation. At r$\sim$4 kpc, we identify an outer H II-like region tracing a large-scale star-forming ring, where ionization is dominated by young stars.
Figures


Figures from the paper (4 more)


Reference graph
Works this paper leans on
-
[1]
Allen, M. G., Groves, B. A., Dopita, M. A., Sutherland, R. S., & Kewley, L. J. 2008,ApJS, 178, 20
work page 2008
-
[2]
Baldi, R. D., Williams, D. R. A., McHardy, I. M., et al. 2018,MNRAS, 476, 3478
work page 2018
- [3]
-
[4]
Riffel, A. R. 2014,MNRAS, 445, 2353 Bel/f_iore, F., Maiolino, R., Bundy, K., et al. 2015,MNRAS, 449, 867 Bel/f_iore, F., Maiolino, R., Maraston, C., et al. 2016,MNRAS, 461, 3111
work page 2014
-
[5]
G., Stasinska, G., & Bruzual, A
Binette, L., Magris, C. G., Stasinska, G., & Bruzual, A. G. 1994, A&A, 292, 13
work page 1994
- [6]
- [7]
- [8]
Show all 62 references
-
[9]
2018,MNRAS, 480, 1106
Cazzoli, S., Marquez, I., Masegosa, J., et al. 2018,MNRAS, 480, 1106
2018
-
[10]
Cecil, G., Bland-Hawthorn, J., Veilleux, S., & Filippenko, A. V. 2001,ApJ, 555, 338
2001
-
[11]
2015,A&A, 582, A63
Cresci, G., Marconi, A., Zibetti, S., et al. 2015,A&A, 582, A63
2015
-
[12]
J., Vogel, S
Das, M., Teuben, P. J., Vogel, S. N., et al. 2003,ApJ, 582, 190
2003
-
[13]
L., Groves, B., Kewley, L
Davies, R. L., Groves, B., Kewley, L. J., et al. 2016,MNRAS, 462, 1616
2016
-
[14]
L., Groves, B., Kewley, L
Davies, R. L., Groves, B., Kewley, L. J., et al. 2017,MNRAS, 470, 4974
2017
-
[15]
A., Shastri, P., Davies, R., et al
Dopita, M. A., Shastri, P., Davies, R., et al. 2015,ApJS, 217, 12
2015
-
[16]
A., & Sutherland, R
Dopita, M. A., & Sutherland, R. S. 1995,ApJ, 455, 468
1995
-
[17]
2020,A&A, 636, A73
Duras, F., Bongiorno, A., Ricci, F., et al. 2020,A&A, 636, A73
2020
-
[18]
2022,ApJ, 938, 105
Fabbiano, G., Paggi, A., Morganti, R., et al. 2022,ApJ, 938, 105
2022
-
[19]
Fabian, A. C. 2012,ARA&A, 50, 455
2012
-
[20]
C., Kraemer, S
Fischer, T. C., Kraemer, S. B., Schmitt, H. R., et al. 2018,ApJ, 856, 102
2018
-
[21]
Guainazzi, M., Matt, G., & Perola, G. C. 2005,A&A, 444, 119
2005
-
[22]
P., & Steiner, J
Halpern, J. P., & Steiner, J. E. 1983,ApJL,269, L37
1983
-
[23]
Heckman, T. M. 1980, A&A,87, 152
1980
-
[24]
M., & Best, P
Heckman, T. M., & Best, P. N. 2014,ARA&A, 52, 589
2014
-
[25]
M., Ptak, A., Hornschemeier, G., & Kauffmann, G
Heckman, T. M., Ptak, A., Hornschemeier, G., & Kauffmann, G. 2005,ApJ, 634, 161
2005
-
[26]
J., Dopita, M
Ho, I.-T., Kewley, L. J., Dopita, M. A., et al. 2014,MNRAS, 444, 3894
2014
-
[27]
C., Filippenko, A
Ho, L. C., Filippenko, A. V., & Sargent, W. L. 1995,ApJS, 98, 477
1995
-
[28]
C., Filippenko, A
Ho, L. C., Filippenko, A. V., & Sargent, W. L. W. 1997,ApJS, 112, 315
1997
-
[29]
C., & Peng, C
Ho, L. C., & Peng, C. Y. 2001,ApJ, 555, 650
2001
-
[30]
L., Mack, J., et al
Hoffmann, S. L., Mack, J., et al. 2021, The DrizzlePac Handbook(Baltimore, MA: STScI )
2021
-
[31]
2012,A&A, 540, A11
Kehrig, C., Monreal-Ibero, A., Papaderos, P., et al. 2012,A&A, 540, A11
2012
-
[32]
J., Groves, B., Kauffmann, G., & Heckman, T
Kewley, L. J., Groves, B., Kauffmann, G., & Heckman, T. 2006,MNRAS, 372, 961
2006
-
[33]
B., Schmitt, H., & Crenshaw, D
Kraemer, S. B., Schmitt, H., & Crenshaw, D. M. 2008,ApJ, 697, 1128
2008
-
[34]
2009,A&A, 504, 73
Lamastra, A., Bianchi, S., Matt, G., et al. 2009,A&A, 504, 73
2009
-
[35]
P., Fabbiano, G., et al
Ma, J., Maksym, W. P., Fabbiano, G., et al. 2021,ApJ, 908, 155
2021
-
[36]
Maiolino, R., & Rieke, G. H. 1995,ApJ, 454, 95
1995
-
[37]
P., Fabbiano, G., Elvis, M., et al
Maksym, W. P., Fabbiano, G., Elvis, M., et al. 2016,ApJ, 829, 46
2016
-
[38]
P., Fabbiano, G., Elvis, M., et al
Maksym, W. P., Fabbiano, G., Elvis, M., et al. 2021,ApJ, 917, 85
2021
-
[39]
J., Bicknell, G
Mukherjee, D., Wagner, S. J., Bicknell, G. V., et al. 2018,MNRAS, 476, 80
2018
-
[40]
2009,MNRAS, 399, 1907
Netzer, H. 2009,MNRAS, 399, 1907
2009
-
[41]
E., & Ferland, G
Osterbrock, D. E., & Ferland, G. J. 2006, Astrophysics of Gaseous Nebulae and Active Galactic Nuclei(2nd ed.; Sausalito, CA: Univ. Science Books)
2006
-
[42]
2012,ApJ, 756, 39
Paggi, A., Wang, J., Fabbiano, G., Elvis, M., & Karovska, M. 2012,ApJ, 756, 39
2012
-
[43]
S., Grebel, E
Pilyugin, L. S., Grebel, E. K., Zinchenko, I. A., et al. 2020,A&A, 634, A26
2020
-
[44]
W., Maoz, D., Ho, L
Pogge, R. W., Maoz, D., Ho, L. C., & Eracleous, M. 2000,ApJ, 532, 323
2000
-
[45]
E., van Zee, L., Barnes, K
Richards, E. E., van Zee, L., Barnes, K. L., et al. 2015,MNRAS, 449, 3981
2015
-
[46]
1999,ApJ, 522, 157
Risaliti, G., Maiolino, R., & Salvati, M. 1999,ApJ, 522, 157
1999
-
[47]
L., Brightman, M., Stern, D., Malkan, M
Saade, M. L., Brightman, M., Stern, D., Malkan, M. A., & García, J. A. 2022, ApJ, 936, 162
2022
-
[48]
J., & Scoville, N
Sakamoto, K., Baker, A. J., & Scoville, N. Z. 2000,ApJ, 533, 149
2000
-
[49]
Schiano, A. V. R. 1985,ApJ, 299, 24
1985
-
[50]
Schiano, A. V. R. 1986,ApJ, 302, 95
1986
-
[51]
2010,ApJ, 711, 818
Sharp, R., & Bland-Hawthorn, J. 2010,ApJ, 711, 818
2010
-
[52]
Silk, J., & Rees, M. J. 1998, A&A,331, L1
1998
-
[53]
Stauffer, J. R. 1982,ApJ, 262, 66
1982
-
[54]
T., et al
Storchi-Bergmann, T., Eracleous, M., Ruiz, M. T., et al. 1997,ApJ, 489, 87
1997
-
[55]
Storchi-Bergmann, T., Lopes, R. D. S., McGregor, P. J., et al. 2010,MNRAS, 402, 819
2010
-
[56]
K., Heckman, T
Strickland, D. K., Heckman, T. M., Weaver, K. A., & Dahlem, M. 2000,AJ, 120, 2965 10 http://svo2.cab.inta-csic.es/svo/theory/fps/index.php? mode=browse&gname=HST 11 The Astrophysical Journal, 986:175(12pp), 2025 June 20 Trindade Falcão et al
2000
-
[57]
2016,ApJ, 833, 190
Terao, K., Nagao, T., Hashimoto, T., et al. 2016,ApJ, 833, 190
2016
-
[58]
S., & Ho, L
Ulvestad, J. S., & Ho, L. C. 2001,ApJL,562, L133
2001
-
[59]
1991, Third Reference Catalogue of Bright Galaxies(New York, NY: Springer)
Vaucouleurs, G., Vaucouleurs, A., Corwin, J., et al. 1991, Third Reference Catalogue of Bright Galaxies(New York, NY: Springer)
1991
-
[60]
1994,ApJ, 433, 48
Veilleux, S., Cecil, G., Bland-Hawthorn, J., et al. 1994,ApJ, 433, 48
1994
-
[61]
Veilleux, S., & Osterbrock, D. E. 1987,ApJS, 63, 295
1987
-
[62]
N., & Grosso, N
Younes, G., Porquet, D., Sabra, B., Reeves, J. N., & Grosso, N. 2012,A&A, 539, A104 12 The Astrophysical Journal, 986:175(12pp), 2025 June 20 Trindade Falcão et al
2012
Reviewed August 7, 2026 · model on record in the stance chip above.
Discussion (0). Continue with ORCID to comment.