REVIEW 4 major objections 6 minor 67 references
MOPED: A moving sum method for change point detection in pairwise extremal dependence
T0 review · 4 major / 6 minor · reviewed 2026-08-05 · deepseek-v4-flash
Pith's one-line read MOPED uses a moving sum over tail-dependence matrices to find change points in multivariate extremes.
desk verdict MOPED is a genuinely new and well-tested method for detecting changes in extremal dependence; the EEG conclusions are less secure because marginal changes can masquerade as dependence changes. read the letter →
The pith
A machine-rendered reading of the paper's core claim, the machinery that carries it, and where it could break.
The reading
What carries the argument
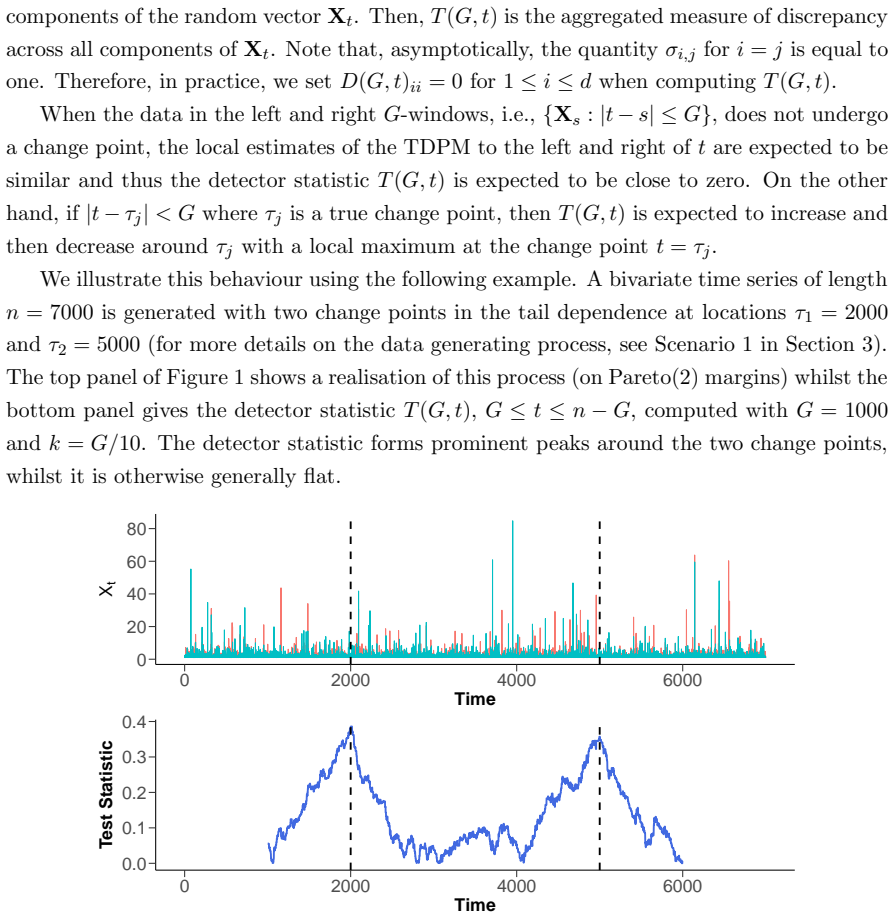
The tail pairwise dependence matrix (TPDM), the extreme-value analogue of a covariance matrix: entry (i,j) measures the asymptotic dependence between components i and j. MOPED's detector is a moving-sum (MOSUM) statistic that, at each time t and bandwidth G, subtracts the TPDM estimate from the G observations to the right of t from the estimate from the G observations to the left, and takes the Frobenius norm of the difference. Local maxima of this detector that exceed a permutation-calibrated threshold are declared change points. The multiscale, multi-threshold variant runs the detector over several bandwidths and radial thresholds and merges the resulting change-point sets with a bottom-up
What would settle it
Simulate a long series with a constant TPDM but strong serial dependence in the extremes (e.g., a tail-dependent Markov chain), run MOPED with the nominal alpha permutation threshold, and count the fraction of runs with at least one detected change point. If that fraction exceeds alpha, the permutation null is not controlling the error rate under serial dependence.
Extended reading notes
Core claim
The central claim is that changes in the extremal dependence of a multivariate regularly varying time series can be detected and localized by a moving-sum statistic on TPDM estimates. Formally, the paper models the series as piecewise segments with segment-specific TPDMs, defines a detector D(G,t) that compares Frobenius norms of TPDM estimates in windows left and right of t, and declares change points at significant local maxima. A permutation procedure calibrates the threshold, and a multiscale multi-threshold variant pools estimates over bandwidths and exceedance thresholds. In simulations, the method identifies changes in tail dependence class that E-divisive misses, and in the EEG appli
Load-bearing premise
The permutation threshold is only valid if the observations are serially independent and the marginal distributions are stationary; otherwise the test can flag changes that are not actually changes in tail dependence, or miss true ones.
Editorial extensions
If this is right
- If correct, MOPED gives a nonparametric, multiple-change-point detector for tail dependence that works in dimensions where existing extreme-value tests are computationally prohibitive.
- It can detect breaks in extremal dependence class (asymptotic dependence versus asymptotic independence) even when the Gaussian correlation structure stays constant, a case general-purpose detectors miss.
- The method provides interpretable change points: each flagged break comes with a before/after TPDM, so practitioners can see which variable pairs changed.
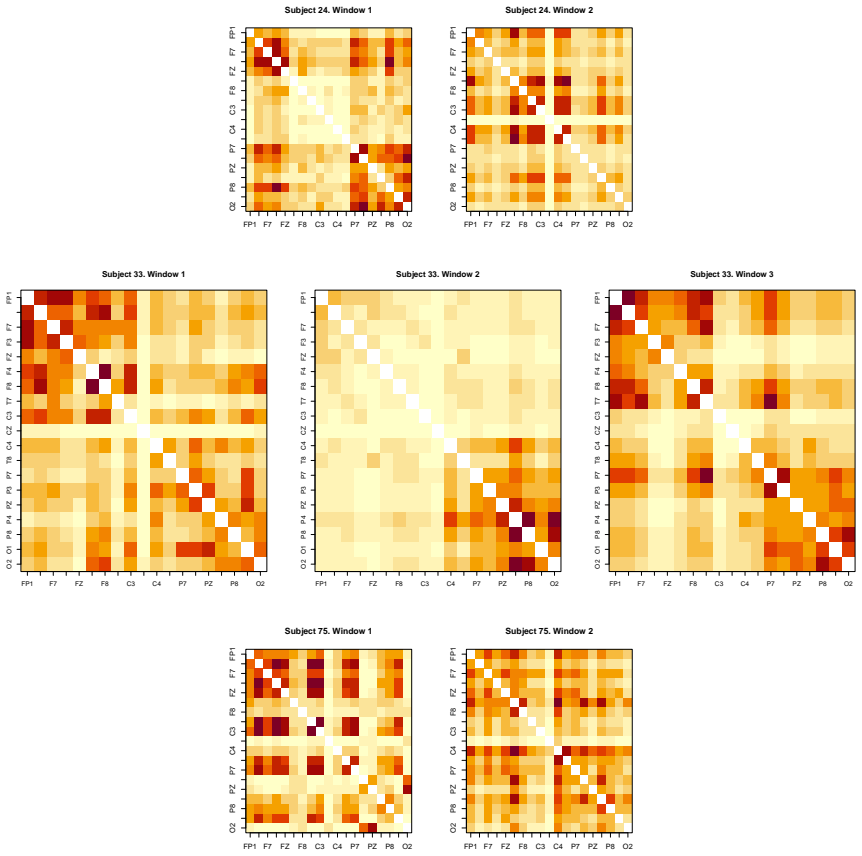
- In EEG monitoring, change points bracketing annotated seizures suggest tail-dependence changes are a usable automatic seizure signal.
- The multiscale, multi-threshold variant reduces sensitivity to the classical threshold choice, though it is less conservative and can return spurious points.
Reading between the lines
- Because the detector is built on the TPDM, MOPED could be pointed at any pairwise extremal summary by swapping the local estimator, yielding detectors tailored to asymptotic independence as well as asymptotic dependence.
- A natural stress test of the permutation calibration would be to run MOPED on series with strong serial dependence but constant TPDM; the paper's EEG preprocessing subsamples every 256th point, suggesting residual dependence is expected to inflate false positives.
- The bottom-up merging rule accepts all estimates from the finest bandwidth, so MMMOPED's false-positive propensity is likely concentrated at the smallest G; a stability check across permutations could rank change points by reproducibility.
- In higher dimensions, the Frobenius norm averages evidence over all pairs; a weighted or pairwise-max version might localize which channels change, which could sharpen seizure-onset detection in EEG applications.
Editorial analysis
A structured set of objections, weighed in public.
Referee Report
Summary. The paper proposes MOPED, a nonparametric moving-sum (MOSUM) procedure for detecting multiple change points in the tail pairwise dependence matrix (TPDM) of a multivariate regularly varying time series. The detector compares TPDM estimates in left and right windows via a Frobenius-norm statistic, with significance thresholds obtained by permutation. A multiscale, multi-threshold extension pools change point estimates across bandwidths G and extremal threshold orders k. The method is evaluated in simulations against E-divisive and the parametric method of Hazra and Bose (2025), and applied to neonatal EEG recordings, where the authors report change points near annotated seizure activity.
Significance. If the central claims hold, MOPED fills a real gap: it provides a computationally feasible, nonparametric, multiple-change-point procedure for tail dependence that scales to dimensions where existing extremal tests are unavailable or computationally prohibitive. The simulation design in Scenario 2 is a particular strength: it demonstrates that MOPED can detect changes in extremal dependence class (asymptotic dependence vs. independence) even when the correlation structure is unchanged, a case where general-purpose methods like E-divisive struggle. The paper is also accompanied by an R package, and the simulation results are reported in reproducible detail. However, the strongest claims—especially the EEG interpretation—depend on assumptions of stationary marginal distributions and serial independence that are not verified, and the paper itself acknowledges that asymptotic theory is absent. These issues limit the current support for the abstract's wording that MOPED 'identifies significant structural changes in the extremal dependence' during seizures.
major comments (4)
- [Section 4.1 and Eq. (3)] The EEG analysis standardises the full series to Pareto(2) margins using a single empirical rank transform (Section 4.1), while the method assumes stationary margins (Section 1). If seizure activity changes the marginal scale or tail heaviness, the global transform does not produce identically distributed Pareto margins over time. Because the TPDM estimator in Eq. (3) is driven by radial exceedances, such marginal changes can alter the estimated TPDM even when the copula is constant. MOPED would then declare change points at seizure boundaries that reflect changes in marginal behaviour, not pairwise extremal dependence. The paper should either test marginal stationarity in the EEG data (e.g., via a local or sliding-window marginal fit), apply segment-wise marginal transformations, or explicitly reinterpret the empirical findings as 'changes in the tail region' rather than 'changes in ext
- [Section 2.5 and Section 4.1] The permutation threshold in Section 2.5 is justified only 'under the assumption of independence of the observations.' In the EEG application, serial dependence is addressed by subsampling every 256th observation, but this does not remove potential extremal dependence at the sampled scale, and residual serial dependence can inflate the permutation null and produce spurious change points. The paper should discuss this limitation and preferably use a block permutation or dependent bootstrap scheme that preserves local dependence, or provide evidence that the subsampled EEG series passes a test for serial independence at extreme levels.
- [Section 5] The paper explicitly states that 'the theoretical treatment of the MOPED algorithm, i.e., the asymptotic characterisation of the MOSUM test statistic and convergence rates for the change point estimators, remains an avenue for further work.' Without such theory, there is no formal justification that the detector in Eq. (6) is consistent, that the η-criterion in Eq. (8) recovers the true number and locations of change points, or that the permutation p-values in Eq. (9) are calibrated under the model in Eq. (4). The empirical evidence is supportive, but the abstract and discussion should temper the claim that MOPED 'identifies' change points, and state clearly that the method is currently justified by simulation rather than asymptotic guarantee.
- [Table 1 and Section 3.1] The multiscale, multi-threshold variant (MMMOPED) is acknowledged in Section 3.1 to be 'less conservative' and prone to spurious estimates. The simulations quantify this: for q=0, MMMOPED returns the correct number of change points in only 56.8% of replications (Table 1, d=2, ρ=0.2), versus 89.7% for fixed MOPED, and it frequently reports false positives (13.3% with bq-q ≥ 2). Given that the paper recommends MMMOPED for 'applications where the accuracy of change point estimates is more important than testing,' the manuscript should provide clearer guidance on when the false-positive rate is acceptable, and should not present MMMOPED as a universally superior alternative without qualification.
minor comments (6)
- [Section 2.5] Typo: 'timesseries' should be 'time series'.
- [Section 2.6] Typo: 'eprformance' should be 'performance'.
- [Algorithm 3] In the pseudocode, 'Add bk to bC' should read 'Add bτ to bC'.
- [Figure 6 caption] The sentence 'Observations of {Xi,t} are plotted against time t...' is repeated verbatim; one occurrence should be deleted.
- [Section 2.4] The phrase 'local estimates of the TDPM' should be 'TPDM' for consistency with the abbreviation used elsewhere.
- [Abstract and Section 5] The abstract states that MOPED 'identifies significant structural changes in the extremal dependence of the signals when the subjects undergo seizures.' Given the marginal-stationarity assumption and the absence of a formal test for marginal stationarity in the EEG data, the wording should be softened (e.g., 'is consistent with changes in extremal dependence') unless additional validation is provided.
Circularity Check
No significant circularity: MOPED's detector compares local TPDM estimates under a permutation null; no fitted parameter is renamed as a prediction, and self-citations are not load-bearing.
full rationale
The central derivation chain is self-contained and not circular. The MOPED detector statistic in Equations (6)–(7) is a moving-sum contrast of local TPDM estimates, and the threshold in Section 2.5 is calibrated by a permutation null distribution, not by fitting any parameter to the target change points. The multiscale/multi-threshold merging in Section 2.6 is an aggregation rule over bandwidths and thresholds, not a fitted input that is later called a prediction. Self-citations such as Pawley (2025) and McGonigle and Cho (2023, 2025) are background references or future-work comments; none supplies a uniqueness theorem or an ansatz that forces the claimed result. The paper explicitly states in Section 5 that the asymptotic theory of MOPED 'remains an avenue for further work', so no load-bearing theorem is imported from the authors' prior work. The main caveat concerns the EEG application: Section 1 assumes stationary marginal distributions, and Section 4.1 applies a single empirical rank transform to Pareto margins. If seizure-related activity changes marginal scale or tail heaviness, the detector could flag marginal changes rather than tail-dependence changes. That is a substantive validity risk, but it is not a circular derivation: the method's output is not defined in terms of the seizure annotations, and no fitted parameter is fed back into the target conclusion. Under the stated assumptions, the claimed change-point detection is an independent estimator-data comparison, not an equivalence to its own inputs.
Assumptions & free parameters
free parameters (5)
- bandwidth G =
G = 1500 (fixed MOPED), G = 1000 (EEG), G in {500, 1000, 1500} (MMMOPED)
- extremal threshold order k =
k = 0.1G in simulations, k = 0.1G in EEG, ranks {0.2G, 0.1G, 0.05G} or {0.1G, 0.05G, 0.025G} for MMMOPED
- eta =
0.4
- significance level alpha =
0.05 or 0.1
- number of permutations M =
200
assumptions (5)
- domain assumption Multivariate regular variation with tail index alpha = 2 and standardized Pareto(2) margins
- domain assumption The limit in Equation (2) holds approximately at a finite radial threshold r0
- domain assumption Observations are serially independent for the permutation test
- domain assumption Marginal distributions are stationary and all changes are in the TPDM
- domain assumption Butterworth Delta-band filtering and subsampling remove serial dependence, and the rank transform to Pareto(2) margins is valid
Cite this review
Pith. "Pith review of MOPED: A moving sum method for change point detection in pairwise extremal dependence." pith.science (2026). https://pith.science/paper/RYMEAO6J
@misc{pith2026250900585,
  author       = {Pith},
  title        = {Pith review of: MOPED: A moving sum method for change point detection in pairwise extremal dependence},
  year         = {2026},
  howpublished = {\url{https://pith.science/paper/RYMEAO6J}},
  note         = {Machine review of arXiv:2509.00585}
}
read the original abstract
It is increasingly the case with modern time series that many data sets of practical interest contain abrupt changes in structure. These changes may occur in complex characteristics such as the extremal dependence structure, and identifying such structural breaks remains a challenging problem. Many existing change point detection algorithms focus on changes in dependence across the entire distribution, rather than the tails, and approaches that are tailored to extremes typically make strict parametric assumptions or they are only applicable to bivariate data. We propose a nonparametric MOving sum-based approach for detecting multiple changes in the Pairwise Extremal Dependence (MOPED) of multivariate regularly varying data. To avoid the classical problem of threshold selection in the study of multivariate extremes, we further propose a multiscale, multi-threshold variant of MOPED that pools change point estimates across choices of the threshold and the bandwidth used in local estimation. Good performance of MOPED is illustrated in a simulation study, and we showcase its ability to identify subtle changes in tail dependence class in the absence of correlation changes. We further demonstrate the usefulness of MOPED by identifying changes in the extremal connectivity of electroencephalogram (EEG) signals of seizure-prone neonates.
Figures


Figures from the paper (2 more)

Reference graph
Works this paper leans on
-
[1]
Arbelaez, P., Maire, M., Fowlkes, C., and Malik, J. (2010). Contour detection and hierarchical image segmentation. IEEE Transactions on Pattern Analysis and Machine Intelligence , 33(5):898--916
work page 2010
-
[2]
Arlot, S., Celisse, A., and Harchaoui, Z. (2019). A kernel multiple change-point algorithm via model selection. Journal of Machine Learning Research , 20(162):1--56
work page 2019
-
[3]
B \"u cher, A. and Kojadinovic, I. (2016). Dependent multiplier bootstraps for non-degenerate u-statistics under mixing conditions with applications. Journal of Statistical Planning and Inference , 170:83--105
work page 2016
-
[4]
Bücher, A., Jäschke, S., and Wied, D. (2015). Nonparametric tests for constant tail dependence with an application to energy and finance. Journal of Econometrics , 187(1):154--168
work page 2015
-
[5]
Castillo-Mateo, J. (2022). Distribution-free changepoint detection tests based on the breaking of records. Environmental and Ecological Statistics , 29(3):655--676
work page 2022
-
[6]
Celisse, A., Marot, G., Pierre-Jean, M., and Rigaill, G. (2018). New efficient algorithms for multiple change-point detection with reproducing kernels. Computational Statistics & Data Analysis , 128:200--220
work page 2018
-
[7]
Chavez-Demoulin, V. and Davison, A. C. (2005). Generalized additive modelling of sample extremes. Journal of the Royal Statistical Society Series C: Applied Statistics , 54(1):207--222
work page 2005
-
[8]
Chen, H. and Zhang, N. (2015). Graph-based change-point detection . The Annals of Statistics , 43(1):139 -- 176
work page 2015
Show all 67 references
-
[9]
G., Heffernan, J
Coles, S. G., Heffernan, J. E., and Tawn, J. A. (1999). Dependence measures for extreme value analyses. Extremes , 2:339--365
1999
-
[10]
and Thibaud, E
Cooley, D. and Thibaud, E. (2019). Decompositions of dependence for high-dimensional extremes. Biometrika , 106(3):587--604
2019
-
[11]
De Monte, L., Huser, R., Papastathopoulos, I., and Richards, J. (2025). Generative modelling of multivariate geometric extremes using normalising flows. arXiv preprint arXiv:2505.02957
2025 arXiv
-
[12]
and Teugels, J
Dierckx, G. and Teugels, J. L. (2010). Change point analysis of extreme values. Environmetrics , 21(7-8):661--686
2010
-
[13]
M., Wu, J
Douglass, L. M., Wu, J. Y., Rosman, N. P., and Stafstrom, C. E. (2002). Burst suppression electroencephalogram pattern in the newborn: predicting the outcome. Journal of Child Neurology , 17(6):403--408
2002
-
[14]
Drees, H. (2023). Statistical inference on a changing extreme value dependence structure . The Annals of Statistics , 51(4):1824 -- 1849
2023
-
[15]
Dupuis, D., Sun, Y., and Wang, H. J. (2015). Detecting change-points in extremes. Statistics and Its Interface , 8(1):19--31
2015
-
[16]
Dupuis, D. J. and Trapin, L. (2019). Ground-level ozone: Evidence of increasing serial dependence in the extremes. The Annals of Applied Statistics , 13(1):pp. 34--59
2019
-
[17]
e Silva, W. V. M., do Nascimento, F. F., and Bourguignon, M. (2020). A change-point model for the r-largest order statistics with applications to environmental and financial data. Applied Mathematical Modelling , 82:666--679
2020
-
[18]
and Kirch, C
Eichinger, B. and Kirch, C. (2018). A MOSUM procedure for the estimation of multiple random change points. Bernoulli , 24:526--564
2018
-
[19]
and Pawley, M
Elsom, H. and Pawley, M. (2024). Extreme value statistics for analysing simulated environmental extremes. Extremes , pages 1--27
2024
-
[20]
and Ivanovs, J
Engelke, S. and Ivanovs, J. (2021). Sparse structures for multivariate extremes. Annual Review of Statistics and Its Application , 8(1):241--270
2021
-
[21]
Girard, S., Opitz, T., Usseglio-Carleve, A., and Yan, C. (2025). Changepoint identification in heavy-tailed distributions . working paper or preprint
2025
-
[22]
Gong, Y., Zhong, P., Opitz, T., and Huser, R. (2024). Partial tail-correlation coefficient applied to extremal-network learning. Technometrics , 66(3):331--346
2024
-
[23]
B., Huser, R., and Ombao, H
Guerrero, M. B., Huser, R., and Ombao, H. (2023). Conex-- C onnect: Learning patterns in extremal brain connectivity from multichannel EEG data. The Annals of Applied Statistics , 17(1):178--198
2023
-
[24]
and Bose, S
Hazra, A. and Bose, S. (2025). Estimating changepoints in extremal dependence, applied to aviation stock prices during COVID-19 pandemic. Journal of Applied Statistics , 52(3):525--554
2025
-
[25]
Helwig, N. (2018). eegkit: Toolkit for electroencephalography data. R package. Available at http://CRAN.R-project.org/package=eegkit. Accessed 28/07/2025
2018
-
[26]
Hoga, Y. (2017). Testing for changes in (extreme) VaR . The Econometrics Journal , 20(1):23--51
2017
-
[27]
Hoga, Y. (2018). A structural break test for extremal dependence in -mixing random vectors. Biometrika , 105(3):627--643
2018
-
[28]
Hoga, Y. (2022). Modeling time-varying tail dependence, with application to systemic risk forecasting. Journal of Financial Econometrics , 20(5):1007--1037
2022
-
[29]
and Reiss, R.-D
H \"u sler, J. and Reiss, R.-D. (1989). Maxima of normal random vectors: between independence and complete dependence. Statistics & Probability Letters , 7(4):283--286
1989
-
[30]
Jiang, J., Richards, J., Huser, R., and Bolin, D. (2025a). The efficient tail hypothesis: An extreme value perspective on market efficiency. Journal of Business & Economic Statistics . To appear
-
[31]
Jiang, J., Richards, J., Huser, R., and Bolin, D. (2025b). Separation-based causal discovery for extremes. arXiv preprint
-
[32]
Jiang, Y., Cooley, D., and Wehner, M. F. (2020). Principal component analysis for extremes and application to US precipitation. Journal of Climate , 33(15):6441--6451
2020
-
[33]
S., and Wadsworth, J
Kakampakou, L., Simpson, E. S., and Wadsworth, J. L. (2024). Spatial extremal modelling: A case study on the interplay between margins and dependence. Stat , 13(4):e70021
2024
-
[34]
and Naveau, P
Kojadinovic, I. and Naveau, P. (2017). Detecting distributional changes in samples of independent block maxima using probability weighted moments. Extremes , 20(2):417--450
2017
-
[35]
and Resnick, S
Larsson, M. and Resnick, S. I. (2012). Extremal dependence measure and extremogram: the regularly varying case. Extremes , 15(2):231--256
2012
-
[36]
and Cooley, D
Lee, J. and Cooley, D. (2021). Transformed-linear prediction for extremes. arXiv preprint arXiv:2111.03754
2021
-
[37]
and Cooley, D
Lee, J. and Cooley, D. (2022). Partial tail correlation for extremes. arXiv preprint arXiv:2210.02048
2022
-
[38]
Matteson, D. S. and James, N. A. (2014). A nonparametric approach for multiple change point analysis of multivariate data. Journal of the American Statistical Association , 109(505):334--345
2014
-
[39]
McGonigle, E. T. and Cho, H. (2023). Robust multiscale estimation of time-average variance for time series segmentation. Computational Statistics & Data Analysis , 179:107648
2023
-
[40]
McGonigle, E. T. and Cho, H. (2025). Nonparametric data segmentation in multivariate time series via joint characteristic functions. Biometrika , 112(2):asaf024
2025
-
[41]
Meier, A., Kirch, C., and Cho, H. (2021). mosum: A package for moving sums in change-point analysis. Journal of Statistical Software , 97:1--42
2021
-
[42]
Messer, M., Kirchner, M., Schiemann, J., Roeper, J., Neininger, R., and Schneider, G. (2014). A multiple filter test for the detection of rate changes in renewal processes with varying variance. The Annals of Applied Statistics , 8(4):2027--2067
2014
-
[43]
and Cooley, D
Mhatre, N. and Cooley, D. (2024). Transformed-linear models for time series extremes. Journal of Time Series Analysis , 45(5):671--690
2024
-
[44]
A., and Varty, Z
Murphy, C., Tawn, J. A., and Varty, Z. (2025). Automated threshold selection and associated inference uncertainty for univariate extremes. Technometrics , 67(2):215--224
2025
-
[45]
and Wadsworth, J
Murphy-Barltrop, C. and Wadsworth, J. (2024). Modelling non-stationarity in asymptotically independent extremes. Computational Statistics & Data Analysis , 199:108025
2024
-
[46]
J., Majumder, R., and Richards, J
Murphy-Barltrop, C. J., Majumder, R., and Richards, J. (2024). Deep learning of multivariate extremes via a geometric representation. arXiv preprint arXiv:2406.19936
2024 arXiv
-
[47]
L., and Thakor, N
Muthuswamy, J., Sherman, D. L., and Thakor, N. V. (2002). Higher-order spectral analysis of burst patterns in EEG . IEEE Transactions on Biomedical Engineering , 46(1):92--99
2002
-
[48]
Epilepsy and seizures
NIH (2023). Epilepsy and seizures. https://www.ninds.nih.gov/health-information/disorders/epilepsy-and-seizures. Accessed: 02/06/2025
2023
-
[49]
Padilla, O. H. M., Yu, Y., Wang, D., and Rinaldo, A. (2022). Optimal nonparametric multivariate change point detection and localization. IEEE Transactions on Information Theory , 68(3):1922--1944
2022
-
[50]
Pawley, M. (2025). Extensions and Applications of the Tail Pairwise Dependence Matrix . PhD thesis, University of Bath
2025
-
[51]
Poon, S.-H., Rockinger, M., and Tawn, J. (2003). Modelling extreme-value dependence in international stock markets. Statistica Sinica , 13(4):929--953
2003
-
[52]
V., Guerrero, M
Redondo, P. V., Guerrero, M. B., Ombao, H., and Huser, R. (2024+). Statistics of extremes for neuroscience. In de Carvalho, M., Huser, R., Naveau, P., and Reich, B., editors, Handbook of Statistics of Extremes . Chapman & Hall/CRC Press, Boca Raton, FL. Tentatively accepted
2024
-
[53]
Resnick, S. (2004). The extremal dependence measure and asymptotic independence. Stochastic Models , 20(2):205--227
2004
-
[54]
Resnick, S. I. (2007). Heavy-tail Phenomena: Probabilistic and Statistical Modeling . Springer Science & Business Media
2007
-
[55]
B., Redondo, P
Richards, J., Alotaibi, N., Cisneros, D., Gong, Y., Guerrero, M. B., Redondo, P. V., and Shao, X. (2025). Modern extreme value statistics for Utopian extremes . Extremes , 28(1):149--171
2025
-
[56]
and Huser, R
Richards, J. and Huser, R. (2024). Extreme Quantile Regression with Deep Learning . In de Carvalho, M., Huser, R., Naveau, P., and Reich, B. J., editors, Handbook on Statistics of Extremes . Chapman & Hall/CRC
2024
-
[57]
and Cooley, D
Rohrbeck, C. and Cooley, D. (2023). Simulating flood event sets using extremal principal components . The Annals of Applied Statistics , 17(2):1333 -- 1352
2023
-
[58]
and Tawn, J
Rohrbeck, C. and Tawn, J. A. (2021). Bayesian spatial clustering of extremal behavior for hydrological variables. Journal of Computational and Graphical Statistics , 30(1):91--105
2021
-
[59]
and Hirschberg, J
Rosenberg, A. and Hirschberg, J. (2007). V-measure: A conditional entropy-based external cluster evaluation measure. In Empirical Methods in Natural Language Processing and Computational Natural Language Learning , pages 410--420
2007
-
[60]
and MacDonald, A
Scarrott, C. and MacDonald, A. (2012). A review of extreme value threshold estimation and uncertainty quantification. REVSTAT-Statistical journal , 10(1):33--60
2012
-
[61]
S., Wadsworth, J
Simpson, E. S., Wadsworth, J. L., and Tawn, J. A. (2020). Determining the dependence structure of multivariate extremes. Biometrika , 107(3):513--532
2020
-
[62]
J., Tapani, K., Lauronen, L., and Vanhatalo, S
Stevenson, N. J., Tapani, K., Lauronen, L., and Vanhatalo, S. (2019). A dataset of neonatal EEG recordings with seizure annotations. Scientific data , 6(1):1--8
2019
-
[63]
Talento, M. S. D., Richards, J., Pinto-Orellana, M., Huser, R., and Ombao, H. C. (2025). Spectral extremal connectivity of two-state seizure brain waves. arXiv preprint arXiv:2503.04169
2025 arXiv
-
[64]
Van den Burg, G. J. and Williams, C. K. (2020). An evaluation of change point detection algorithms. arXiv preprint arXiv:2003.06222
2020 arXiv
-
[65]
J., Behr, M., and Munk, A
Vanegas, L. J., Behr, M., and Munk, A. (2022). Multiscale quantile segmentation. Journal of the American Statistical Association , 117(539):1384--1397
2022
-
[66]
Youngman, B. D. (2019). Generalized additive models for exceedances of high thresholds with an application to return level estimation for US wind gusts. Journal of the American Statistical Association , 114(528):1865--1879
2019
-
[67]
Zhong, P., Huser, R., and Opitz, T. (2022). Modeling nonstationary temperature maxima based on extremal dependence changing with event magnitude. The Annals of Applied Statistics , 16(1):272--299
2022
Reviewed August 5, 2026 · model on record in the stance chip above.
Discussion (0). Continue with ORCID to comment.