REVIEW 4 major objections 5 minor 21 references
IKEBANA: A Neural-Network approach for the K-shell ionization by electron impact
T0 review · 4 major / 5 minor · reviewed 2026-08-06 · deepseek-v4-flash
Pith's one-line read A fully connected neural network taking only atomic number and overvoltage as inputs reproduces experimental K-shell ionization cross sections from hydrogen to uranium and, the paper argues, extends reliably to elements and energies no…
desk verdict A practical NN surrogate for K-shell ionization that measures well on elements with data, but the extrapolation to unmeasured elements is asserted rather than demonstrated. read the letter →
The pith
A machine-rendered reading of the paper's core claim, the machinery that carries it, and where it could break.
The reading
What carries the argument
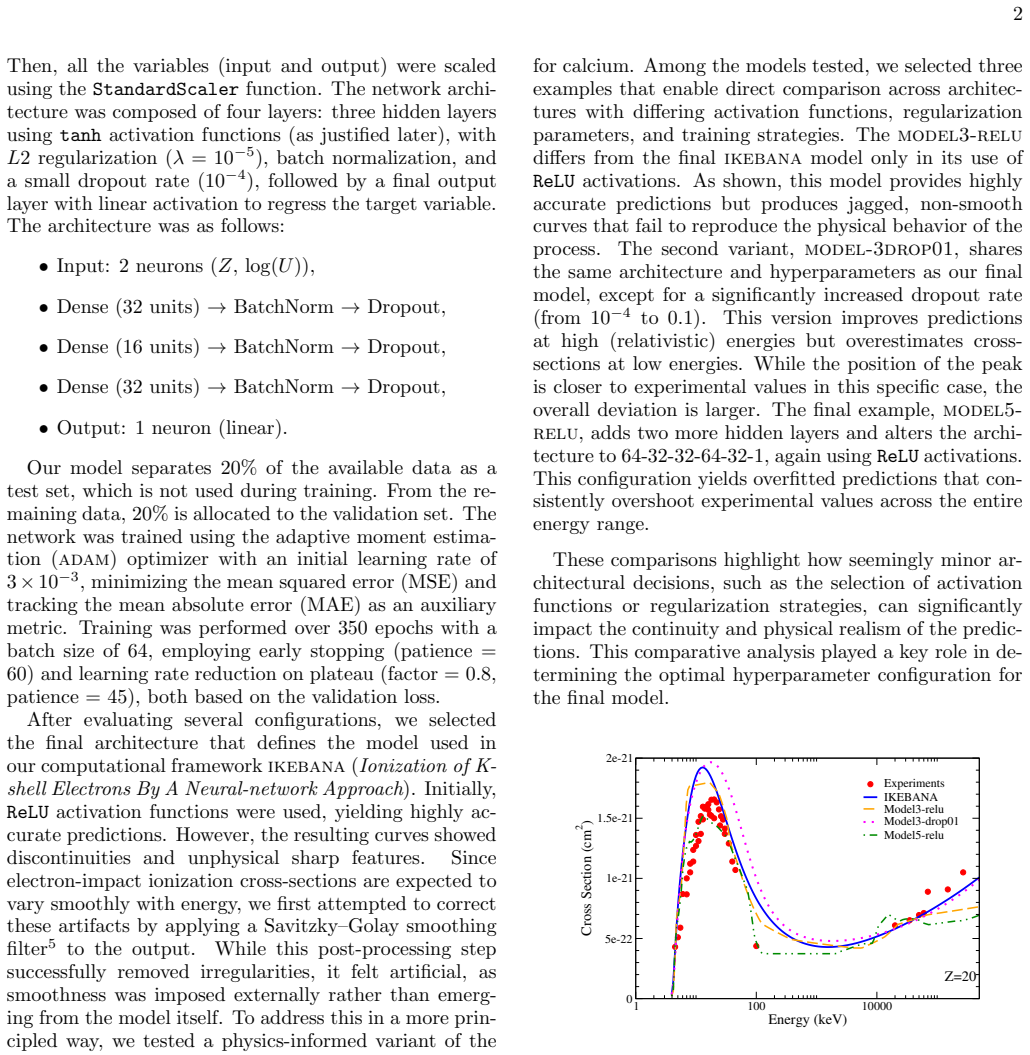
The central object is IKEBANA, a fully connected feedforward neural network with two inputs $Z$ and $\log U$, three tanh hidden layers of widths 32, 16, and 32, L2 regularization ($\lambda = 10^{-5}$), batch normalization, and a dropout rate of $10^{-4}$, ending in a linear output that regresses $\log \sigma_K$. The logarithmic scaling of cross section and overvoltage compresses the many orders of magnitude spanned by the data, while the atomic number stays linear. The tanh activation is the load-bearing design choice: it makes the predicted energy dependence smooth and continuous, whereas the ReLU version produced jagged, unphysical curves that had to be artificially smoothed.
What would settle it
Measure the K-shell ionization cross section of one of the showcased unmeasured elements, lithium, fluorine, phosphorus, or rhenium, across the threshold-to-peak energy range; if the experimental curve disagrees with the ikebana prediction by much more than the roughly 20 percent scatter that characterizes the existing database, the universal-prediction claim for unmeasured targets fails.
Extended reading notes
Core claim
The central claim is that K-shell electron-impact ionization cross sections, expressed as a function of atomic number and scaled incident energy, form a smooth pattern that a 2–32–16–32–1 network with tanh activations can learn directly from raw experimental data. The trained model reproduces the experimental compilation with $R^2 = 0.997$ on the held-out test set and with log-scale residuals whose standard deviation is about 0.5 percent after the extreme 1 percent tails are removed. The paper further claims that the model agrees with measurements at least as well as the distorted-wave and plane-wave Born approximations near thresholds and peak regions, and it exhibits predictions for lithium, fluorine, phosphorus, and rhenium as examples of targets for which no experimental data exist. The smoothness of tanh, rather than any external smoothing, is what gives the predicted energy curves their physical shape.
Load-bearing premise
The load-bearing premise is that K-shell ionization cross sections vary smoothly with atomic number and with incident energy scaled by the K-shell ionization energy, so predictions for the 27 elements with no measurements and for energy ranges no experiment has covered inherit their accuracy from neighboring measured data.
Editorial extensions
If this is right
- Reliable cross-section estimates become available immediately for the 27 elements with no K-shell ionization measurements and for energy intervals where no experiment exists, at least to the extent that interpolation in $Z$ and $U$ is physical.
- Applications such as X-ray emission analysis, plasma modeling, and radiation transport can query the ikebana code with any atomic number and energy window and obtain continuous cross-section curves without running a full theoretical calculation.
- The residual statistics give an empirical target for future theory: a calculation that wants to improve on current practice should beat the roughly 20 percent scatter that characterizes the experimental database itself once extreme outliers are removed.
- The model supplies an independent, data-driven benchmark for identifying discrepant measurements, as in the cases of chlorine and titanium where reported points deviate systematically from both the network and the theoretical curves.
Reading between the lines
- A natural stress test would be to hold out an entire well-measured element, such as silver, retrain on all other elements, and compare the predicted curve with the full experimental set; that would measure genuine cross-element generalization rather than interpolation within a dense cloud of points.
- Because the network uses only the overvoltage scaling and atomic number, the same training recipe could plausibly be applied to L-shell or M-shell ionization, or to positron impact, whenever a comparable experimental compilation becomes available; the paper does not claim this extension.
- Predictions for unmeasured elements and extreme energies are best read as interpolation hypotheses; an extension that would strengthen that reading is a calibrated predictive uncertainty for every element and energy the model is asked to cover.
Editorial analysis
A structured set of objections, weighed in public.
Referee Report
Summary. The paper trains a fully connected neural network (IKEBANA) with two inputs, the atomic number Z and the overvoltage U = E_i / I_k, on the authors' 2024 compilation of experimental K-shell electron-impact ionization cross sections for elements from H to U. The target is log σ_K, and the model is trained on a random 20% test split, reporting R² = 0.997 on the test set. The authors claim that the model provides reliable predictions for the 27 elements with no experimental data and for energy regions without measurements, and they release the code as an open Google Colab notebook. Comparisons with the theoretical calculations of Bote et al. are shown for selected elements.
Significance. If the extrapolation claim holds, IKEBANA would be a practically valuable empirical estimator, filling gaps in a sparse experimental landscape and complementing theoretical calculations. The paper's strengths include a reproducible and openly available code, an up-to-date compilation of experimental data, a thoughtful discussion of architecture choices (e.g., tanh versus ReLU activation to ensure smoothness), and an honest acknowledgment of the scatter in the underlying data. However, the validation protocol does not support the core extrapolation claim: the reported metrics are based on a random split of individual measurements, so they quantify interpolation within well-measured elements, not generalization to unseen atomic numbers or energy gaps. The manuscript needs additional element-wise and energy-gap validation, or a substantial qualification of its conclusions, before the claim of 'reliable predictions' for unmeasured elements can be accepted.
major comments (4)
- [Section III and IV (evaluation protocol)] The central claim of reliable predictions for unmeasured elements and energy regions is not supported by the random 20% test split described in Section II. In that split, the same elements appear in both training and test sets, so the reported R²=0.997 measures the network's ability to interpolate among measurements for known elements. The statements in Section III (Fig. 11) that adjacency in Z "enhances the credibility" of the predictions, and the Section IV conclusion that the model "delivers reliable predictions ... for a significant number of atomic targets for which no experimental data are currently available," require a leave-one-element-out (or at least a Z-split) validation. Please perform such a cross-validation and report the prediction errors for held-out elements. Without this, the extrapolation claim is not demonstrated; the current test protocol only validates interpolation within measured elements.
- [Section III (energy extrapolation)] The claim that IKEBANA gives reliable predictions "in energy regions where no measurements exist" (Section IV) is likewise untested. For elements with sparse data (e.g., molybdenum, xenon, barium, uranium in Figs. 8 and 10), the model's predictions across the cross-section peak rely on interpolation in Z and U, not on empirical constraints from those elements themselves. The random split does not create energy gaps, because every test point is surrounded by training points at nearby energies for familiar elements. A validation that masks a contiguous energy interval per element (for example, the peak region or the relativistic tail) and compares the model predictions with the excluded measurements would provide the necessary evidence. Until such a test is reported, the energy-extrapolation claim should be regarded as unsupported.
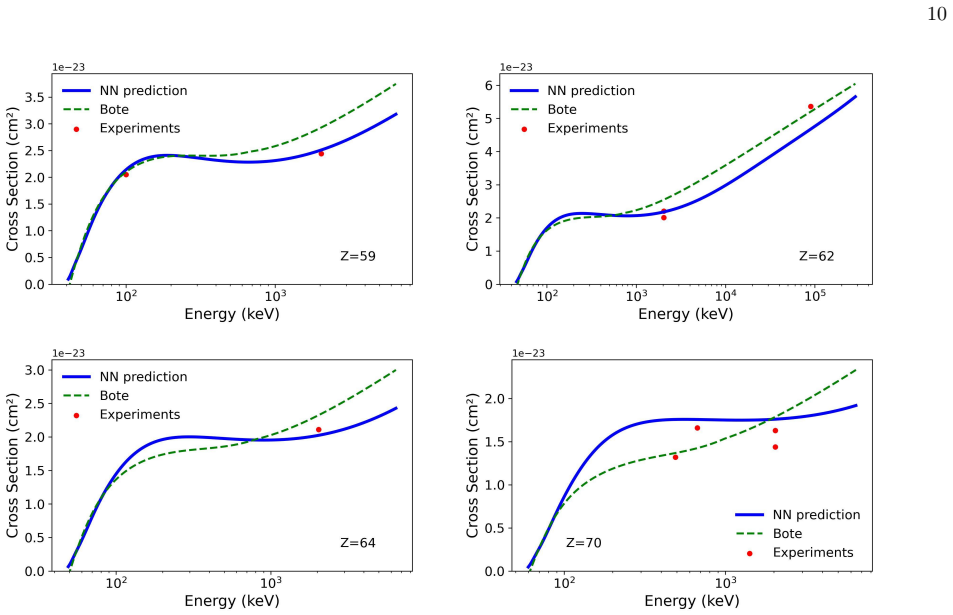
- [Section III (comparison with theory)] The comparison with Bote et al. (6) is used to lend credibility to the unmeasured-element predictions, but it is only qualitative. Figure 11 shows curves for Li, F, P, and Re with no quantitative agreement metric. Moreover, Fig. 5 shows that Bote et al. deviates substantially from the experimental data near threshold for H, He, C, and O, so agreement with Bote et al. is not a reliable proxy for experimental accuracy in the near-threshold regime. The authors should provide a systematic quantitative comparison between IKEBANA and Bote et al. over all elements (e.g., median relative deviation in energy regions where experimental data exist), and explicitly state the known limitations of the Bote et al. theory where it fails to reproduce measured cross sections.
- [Section IV (uncertainty quantification)] No uncertainty estimates accompany the predictions. For a model intended to supply cross sections for elements and energy ranges with no measured data, the absence of confidence intervals is a significant practical limitation. The authors could provide an ensemble spread (e.g., by varying the random seed or using Monte Carlo dropout) or bootstrap-based error bars. At a minimum, the term "reliable predictions" in Section IV should be qualified with the observed scatter of the training data and the lack of direct validation for extrapolated regions. Without such a qualification, readers may overinterpret the point predictions as exact values.
minor comments (5)
- [Section II] The hyperparameter selection process is described only qualitatively. Please specify how many configurations were tested and whether the test set was used at any point during model selection; this information is important for judging the validity of the reported test-set R².
- [Table I] The first row of Table I appears garbled ("Mean value 5 3 9 5"), and the units of the log-σ_K residuals are ambiguous (percent of log₁₀? of the cross section?). Define the residual definitions explicitly so that the reported standard deviations are interpretable.
- [Figure 11] The caption says "Curves as in Figure 5," but Figure 11 shows no experimental circles; please state explicitly that no experimental data exist for Li, F, P, and Re.
- [Section II] The statement "no data cleansing was implemented" is somewhat at odds with the outlier analysis in Table I. Clarify that the 1% trimming is applied only to the statistical summary, not to the training or test sets.
- [Data Availability] The code is distributed through Google Colab only; consider archiving a stable version in a permanent repository (e.g., Zenodo) to ensure long-term access and reproducibility.
Circularity Check
No circularity: the neural network is trained on independent experimental cross sections and evaluated on a held-out split, and the cited self-authored database is an input dataset, not a derived result.
full rationale
IKEBANA is an empirical machine-learning fit: the network maps (Z, log U) to log sigma_K, trained on measured cross sections from the authors' compilation (Ref. 1) and tested on a random 20% split of those measurements. The test set is genuinely held out from training, so the reported R^2 = 0.997 is a legitimate interpolation-quality metric for the sampled elements and energy ranges, not a quantity forced by construction. The predictions for unmeasured elements (Fig. 11) are extrapolations of the trained network, but that is the intended use of any fitted model, and no equation in the paper defines the target cross section in terms of the network's own outputs. The self-citations to Ref. 1 (the experimental database) and Ref. 4 (the prior neural-network training recipe) are load-bearing only as sources of data and methodology; the database itself consists of independent experimental measurements, not results derived from the present model or from an unverified uniqueness theorem. The paper's random-split test protocol does not by itself validate interpolation to entirely unmeasured elements, and the reliance on the authors' own compilation raises reproducibility questions, but these are validity and robustness concerns, not circularity. No load-bearing step reduces to its own inputs, so the circularity score is 0.
Assumptions & free parameters
free parameters (2)
- Neural network weights and biases =
roughly 2,000 (values not listed)
- Hyperparameters (architecture, learning rate, L2, dropout, epochs, batch size, early stopping) =
32-16-32 units; lr=3e-3; lambda=1e-5; dropout=1e-4; epochs=350; batch=64; early stopping patience=60
assumptions (3)
- domain assumption The K-shell ionization cross section is fully determined by atomic number Z and overvoltage U=E_i/I_k; no other target properties are needed.
- domain assumption The experimental data compilation of Ref. 1 is an unbiased representation of the true cross sections despite large scatter between different measurements.
- domain assumption K-shell cross sections vary smoothly with Z and energy, so interpolation between measured elements and energies is physically valid.
Cite this review
Pith. "Pith review of IKEBANA: A Neural-Network approach for the K-shell ionization by electron impact." pith.science (2026). https://pith.science/paper/RZCYC3BW
@misc{pith2026250620604,
  author       = {Pith},
  title        = {Pith review of: IKEBANA: A Neural-Network approach for the K-shell ionization by electron impact},
  year         = {2026},
  howpublished = {\url{https://pith.science/paper/RZCYC3BW}},
  note         = {Machine review of arXiv:2506.20604}
}
read the original abstract
A fully connected neural network was trained to model the K-shell ionization cross sections based on two input features: the atomic number and the incoming electron overvoltage. The training utilized a recent, updated compilation of experimental data, covering elements from H to U, and incident electron energies ranging from the threshold to relativistic values. The neural network demonstrated excellent predictive performance, compared with the experimental data, when available, and with full theoretical predictions. The developed model is provided in the ikebana code, which is openly available and requires only the user-selected atomic number and electron energy range as inputs.
Figures


Figures from the paper (8 more)




Reference graph
Works this paper leans on
-
[1]
S. P. Limandri, A. C. Carreras, J. C. Trincavelli, J. A. Guzmán, D. M. Mitnik, C. C. Montanari, and S. I. M. Segui, Cross sections for K-shell ionization by electron impact database (2024), https://www.famaf.unc.edu.ar/ trincavelli/database.html
work page 2024
-
[2]
Z. Hao, S. Liu, Y. Zhang, C. Ying, Y. Feng, H. Su, and J. Zhu, arXiv preprint arXiv:2211.08064 (2022)
arXiv 2022
-
[3]
B. Jaderberg, A. A. Gentile, A. Ghosh, V. E. Elfving, C. Jones, D. Vodola, J. Manobianco, and H. Weiss, Phys. Rev.. A 110, 052423 (2024)
work page 2024
-
[4]
F. Bivort Haiek, A. M. P. Mendez, C. C. Montanari, and D. M. Mitnik, J. Appl. Phys. 132, 245103 (2022),
work page 2022
- [5]
-
[6]
D. Bote, F. Salvat, A. Jablonski, and C. J. Powell, At. Data Nucl. Data Tables 95, 871 (2009)
work page 2009
- [7]
- [8]
Show all 21 references
-
[9]
T. W. Shyn, Phys. Rev. A 45 , 2951 (1992)
1992
-
[10]
Shah, D.S
M.B. Shah, D.S. Elliott, H.B. Gilbody, J. Phys. B 20 , 3501 (1987)
1987
-
[11]
Rothe, L.L
E.W. Rothe, L.L. Marino, R.H. Neynaber, S.M. Trujillo, Phys. Rev. 125 , 582 (1962)
1962
-
[12]
W. L. Fite and R. T. Brackmann, Phys. Rev. 112, 1141 (1958)
1958
-
[13]
Y. Wu, Z. An, Y. Duan, M. Liu, and J. Wu, Nucl. Instrum. Methods Phys. Res. B 269, 117 (2011)
2011
-
[14]
Aydinol, Indian J
M. Aydinol, Indian J. Pure Appl. Phys. 45, 641 (2007)
2007
-
[15]
F. He, X. Peng, X. Long, Z. Luo, and Z. An, Nucl. Instrum. Methods Phys. Res. B 129, 445 (1997)
1997
-
[16]
Ishii, M
K. Ishii, M. Kamiya, K. Sera, S. Morita, H. Tawara, M. Oyamada, and T. C. Chu, Phys. Rev. A 15, 906 (1977)
1977
-
[17]
A. S. Patil, A. V. Patil, C. G. Dighavkar, V. A. Adole, and U. J. Tupe, Chem. Phys. Lett. 796, 139555 (2022)
2022
-
[18]
Bigot, Nucl
B. Bigot, Nucl. Fusion 59 , 112001 (2019)
2019
-
[19]
Hansen, H
H. Hansen, H. Weigmann, and A. Flammersfeld, Nucl. Phys. 58, 241 (1964)
1964
-
[20]
Hansen and A
H. Hansen and A. Flammersfeld, Nucl. Phys. 79, 135 (1966)
1966
-
[21]
K-ionization with Machine Learning , https://colab.research.google.com/drive/1_ko9GtoOEifZ44mZYICoTcvFEuWBIdIm?usp=copy
Reviewed August 6, 2026 · model on record in the stance chip above.
Discussion (0). Continue with ORCID to comment.