REVIEW 3 major objections 5 minor 24 references
Optical detection of the X-ray flash in the very fast nova V1674 Her: Optical contribution of the irradiated accretion disk
T0 review · 3 major / 5 minor · reviewed 2026-08-06 · deepseek-v4-flash
Pith's one-line read The earliest optical detection of the very fast nova V1674 Her was light from its X-ray flash phase, seen via an irradiated accretion disk.
desk verdict A plausible and genuinely new composite model for the earliest optical rise of V1674 Her, but the headline 'first optical X-ray flash detection' rests on a same-group calibration and an untested 10^4 discrepancy in mass accretion rate. read the letter →
The pith
A machine-rendered reading of the paper's core claim, the machinery that carries it, and where it could break.
The reading
What carries the argument
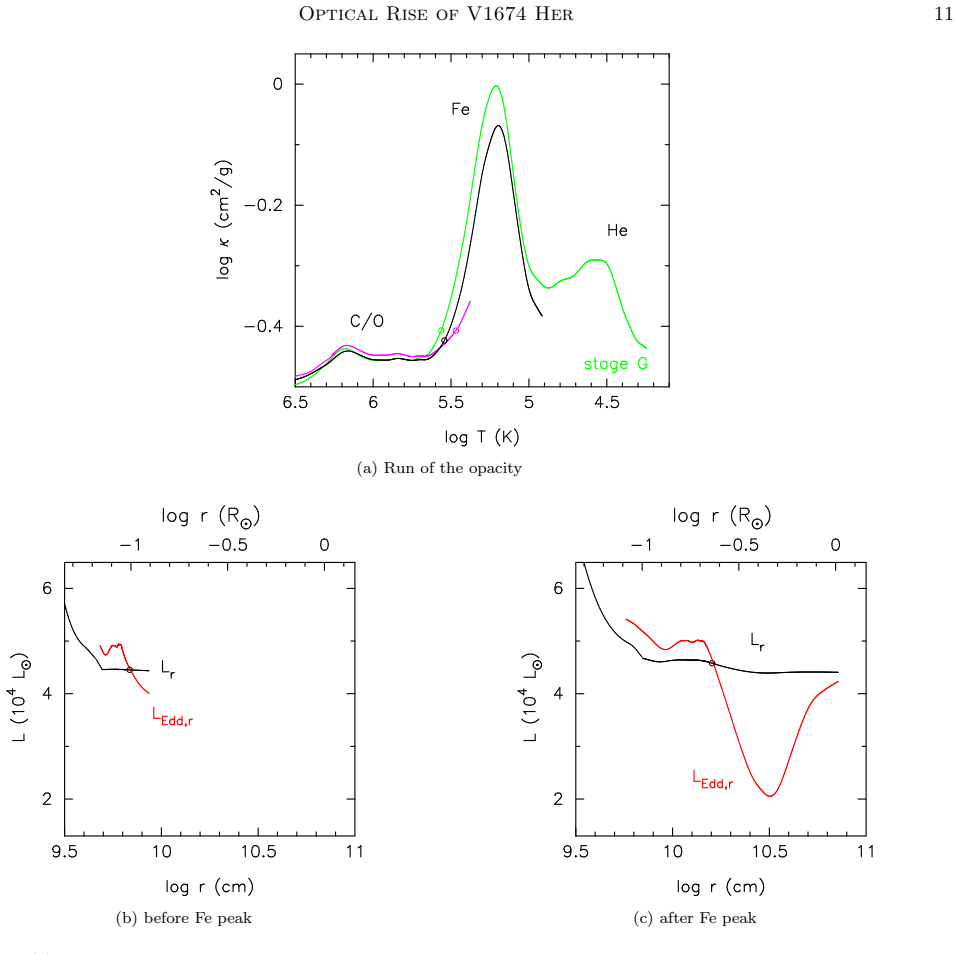
The carrying mechanism is a composite light-curve model of the binary: a hot white dwarf photosphere, an accretion disk, and a Roche-lobe-filling companion, each partitioned into surface patches that absorb the white dwarf's irradiating flux and re-emit as blackbodies, summed through the V filter. Once optically thick winds start, the optical flux is set by free-free emission from the optically thin ejecta, $L_{V,\rm ff}=A_{\rm ff}\dot{M}_{\rm wind}^2/(v_{\rm ph}^2 R_{\rm ph})$, using the wind mass-loss rate, photospheric velocity, and radius from the adopted 1.35 $M_\odot$ model. The phase identification relies on the model's X-ray flash interval, which ends when winds emerge at t=0.04 d; the sudden increase in wind mass-loss at log T_ph ~ 5.2, driven by the Fe peak in OPAL opacities, produces the observed break in the rising light curve.
What would settle it
If an independent determination of the onset time, for example from fitting the full optical rise without fixing the model, placed the onset later than about HJD 2459377.70, the first detection would occur after wind emergence at 0.04 days and the identification would fail; conversely, an X-ray observation showing the flash still active at t=0.014 days would confirm it.
Extended reading notes
Core claim
The central claim is that the first measured point of the V1674 Her outburst, g=17.0 at 0.014 days after the assumed onset of thermonuclear runaway, falls in the X-ray flash phase of a 1.35 solar-mass white dwarf, and that its brightness comes from irradiation of the accretion disk and companion star by the hot white dwarf photosphere. The pre-outburst disk at g=19.2 jumps to g=17.0, a ~2.2 mag brightening caused by irradiation, making this the first optical detection of a nova X-ray flash. After optically thick winds emerge at t=0.04 d, the optical luminosity is dominated by free-free emission from optically thin ejecta, and the composite model reproduces the observed rise including a sudden slope change at g=14.3 on day 0.1, attributed to the Fe opacity peak entering the envelope. The paper concludes that no strong shock power is required in the rising phase from g=14.8 to 7.1.
Load-bearing premise
The load-bearing premise is that the assumed eruption start time, which puts the first detection 0.014 days after onset, and the modeled wind-emergence time at 0.04 days are both accurate enough that the first point truly falls inside the X-ray flash phase; a slightly later true onset would move it into the wind phase and the identification would collapse.
Editorial extensions
If this is right
- If correct, very fast novae with massive white dwarfs can be detected optically in their X-ray flash phase, meaning the flash is observable without X-ray telescopes.
- The 10-magnitude, quarter-day optical rise of V1674 Her is fully accounted for by irradiated disk light followed by free-free wind emission, so no shock-powered component is needed in this phase.
- A hydrogen-burning white dwarf produces a ~2.2 mag jump in disk optical brightness, providing an optical on/off test for hydrogen burning that also applies to millinovae.
- The sudden break in the rising light curve at g=14.3 is a direct signature of the Fe opacity peak, giving a way to probe envelope structure in nova light curves.
- The success of the 1.35 $M_\odot$, low-accretion model constrains the white dwarf mass and accretion rate of V1674 Her; the higher-accretion model is excluded.
Reading between the lines
- If optical X-ray-flash detections become routine, survey archives may already contain unrecognized X-ray flashes of other fast novae in their earliest points; re-examining pre-maximum detections with this binary-irradiation template could find more.
- The same irradiated-disk calculation could be turned around to measure binary parameters: early light-curve shape depends on inclination and disk size, so dense early photometry could constrain these better than later phases.
- The 'no shocking power' conclusion concerns only the g=14.8-7.1 rise; if contemporaneous gamma-ray or radio observations imply shocks at other phases, a combined model would need to locate where shocks switch on.
- A testable extension: search for the predicted ~2.2 mag jump in other very fast novae with pre-outburst quiescent photometry; absence of the jump would indicate the disk was disrupted or the white dwarf less massive.
Editorial analysis
A structured set of objections, weighed in public.
Referee Report
Summary. The paper presents a composite light-curve model for the first roughly 0.3 days of the 2021 outburst of V1674 Her, combining the 1.35 solar mass white dwarf (WD) evolution sequence of Kato et al. (2025) with an irradiated accretion disk and companion star, plus free-free emission from an optically thin wind. The authors claim that the earliest ASAS-SN detection (g=17.0 at t=0.014 d) falls in the X-ray flash phase and is the first optical detection of such a phase, and that their free-free model reproduces the dense Evryscope light curve from g=14.8 to g=7.1, including the slope break at g=14.3, without any contribution from shocking. They further attribute the slope break to the Fe opacity peak in the nova envelope.
Significance. If correct, the result would open a new observational window: the X-ray flash phase of a classical nova would be detectable in optical light through irradiation of the inner binary, and the dense photometric coverage would allow the earliest stages of thermonuclear runaway to be probed. The paper's strengths are the unusually dense pre-maximum dataset, the physical simplicity of the free-free emission model, and the fact that the same model tracks a seven-magnitude rise including a slope change. However, the central phase identification relies on the absolute clock and phase boundaries of a specific 1.35 solar mass model, and the quantitative match involves post-hoc choices of inclination and accretion rate; no error bars are attached to the theoretical light curves. The result would be strengthened substantially by an explicit test of how the phase boundaries respond to the much higher mass-accretion rate that the paper itself adopts for the disk.
major comments (3)
- [Sections 4.1 and 5.3] The central phase identification depends on a mass-accretion-rate inconsistency that is not tested. The X-ray flash phase boundary and the origin t_OB are taken from Kato et al. (2025) model A, which assumes Mdot = 1e-11 solar masses per year, while Section 3.3 adopts Mdot = 2e-7 solar masses per year to reproduce the pre-outburst disk brightness, and Section 4.1 states that Mdot ~ 3e-7 solar masses per year is needed to explain the SSS duration. The paper never tests how the time from thermonuclear runaway to wind emergence changes at the high accretion rate; Section 5.3 only compares model A with 5e-10 solar masses per year, and Section 5.4 shifts t_OB by only +0.01 day. Because the claim that the first ASAS-SN point lies in the X-ray flash phase depends on this interval, the authors should either compute or cite a high-accretion-rate sequence for the phase boundaries or demonstrate explicitly that the boundaries are insensitive to Mdot over the relevant range.
- [Section 5.2] The preferred inclination angle is selected by setting aside the very data point that the headline claim advertises. The paper initially adopts i = 67 degrees, which matches the first ASAS-SN point g = 17.0, but then, because this point has sigma_g = 0.3 and the second and third points are regarded as more secure, it prefers i = 45 degrees, which is about 0.5 mag brighter than the i = 67 case and is said to be broadly consistent with the later points. The central claim that the earliest point is reproduced by the model is therefore supported by a configuration that the authors themselves do not finally adopt, and no uncertainty is propagated through the model light curves. The authors should either include the first point in a consistent fit with a stated treatment of its error, or soften the claim that the g = 17.0 point is reproduced by the preferred model.
- [Sections 5.3 and 5.4] The robustness tests are too narrow to support the strong conclusion in Section 6.2 that the first ASAS-SN data 'clearly' show the X-ray flash phase. Section 5.3 rejects alternatives only by comparing a 1.5-times slower rise and Section 5.4 by a +0.01 day shift of t_OB; these do not cover a later t_OB that could place all three ASAS-SN points in the wind phase while still matching the Evryscope data, nor do they cover the high-accretion-rate model discussed above. The conclusion should be rephrased as a model-dependent inference with stated caveats, unless such tests are added.
minor comments (5)
- [Section 5.1] The heading 'Two-step rise in the free-fee emission light curve' contains a typo and should read 'free-free emission light curve'.
- [Section 5.4] The phrase '0.9 times compressed compraed with' contains a typo; 'compraed' should be 'compared'.
- [References] The DOI for Orio et al. (2022) appears malformed as 'https://doi.org/10.103847/1538-4357/ac63be'; please verify the correct DOI.
- [Figure 5(a)] It would improve transparency to plot the sigma_g = 0.3 error bar on the first ASAS-SN point explicitly, since this uncertainty plays a central role in the inclination discussion of Section 5.2.
- [Equation (1)] Please state explicitly that the coefficient A_ff is calibrated to V1674 Her through Kato et al. (2025), so that readers understand that the free-free curve is not fully parameter-free and carries that calibration uncertainty.
Circularity Check
No significant circularity: the early-phase classification is model-based, but the ASAS-SN point is not used to set the model clock, and the key model inputs are anchored to later data.
full rationale
The phase identification rests on the authors' own Kato et al. (2025) model for tOB and the wind-emergence epoch, which is a load-bearing self-citation. However, this does not amount to circularity: the Kato et al. model was fitted to V1674 Her's later rise (e.g., the break at HJD 2,459,377.78), not to the ASAS-SN g=17.0 point; the first point is then placed at t=0.0144 d as an out-of-sample test. Section 5.4 explicitly tests shifting tOB by +0.01 d and rejects it using the later dense photometry, and Section 5.3 tests a higher-Mdot model (model B) that would move the first point into the wind phase and rejects it on the observed rise timescale. The inclination i=67 used for the headline fit comes from Habtie et al. (2024), not from the target data; the i=45 preference is a fit to the second/third ASAS-SN points, but it is not the basis of the first-point phase claim. The Mdot=1e-11 vs 2e-7 inconsistency is a correctness/robustness concern, not a by-construction equivalence: the paper never claims to derive the accretion rate from the early light curve, and the high rate is independently motivated by the pre-outburst ZTF brightness and SSS duration. No equation in the paper defines the X-ray-flash classification in terms of the observed g magnitudes, nor vice versa. Thus the derivation chain is not circular.
Assumptions & free parameters
free parameters (8)
- White dwarf mass M_WD =
1.35 solar masses
- Mass accretion rate for WD evolution model =
1e-11 solar masses per year
- Mass accretion rate for disk brightness =
2e-7 solar masses per year
- Inclination angle i =
67 deg preferred, 45 deg and 75 deg examined
- Distance modulus mu_V =
16.3 (d=8.9 kpc, E(B-V)=0.5)
- Disk geometry parameters alpha and beta =
alpha=0.85, beta=0.05 before wind; alpha=1.3, beta=0.05 after wind
- Outburst day t_OB =
HJD 2459377.68
- Companion mass and orbital period =
0.26 solar masses, 0.152921 days
assumptions (5)
- domain assumption The OPAL opacity tables (Iglesias and Rogers 1996) accurately represent the envelope opacity driving the wind and the Fe peak break.
- domain assumption The accretion disk remains undisrupted during the X-ray flash phase and is still present to be irradiated.
- domain assumption Irradiated disk and companion photospheres emit locally as blackbodies, and absorption by optically thin gas between surfaces is negligible.
- domain assumption The nova envelope is nearly hydrostatic during the X-ray flash phase, with no external shock or dense matter near the WD photosphere.
- domain assumption The free-free emission formula (Eq 1) with coefficient A_ff from Kato et al. (2025) applies to the wind ejecta.
invented entities (1)
-
Disk surface flow
Cite this review
Pith. "Pith review of Optical detection of the X-ray flash in the very fast nova V1674 Her: Optical contribution of the irradiated accretion disk." pith.science (2026). https://pith.science/paper/S2LX3Y5I
@misc{pith2026250706493,
  author       = {Pith},
  title        = {Pith review of: Optical detection of the X-ray flash in the very fast nova V1674 Her: Optical contribution of the irradiated accretion disk},
  year         = {2026},
  howpublished = {\url{https://pith.science/paper/S2LX3Y5I}},
  note         = {Machine review of arXiv:2507.06493}
}
abstract
V1674 Her is one of the fastest and brightest novae, characterized by dense optical photometry in the pre-maximum phase, a rise from $g=17$ to 7 mag, in one-fourth of a day. We present a composite theoretical $V$ light curve model of its early rising phase starting from a quiescent brightness of $g=19.2$ mag. Our light curve model consists of a hot and bright white dwarf (WD) and irradiated accretion disk and companion star. We found that the earliest optical detection of ASAS-SN $g$ band brightness of $g=17.0$ at $t=0.014$ day from the onset of thermonuclear runaway can be explained with the irradiated accretion disk and companion star in the X-ray flash phase of a $1.35 ~M_\odot$ WD. This is the first detection in optical of an X-ray flash phase of a nova. Optically thick winds emerge from the WD photosphere at $t=0.04$ day, and optical flux is dominated by free-free emission from optically-thin ejecta just outside the WD photosphere. Our free-free emission model $V$ light curve reasonably reproduces the dense $g$ light curve of Evryscope that spans from $g=14.8$ (at 0.078 day) to $g=7.1$ (at 0.279 day), including a sudden change of slope in the $g$ light curve from slow to rapid rise at $g=14.3$ on day $0.1$. There is no indication of shocking power during the rising phase from $g=14.8$ to 7.1.
Figures


Figures from the paper (5 more)



Reference graph
Works this paper leans on
-
[1]
Bhargava, Y., Dewangan, G. C., Anupama, G.,C., et al. 2024, MNRAS, 528, 28, https://doi.org/10.1093/mnras/stad3870
-
[2]
Drake, J. J., Ness, J.-U., Page, K. L., et al. 2021, ApJL, 922, L42, https://doi.org/10.3847/2041-8213/ac34fd
-
[3]
Evans, P. A., Beardmore, A. P., Page, K. L., et al. 2009, MNRAS, 397, 1177, https://doi.org/10.1111/j.1365-2966.2009.14913.x
arXiv 2009
-
[4]
1966, MNRAS, 132, 317, https://doi.org/10.1093/mnras/132.2.317
Friedjung, M. 1966, MNRAS, 132, 317, https://doi.org/10.1093/mnras/132.2.317
-
[5]
2024, MNRAS, 527, 1405, https://doi.org/10.1093/mnras/stad3295
Dubovsky, P.A. 2024, MNRAS, 527, 1405, https://doi.org/10.1093/mnras/stad3295
-
[6]
2001, ApJ, 558, 323, https://doi.org/10.1086/321601
Hachisu, I., & Kato, M. 2001, ApJ, 558, 323, https://doi.org/10.1086/321601
doi:10.1086/321601 2001
-
[7]
2006, ApJS, 167, 59, https://doi.org/10.1086/508063
Hachisu, I., & Kato, M. 2006, ApJS, 167, 59, https://doi.org/10.1086/508063
doi:10.1086/508063 2006
-
[8]
2022, ApJ, 939, 1, https://doi.org/10.3847/1538-4357/ac9475
Hachisu, I., & Kato, M. 2022, ApJ, 939, 1, https://doi.org/10.3847/1538-4357/ac9475
Show all 24 references
-
[9]
2025, ApJ, 983, 145, https://doi.org/10.3847/1538-4357/adc107
Hachisu, I., & Kato, M. 2025, ApJ, 983, 145, https://doi.org/10.3847/1538-4357/adc107
2025 doi
-
[10]
Hachisu, I., Kato, M., & Walter, F. M. 2025, ApJ, 980, 142, https://doi.org/10.3847/1538-4357/adae08
2025 doi
-
[11]
Hachisu, I., Saio, H., Kato, M., Henze, M., & Shafter, A. W. 2020, ApJ, 902, 91, https://doi.org/10.3847/1538-4357/abb5fa
2020 doi
-
[12]
A., & Rogers, F
Iglesias, C. A., & Rogers, F. J. 1996, ApJ, 464, 943, https://doi.org/10.1086/177381
1996 doi
-
[13]
Kato, M., & Hachisu, I., 1994, ApJ, 437, 802, https://doi.org/10.1086/175041
1994 doi
- [14]
-
[15]
2022a, PASJ, 74, 1005, https://doi.org/10.1093/pasj/psac051
Kato, M., Saio, H., & Hachisu, I. 2022a, PASJ, 74, 1005, https://doi.org/10.1093/pasj/psac051
-
[16]
2022b, ApJL, 935, L15, https://doi.org/10.3847/2041-8213/ac85cl
Kato, M., Saio, H, & Hachisu, I. 2022b, ApJL, 935, L15, https://doi.org/10.3847/2041-8213/ac85cl
-
[17]
2022c, Research notes of the AAS, 6, 258, https://doi.org/10.3847/2515-5172/aca8af K¨ onig, O., Wilms, J., Arcodia, R., et al
Kato, M., Saio, H, & Hachisu, I. 2022c, Research notes of the AAS, 6, 258, https://doi.org/10.3847/2515-5172/aca8af K¨ onig, O., Wilms, J., Arcodia, R., et al. 2022, Nature, 605, 248, https://doi.org/10.1038/s41586-022-04635-y
2022 doi
-
[18]
2022, MNRAS, 517, L97, https://doi.org/10.1093/mnrasl/slac117 Mr´ oz, P., Kr´ ol, K., Szegedi, K., et al
Lin, L, C.-C., Fan, J.-L., Hu, C.-P., Tanaka, J., & Li, K.-L. 2022, MNRAS, 517, L97, https://doi.org/10.1093/mnrasl/slac117 Mr´ oz, P., Kr´ ol, K., Szegedi, K., et al. 2024, ApJL, 977, L37, https://doi.org/10.3847/2041-8213/ad969b
2022 doi
-
[19]
2024, PASJ, 76, 293, https://doi.org/10.1093/pasj/psae010
Muraoka, K., Kojiguchi, N., Ito, J., et al. 2024, PASJ, 76, 293, https://doi.org/10.1093/pasj/psae010
2024 doi
-
[20]
2022, ApJ, 932, 45, https://doi.org/10.103847/1538-4357/ac63be
Orio, M., Gendreau, K., Giese, M., et al. 2022, ApJ, 932, 45, https://doi.org/10.103847/1538-4357/ac63be
2022 doi
-
[21]
2022, ApJL, 940, L56, https://doi.org/10.3847/2041-8213/ac9ebe
Patterson, J., Enenstein, J, de Miguel, E., et al. 2022, ApJL, 940, L56, https://doi.org/10.3847/2041-8213/ac9ebe
2022 doi
-
[22]
M., Metzger, B
Quimby, R. M., Metzger, B. D., Shen, K.J., et al. 2024, ApJ, 977, 17, https://doi.org/10.3847/1538-4357/ad887f
2024 doi
-
[23]
V., Johnson, T.J., Buson, S., et al
Sokolovsky, K. V., Johnson, T.J., Buson, S., et al. 2023, MNRAS, 521,5453, https://doi.org/10.1093/mnras/stad887
2023 doi
-
[24]
E., Banerjee D
Woodward, C. E., Banerjee D. P.K., Geballe, T.R. et al. 2021, ApJL, 922, L10, https://doi.org/10.3847/2041-8213/ac3518
2021 doi
Reviewed August 6, 2026 · model on record in the stance chip above.
Discussion (0). Continue with ORCID to comment.