REVIEW 3 major objections 4 minor 72 references
The Greenhouse Effect in Buried Galactic Nuclei and the Resonant HCN Vibrational Emission
T0 review · 3 major / 4 minor · reviewed 2026-08-14 · deepseek-v4-flash
Pith's one-line read When hydrogen columns in buried galactic nuclei exceed about $10^{25}$ cm$^{-2}$, infrared photons are trapped so efficiently that the inner dust heats strongly and the HCN bending-mode lines become optically thick, explaining observed…
desk verdict A credible quantitative case for greenhouse-driven HCN vibrational emission in buried nuclei, with an honest and accurate statement of the spherical-symmetry limit that should be tested with 3D models. read the letter →
The pith
A machine-rendered reading of the paper's core claim, the machinery that carries it, and where it could break.
The reading
What carries the argument
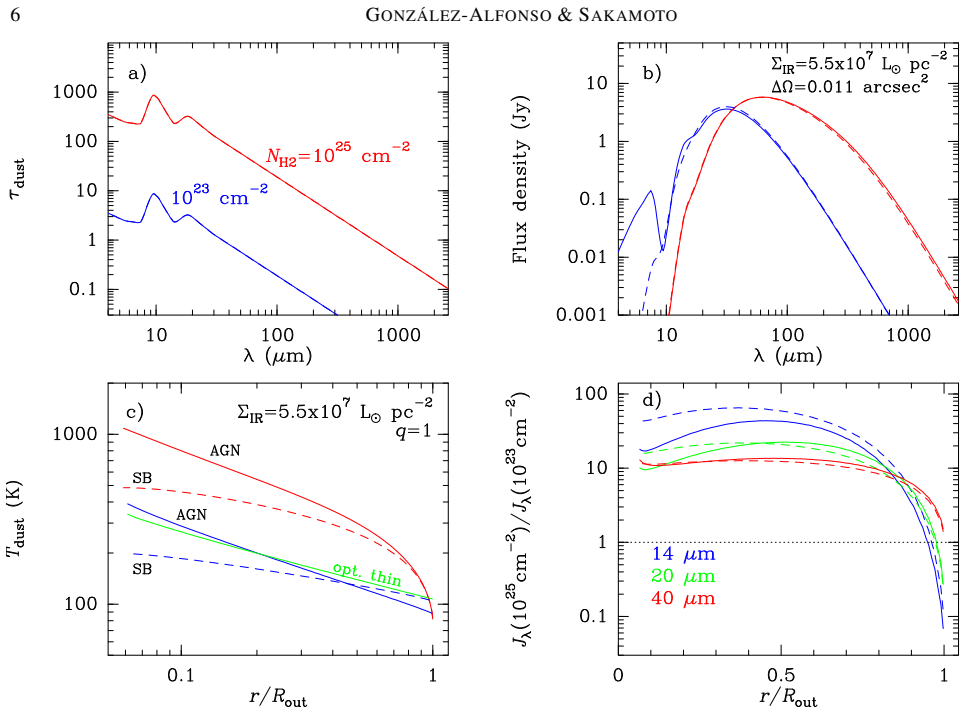
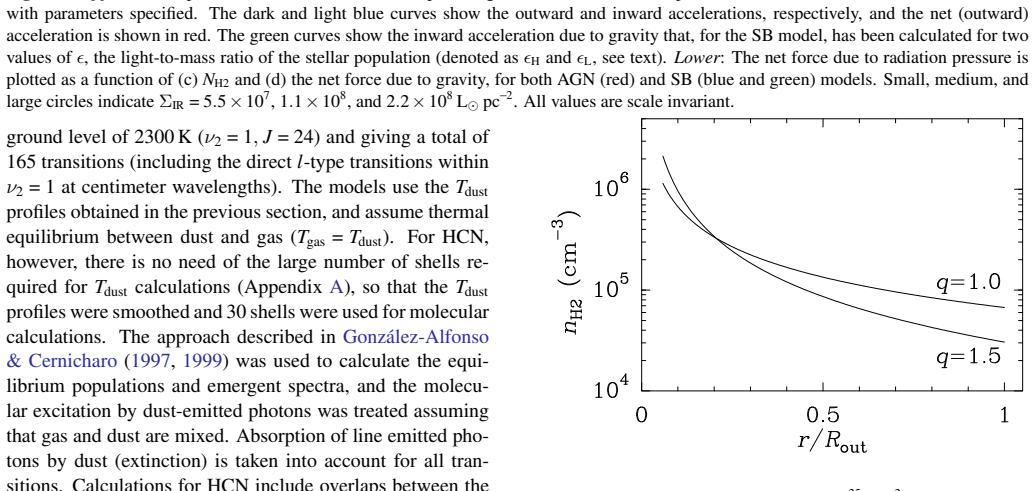
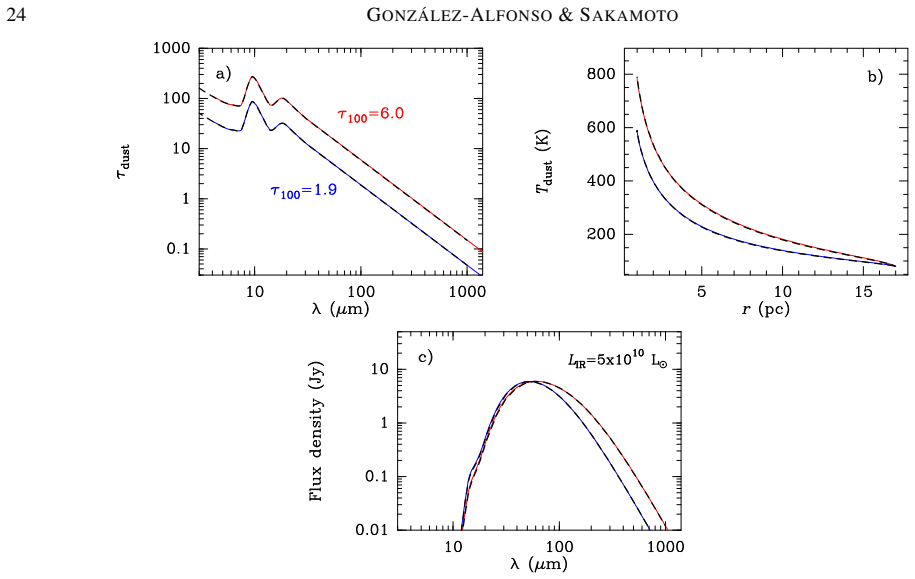
The load-bearing object is the dust-temperature profile obtained from a spherically symmetric continuum radiative-transfer calculation in which radiation is carried by parallel rays through a power-law density cocoon ($\rho\propto r^{-q}$, $q=1$ or 1.5), heating shells by local absorption and re-emission. A compact blackbody at 1300 K represents the AGN case; a distributed energy deposition proportional to the dust mass and density represents the starburst case. The greenhouse effect appears in the equilibrated $T_{\rm dust}(r)$: at high columns, inward (backwarming) fluxes almost cancel outward fluxes, so $\Upsilon_{\rm IR}=4\pi r^2\sigma T_{\rm dust}(r)^4$ is not conserved and the inner shells are far hotter than the optically thin solution. These temperatures are then fed into a model of HCN with 25 rotational levels in the ground vibrational state and up to 48 levels in the $\nu_2=1$ bending state, treating gas and dust as thermally coupled and including line–dust extinction and ro-vibrational overlaps. The single most important relation is that the HCN $\nu_2=1\ f\ J=3-2$ line is in LTE at the local dust temperature wherever the 14 $\mu$m continuum is optically thick, so the emergent line flux is set by the solid angle of the region where $T_{\rm dust}\approx 200$ K.
What would settle it
A spatially resolved map of the HCN $\nu_2=1$ $J=3-2$ line toward a nucleus with $N_{\rm H_2}\approx 10^{25}$ cm$^{-2}$ should show a central dip in line brightness (ring-like morphology), because the saturated line absorbs the bright 1.1 mm continuum; detecting a centrally peaked line instead would contradict the optically thick, greenhouse-driven picture.
Extended reading notes
Core claim
The central claim is that radiative trapping, not a hotter central engine, is what makes buried galactic nuclei appear to have warm interiors. In the models, once $N_{\rm H_2}\gtrsim 10^{25}$ cm$^{-2}$ the optical depth at 20 $\mu$m reaches hundreds, so any photon emitted in the inner shells is absorbed and re-emitted many times before it escapes. This backwarming raises the dust temperature in the inner third of the source to roughly 200–500 K, even when the externally observed spectral energy distribution looks cold, and raises the mean mid-infrared intensity inside the cocoon by more than a factor of ten. At those temperatures and columns, the HCN $\nu_2=1$ state is populated so efficiently that the $J=3-2$ and $4-3$ vibrational lines saturate ($\tau\gtrsim 1$) over a substantial fraction of the source, with flux ratios near the optically thick value $(\nu_{4-3}/\nu_{3-2})^2\approx 1.8$. The same greenhouse that traps the continuum therefore dictates the line luminosity, and the authors calibrate this to match the observed brightnesses in five galaxies with one fiducial abundance and a narrow range of surface brightness.
Load-bearing premise
The models assume smooth spherical symmetry with isotropic column densities and no clumping; the authors acknowledge this may overestimate the dust temperature, because in real systems radiation can escape along low-column sightlines and weaken the greenhouse heating.
Editorial extensions
If this is right
- The HCN $\nu_2=1$ $J=3-2$ and $4-3$ lines should be optically thick in buried galactic nuclei with $N_{\rm H_2}\gtrsim 10^{25}$ cm$^{-2}$ and $\Sigma_{\rm IR}\gtrsim 10^7\ L_\odot$ pc$^{-2}$, with a flux ratio close to 1.8.
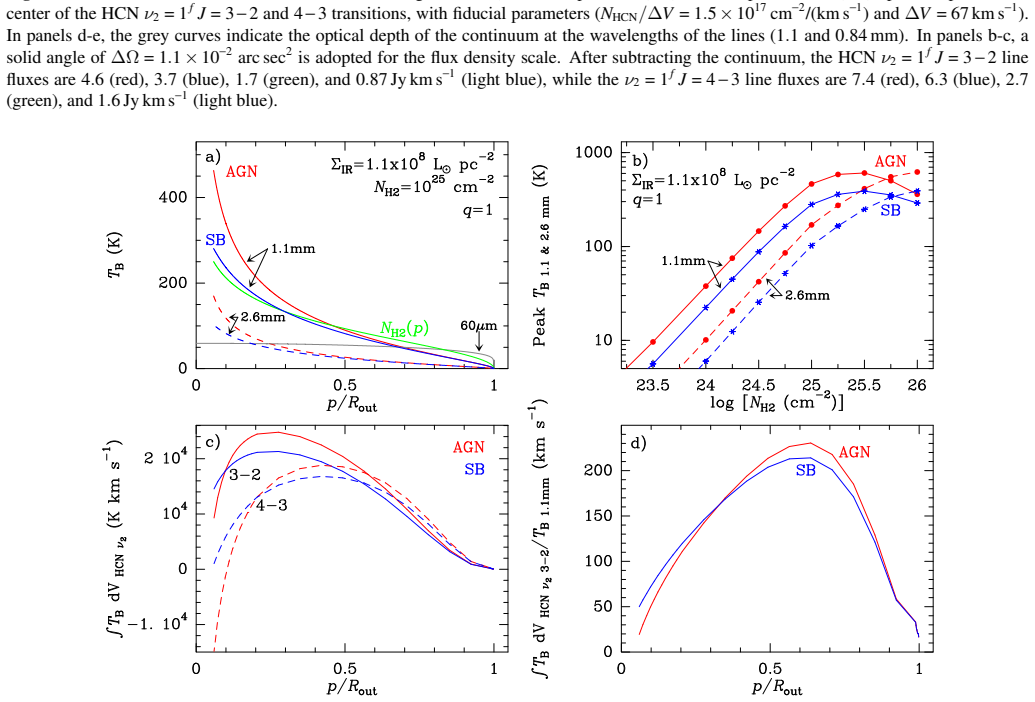
- The same models predict bright, compact (sub)millimeter continuum with brightness temperatures of several hundred Kelvin, especially for AGN-heated cocoons, providing a way to spot buried active nuclei.
- Far-infrared photosphere temperatures of 80–160 K emerge naturally from the greenhouse models, matching the temperatures inferred from high-lying molecular absorption lines in these galaxies.
- A central dip or ring-like morphology of the HCN vibrational line is expected, since the optically thick line absorbs the bright millimeter continuum near the center.
- For the diagnostics considered, AGN and starburst models give nearly identical HCN vibrational line fluxes, so the lines alone cannot distinguish the heating source; millimeter continuum peaks and central mass estimates are needed.
Reading between the lines
- Editorial inference: If real buried nuclei are clumpy or disk-like, the greenhouse heating is likely weaker than the spherical models predict, so the inferred surface brightness values should be read as upper bounds; reproducing the observed lines in a clumpy medium would require even higher columns or luminosities.
- Editorial inference: The same trapped-radiation mechanism should boost vibrational lines of other cyanopolynes, such as HC$_3$N $\nu_7$ and $\nu_6$ and HNC, which the authors list as future work; the ratio of HC$_3$N to HCN vibrational lines could serve as a cleaner thermometer of the inner cocoon.
- Editorial inference: Because the photon-diffusion timescale ($\sim 10^4$ yr) is comparable to AGN flickering timescales, a faded AGN could leave a fossil greenhouse cocoon that still emits HCN vibrational lines and shines at millimeter wavelengths, making a buried AGN resemble a starburst.
- Editorial inference: The predicted steep rise of HCN vibrational luminosity with $\Sigma_{\rm IR}$ and its saturation at high columns can be tested by stacking unresolved galaxies that have measured compact dust masses; sources below a threshold of roughly $10^7\ L_\odot$ pc$^{-2}$ should show much weaker lines.
Signed reviews
Editorial analysis
A structured set of objections, weighed in public.
Referee Report
Summary. This paper presents spherically symmetric radiative-transfer models of buried galactic nuclei (BGNs) with high H2 columns and high luminosity surface densities, for both AGN-like central heating and distributed starburst heating. The authors compute dust temperature profiles and emergent SEDs, and post-process them with an HCN excitation model including the nu2=1 bending state. They find that for NH2 about 10^25 cm^-2 or more, trapping of infrared radiation enhances inner dust temperatures and the mean mid-infrared intensity by more than an order of magnitude, pumping HCN vibrational states so that the nu2=1 J=3-2 and 4-3 lines become optically thick. They use the model grid to interpret observed HCN vibrational fluxes in NGC 4418, Arp 220W/E, Zw 049.057, IC 860, and Mrk 231, inferring Sigma_IR around (0.5-2)e8 Lsun pc^-2 with X_HCN about 1e-6 and luminosities consistent with independent estimates. The paper also makes predictions for line ratios, spatial profile shapes, and millimeter continuum brightness.
Significance. If correct, the paper provides a quantitative physical basis for the bright HCN vibrational emission in buried nuclei: the greenhouse effect of infrared trapping makes the nu2=1 lines a natural luminosity-surface-density diagnostic. The modeling is carefully done and the paper gives credit where due: the continuum code conserves energy to better than 1%, is benchmarked against DUSTY (Appendix A.3), and the temperature profiles are provided as analytic fits (Tables 3-4). The paper also gives falsifiable predictions, including saturated line ratios near 1.8, a central brightness drop or ring morphology as observed in IC 860, and absorption of millimeter continuum by the lines. The main risk is that the core quantitative result is derived for smooth, isotropic, spherical density distributions, an assumption the authors acknowledge may overestimate dust temperatures in real clumpy or disk systems; this affects the derived Sigma_IR calibration. Nonetheless, the paper is a significant advance in modeling BGNs and provides a framework that can be tested against higher-resolution observations.
major comments (3)
- [Section 4 (Discussion) and Section 3.2.2 / Figure 2d] The authors state in Section 4 that the spherical symmetry 'assumes isotropic column densities from the center and no clumpiness' and that this 'oversimplified smoothed density structure may overestimate the dust temperature as compared with real systems.' This caveat bears directly on the central claim: the factor of at least 10 enhancement of the 14 micron mean intensity at NH2=10^25 cm^-2 (Figure 2d) and the resulting optically thick HCN nu2=1 lines are computed for a smooth, isotropic cocoon. In a clumpy or disk-like medium, radiation escapes along low-column sightlines, reducing the mean mid-infrared intensity that pumps nu2=1. Because the calibration in Figure 12 and Table 2 maps observed F_HCN/Delta_Omega to Sigma_IR through exactly this mechanism (equation 5), the inferred Sigma_IR and luminosities are upper limits unless a filling-factor or three-dimensional geometry test is performed. I request a quantitative sensitivity study, for example clumpy or disk models with conservative filling factors, or at minimum an explicit statement that all derived Sigma_IR are upper limits under the smooth-sphere assumption.
- [Section 3.1, Section 3.2.5, Figure 12, Table 2] The source comparison uses fiducial values X_HCN=10^-6 and Delta_V=67 km/s that are themselves partly motivated by previous analyses of the same sources (for example NGC 4418 and Arp 220), and the observed HCN fluxes are then used to infer Sigma_IR. The agreement in Figure 12 is therefore a demonstration of consistency rather than an independent inversion. The degeneracy is substantial: with the saturated-area scaling of equation (5), a factor of about 2 uncertainty in X_HCN, which the authors assign in Section 4, translates into a factor of more than 2 change in the inferred Sigma_IR for the same line flux. The paper should provide a joint constraint plot, such as the allowed Sigma_IR-X_HCN locus per source, or otherwise quantify how the inferred physical parameters depend on the assumed abundance and velocity dispersion.
- [Section 3.2.3 / Figure 11b] The comparison with Arp 220W's 2.6 mm brightness relies on an extrapolation: for NH2 above 10^25 cm^-2 the authors 'simply assumed that the Tdust profile remains the same as for NH2=10^25 cm^-2' and argue that the inferred brightness temperatures are lower limits because Tdust increases with NH2. This monotonic increase is plausible but is not demonstrated at these columns, and the increasing optical depth at 2.6 mm could instead saturate the brightness. A self-consistent radiative-transfer calculation for NH2 around 10^26 cm^-2, or an explicit argument for why the profile is unchanged, is needed to support the favorability claim for an AGN in Arp 220W based on the high 2.6 mm brightness.
minor comments (4)
- [Section 2.1] The phrase 'spectral enery distribution' is a typo and should read 'spectral energy distribution'.
- [Appendix A.1 and Figure 15 caption] The text contains 'an squematic approach' and the Figure 15 caption contains 'opticallt thin'; these should be corrected to 'a schematic approach' and 'optically thin'.
- [References] The reference 'Dekel, & Burkert 2014' is incomplete, lacking a journal or preprint identifier, and the in-text citation 'Förster Schreiber et al. 2003' appears in the reference list with the year 1993; these should be reconciled.
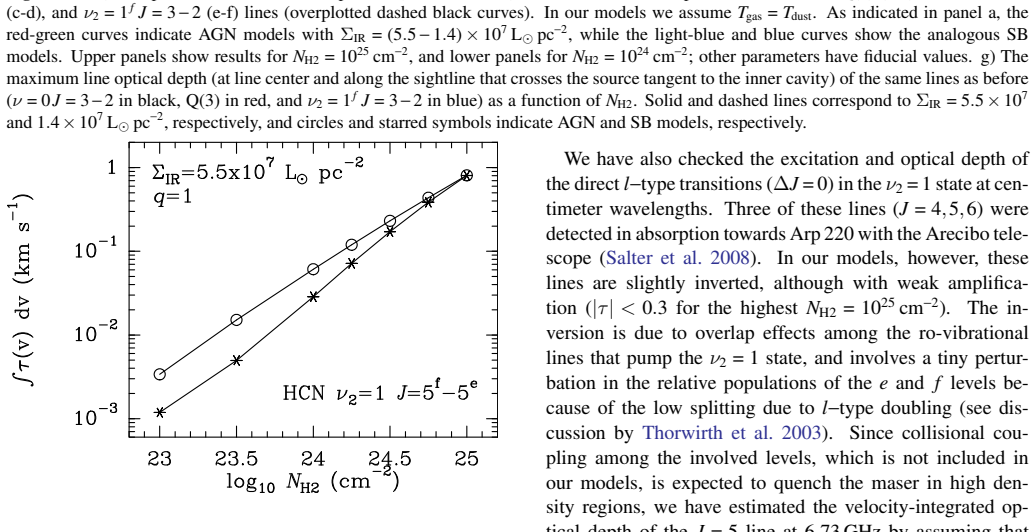
- [Section 3.2.2] Equation (5) is introduced with the remark that it is 'only valid for NHCN = 10^19 cm^-2'; the text should clarify whether this restriction also limits the applicability of the proportionality argument used in Section 3.2.4 for scaling line fluxes to other sources.
Circularity Check
No significant circularity: the greenhouse Tdust enhancement follows from radiative transfer, and the HCN line comparison is a calibration with independently motivated inputs.
full rationale
The paper's central claim—that high H2 columns trap continuum radiation and raise inner dust temperatures—is obtained by solving radiative transfer in spherical shells (Appendix A), with the code benchmarked against the independent DUSTY code (Fig. 16). The greenhouse effect and the factor >10 enhancement of mid-IR intensity are outputs of that calculation, not inputs taken from the HCN observations. The HCN vibrational line model then uses the computed Tdust profile together with X_HCN approximately 1e-6 and Delta V = 67 km/s, values adopted from prior far-IR absorption and 14 micron band analyses (Gonzalez-Alfonso et al. 2012; Lahuis et al. 2007), and predicts line fluxes, optical depths, and spatial profiles. The observed line fluxes are used in Fig. 12 to infer Sigma_IR and hence source luminosities, which the authors explicitly describe as a calibration; comparing those inferred luminosities with independent estimates is a consistency check rather than a circular derivation. Self-citations to the authors' earlier radiative-transfer and abundance work are not load-bearing in a circular sense because the method is described in the appendix and benchmarked, and the abundance inputs are independent of the greenhouse-effect result. The acknowledged spherical-symmetry and smooth-density limitation (Section 4) weakens applicability to clumpy or disk-like geometries but does not make the derivation circular. No step reduces by construction to its own inputs.
Assumptions & free parameters
free parameters (9)
- Sigma_IR =
(0.55-1.1)e8 Lsun/pc^2 fiducial; 0.14-2.2e8 explored; per-source inferred in Table 2
- NH2 =
1e25 cm^-2 fiducial; 1e23-1e25 explored
- q =
1.0 fiducial, 1.5 explored
- Rout/Rint =
17
- X_HCN/Delta V =
1.5e-8 (km/s)^-1
- Delta V =
67 km/s
- Delta Omega =
1.1e-2 arcsec^2 fiducial; 0.008-0.15 arcsec^2 for sources
- Dust opacity curve choice =
red curve fiducial (beta=1.6), black curve alternative (beta=1.85)
- Heating source type =
AGN or SB
assumptions (7)
- domain assumption Spherical symmetry with a smooth, non-clumpy density distribution
- domain assumption Thermal equilibrium between gas and dust, Tgas = Tdust
- domain assumption Dust locally absorbs heating radiation and re-emits in the infrared; scattering is neglected
- domain assumption No velocity gradients in the HCN line radiative transfer
- domain assumption Gas-to-dust mass ratio of 100 and adopted dust absorption curves
- domain assumption Uniform HCN abundance across the source
- domain assumption AGN central heating source is a 1300 K blackbody
Cite this review
Pith. "Pith review of The Greenhouse Effect in Buried Galactic Nuclei and the Resonant HCN Vibrational Emission." pith.science (2026). https://pith.science/paper/S3M6BCWM
@misc{pith2026190804058,
  author       = {Pith},
  title        = {Pith review of: The Greenhouse Effect in Buried Galactic Nuclei and the Resonant HCN Vibrational Emission},
  year         = {2026},
  howpublished = {\url{https://pith.science/paper/S3M6BCWM}},
  note         = {Machine review of arXiv:1908.04058}
}
abstract
Recent interferometric observations have shown bright HCN emission from the nu2=1 vibrational state arising in buried nuclear regions of galaxies, indicating an efficient pumping of the nu2=1 state through absorption of 14 $\mu$m continuum photons. We have modeled the continuum and HCN vibrational line emission in these regions, characterized by high column densities of dust and high luminosities, with a spherically symmetric approach, simulating both a central heating source (AGN) and a compact nuclear starburst (SB). We find that when the H2 columns become very high, N_{H2}>~10^{25} cm-2, trapping of continuum photons within the nuclear region dramatically enhances the dust temperature (Tdust) in the inner regions, even though the predicted spectral energy distribution as seen from outside becomes relatively cold. The models thus predict bright continuum at millimeter wavelengths for luminosity surface brightness (averaged over the model source) of ~10^{8} Lsun pc^{-2}. This {\it greenhouse} effect significantly enhances the mean mid-infrared intensity within the dusty volume, populating the nu2=1 state to the extent that the HCN vibrational lines become optically thick. AGN models yield higher Tdust in the inner regions and higher peak (sub)millimeter continuum brightness than SB models, but similar HCN vibrational J=3-2 and 4-3 emission owing to both optical depth effects and a moderate impact of high \tdust\ on these low-J lines. The observed HCN vibrational emission in several galaxies can be accounted for with a HCN abundance of ~10^{-6} (relative to H2) and luminosity surface brightness in the range (0.5-2)x10^{8}$ Lsun pc^{-2}, predicting a far-infrared photosphere with Tdust}~80-150 K --in agreement with the values inferred from far-infrared molecular absorption.
Figures


Figures from the paper (17 more)








Reference graph
Works this paper leans on
-
[1]
thebibliography [1] 20pt to REFERENCES 6pt =0pt 10pt plus 3pt =0pt =0pt =1pt plus 1pt =0pt =0pt -12pt =13pt plus 1pt =20pt =13pt plus 1pt \@M =10000 =-1.0em =0pt =0pt 0pt =0pt =1.0em @enumiv\@empty 10000 10000 `\.\@m \@noitemerr \@latex@warning Empty `thebibliography' environment \@ifnextchar \@reference \@latexerr Missing key on reference command Each re...
work page 2016
-
[2]
Aalto, S., Garc\' a-Burillo, S., Muller, S., et al. 2012, A&A, 537, 44
work page 2012
-
[3]
Aalto, S., Garc\' a-Burillo, S., Muller, S., et al. 2015a, A&A, 574, A85
-
[4]
Aalto, S., Mart\' n, S., Costagliola, F., et al. 2015b, A&A, 584, A42
-
[5]
Aalto, S., et al. in prep. 2019
work page 2019
- [6]
- [7]
-
[8]
Cesaroni, R., Hofner, P., Araya, E., & Kurtz, S. 2010, A&A, 509, A50
work page 2010
Show all 72 references
-
[9]
2017, MNRAS, 466, L103
Chang, Y.Y., Le Floc'h, E., Juneau, S., et al. 2017, MNRAS, 466, L103
2017
-
[10]
2010, A&A, 515, A71
Costagliola, F., & Aalto, S. 2010, A&A, 515, A71
2010
-
[11]
2013, 556, A66
Costagliola, F., Aalto, S., Sakamoto, K.; Mart\' n, S., Beswick, R., Muller, S., & Kl\"ockner, H.-R. 2013, 556, A66
2013
-
[12]
Dekel, & Burkert 2014
2014
-
[13]
D., van Dishoeck, E
Doty, S. D., van Dishoeck, E. F., & Tan, J. C. 2006, A&A, 454, L5
2006
-
[14]
Downes, D., & Solomon, P. M. 1998, ApJ, 507, 615
1998
-
[15]
2003, Annu
Draine, B.T. 2003, Annu. Rev. Astr. Astrophys., 41, 241
2003
-
[16]
2010, MNRAS, 406, 2488
Dumouchel, F., Faure, A., & Lique, F. 2010, MNRAS, 406, 2488
2010
-
[17]
P., Fischer, J., Veilleux, S., Mel\'endez, M., Farrah, D., & Smith, H
Falstad, N., Gonz\'alez-Alfonso, E., Aalto, S., van der Werf, P. P., Fischer, J., Veilleux, S., Mel\'endez, M., Farrah, D., & Smith, H. A. 2015, A&A, 580, A52
2015
-
[18]
Falstad, N., Gonz\'alez-Alfonso, E., Aalto, S., & Fischer, J., 2017, A&A, 597, A105
2017
-
[19]
G., et al
Falstad, N., Aalto, S., Mangum, J. G., et al. 2018, A&A, 609, A75
2018
-
[20]
2019, A&A, in press
Falstad, N., Hallqvist, F., Aalto, S., et al. 2019, A&A, in press
2019
-
[21]
& Quataert, E
Faucher-Gigu\`ere, C.-A. & Quataert, E. 2012, MNRAS, 425, 605
2012
-
[22]
& Merritt, D
Ferrarese, F. & Merritt, D
-
[23]
M., Genzel, R., Lutz, D., & Sternberg, A
F\"orster Schreiber, N. M., Genzel, R., Lutz, D., & Sternberg, A. 1993, ApJ, 599, 193
1993
-
[24]
Gebhardt, K., Bender, R., Bower, G.,
-
[25]
2015, A&A, 580, A35
Garc\' a-Burillo, S., Combes, F., Usero, A., et al. 2015, A&A, 580, A35
2015
-
[26]
1997, A&A, 322, 938
Gonz\'alez-Alfonso, E., & Cernicharo, J. 1997, A&A, 322, 938
1997
-
[27]
1999, ApJ, 525, 845
Gonz\'alez-Alfonso, E., & Cernicharo, J. 1999, ApJ, 525, 845
1999
-
[28]
A., Fischer, J., & Cernicharo, J
Gonz\'alez-Alfonso, E., Smith, H. A., Fischer, J., & Cernicharo, J. 2004, ApJ, 613, 247
2004
-
[29]
2012, A&A, 541, A4
Gonz\'alez-Alfonso, E., Fischer, J., Graci\'a-Carpio, J., et al. 2012, A&A, 541, A4
2012
-
[30]
2013, A&A, 550, A25
Gonz\'alez-Alfonso, E., Fischer, J., Bruderer, S., et al. 2013, A&A, 550, A25
2013
-
[31]
2014, A&A, 567, A91
Gonz\'alez-Alfonso, E., Fischer, Aalto, S., & Falstad, N. 2014, A&A, 567, A91
2014
-
[32]
2014b, A&A, 561, A27
Gonz\'alez-Alfonso, E., Fischer, J., Graci\'a-Carpio, J., et al. 2014b, A&A, 561, A27
-
[33]
2015, ApJ, 800, 69
Gonz\'alez-Alfonso, E., Fischer, J., Sturm, E, et al. 2015, ApJ, 800, 69
2015
-
[34]
Gonz\'alez-Alfonso, E., Fischer, J., Spoon, H. W. W., et al. 2017, , 836, 11
2017
-
[35]
2010, ApJ, 721, 1570
Harada, N., Herbst, E., & Wakelam, V. 2010, ApJ, 721, 1570
2010
-
[36]
F., Hernquist, L., Cox, T
Hopkins, P. F., Hernquist, L., Cox, T. J., & Kere\^s, D. 2008, ApJS, 175, 356
2008
-
[37]
2019, ApJ, 870, 75
Ichikawa, K., Ueda, J., Bae, H.-J., Kawamuro, T., Matsuoka, K., Toba, Y., & Shidatsu, M. 2019, ApJ, 870, 75
2019
-
[38]
2016a, AJ, 152, 218
Imanishi, M., Nakanishi, K., & Izumi, T. 2016a, AJ, 152, 218
-
[39]
2016b, ApJ, 825, 44
Imanishi, M., Nakanishi, K., & Izumi, T. 2016b, ApJ, 825, 44
-
[40]
1997, MNRAS, 287, 799
Ivezi\'c, \^Z., & Elitzur, M. 1997, MNRAS, 287, 799
1997
-
[41]
1999, MNRAS, 303, 864
Ivezi\'c, \^Z., & Elitzur, M. 1999, MNRAS, 303, 864
1999
-
[42]
Lahuis, F., Spoon, H. W. W., Tielens, A. G. G. M., et al. 2007, ApJ, 659, 296
2007
-
[43]
D., et al
Lusso, E., Comastri, A., Simmons, B. D., et al. 2012, MNRAS, 425, 623
2012
-
[44]
2016, A&A, 590, A25
Mart\' n, S., Aalto, S., Sakamoto, K., et al. 2016, A&A, 590, A25
2016
-
[45]
R., Colangeli, L., Palumbo, P., Rotundi, A., & Bussoletti, E
Mennella, V., Brucato, J. R., Colangeli, L., Palumbo, P., Rotundi, A., & Bussoletti, E. 1998, ApJ, 496, 1058
1998
-
[46]
Nomura, H., & Millar, T. J. 2004, A&A, 414, 409
2004
-
[47]
Planck Collaboration, 2011, A&A, 536, A25
2011
-
[48]
J., & Faucher-Gigu\`ere, C.-A
Richings, A. J., & Faucher-Gigu\`ere, C.-A. 2017, MNRAS
2017
-
[49]
2004, ASSL, 308, 187
Risaliti, G., & Elvis, M. 2004, ASSL, 308, 187
2004
-
[50]
L., Riedinger, J
Pilbratt, G. L., Riedinger, J. R.,
-
[51]
Poglitsch, A., Waelkens, C., Geis,
-
[52]
M., G\"usten, R., & Bisschop, S
Rolffs, R., Schilke, P., Wyrowski, F., Menten, K. M., G\"usten, R., & Bisschop, S. E. 2011a, A&A, 527, A68
-
[53]
M., Thorwirth, S., & Belloche, A
Rolffs, R., Schilke, P., Wyrowski, F., Dullemond, C., Menten, K. M., Thorwirth, S., & Belloche, A. 2011b, A&A, 529, A76
-
[54]
2011c, A&A, 536, A33
Rolffs, R., Schilke, P., Zhang, Q., & Zapata, L. 2011c, A&A, 536, A33
-
[55]
F., & Quataert, E
Roth, N., Kasen, D., Hopkins, P. F., & Quataert, E. 2012, ApJ, 759, 36
2012
-
[56]
Phillips, P
Rowan-Robinson, M., 1982, in ``Submillimeter Astronomy'', eds. Phillips, P. & Beckman, J. Cambridge Univ. Press, pg. 47
1982
-
[57]
C., et al
Sakamoto, K., Wang, J., Wiedner, M. C., et al. 2008, ApJ, 684, 957
2008
-
[58]
J., et al
Sakamoto, K., Aalto, S., Wilner, D. J., et al. 2009, ApJ, 700, L104
2009
-
[59]
S., Wiedner, M
Sakamoto, K., Aalto, S., Evans, A. S., Wiedner, M. C., & Wilner, D. J. 2010, ApJ, 725, L228
2010
-
[60]
C., & Wilner, D
Sakamoto, K., Aalto, S., Costagliola, F., Mart\' n, S., Ohyama, Y., Wiedner, M. C., & Wilner, D. J. 2013, ApJ, 764, 42
2013
-
[61]
2017, ApJ, 849, 14
Sakamoto, K., Aalto, S., Barcos-Mu\ noz, L., et al. 2017, ApJ, 849, 14
2017
-
[62]
J., Ghosh, T., Catinella, B., Lebron, M., Lerner, M
Salter, C. J., Ghosh, T., Catinella, B., Lebron, M., Lerner, M. S., Minchin, R., & Momjian, E. 2008, AJ, 136, 389
2008
-
[63]
Salpeter, E. E. 1955, ApJ, 121, 161
1955
-
[64]
Schawinski, K., Koss, M., Berney, S., & Sartori, L. F. 2015, MNRAS, 451, 2517
2015
-
[65]
S., & Bryant, P
Scoville, N., Yun, M. S., & Bryant, P. M. 1997, ApJ, 484, 702
1997
-
[66]
2003, Journal of Korean Astronomical Society, 36, 167
Scoville, N. 2003, Journal of Korean Astronomical Society, 36, 167
2003
-
[67]
2017, ApJ, 836, 66
Scoville, N., Murchikova, L., Walter, F., et al. 2017, ApJ, 836, 66
2017
-
[68]
T., Neugebauer, G., Matthews, K., et al
Soifer, B. T., Neugebauer, G., Matthews, K., et al. 2000, AJ, 119, 509
2000
-
[69]
unken, S., M\
Thorwirth, S., Wyrowski, F., Schilke, P., Menten, K. M., Br\"unken, S., M\"uller, H. S. P., & Winnewisser, G. ApJ, 586, 338
-
[70]
E., Mart\' -Vidal, I., Aalto, S., Beswick, R., Costagliola, F., & Kl\"ockner, H.-R
Varenius, E., Conway, J. E., Mart\' -Vidal, I., Aalto, S., Beswick, R., Costagliola, F., & Kl\"ockner, H.-R. 2014, A&A, 566, A15
2014
-
[71]
J., De Pree, C
Wilner, D. J., De Pree, C. G., Welch, W. J., & Goss, W. M. 2001, ApJ, 550, L81
2001
-
[72]
D., Rangwala, N., Glenn, J., Maloney, P
Wilson, C. D., Rangwala, N., Glenn, J., Maloney, P. R., Spinoglio, L., & Pereira-Santaella, M. 2014, ApJ, 789, L36
2014
Reviewed August 14, 2026 · model on record in the stance chip above.
Discussion (0). Continue with ORCID to comment.