REVIEW 3 major objections 4 minor 86 references
An ALMA Study of Molecular Complexity in the Hot Core G336.99-00.03 MM1
T0 review · 3 major / 4 minor · reviewed 2026-08-07 · deepseek-v4-flash
Pith's one-line read An ALMA 3 mm line survey identifies the compact source G336.99-00.03 MM1 as a hot core with 19 molecular species, 8 isotopologues, and vibrationally/torsionally excited states, whose LTE-derived abundances largely match slow warm-up…
desk verdict Useful first systematic inventory of G336.99 MM1; the source-size assumption is the main weak point, but the core claims hold up. read the letter →
The pith
A machine-rendered reading of the paper's core claim, the machinery that carries it, and where it could break.
The reading
What carries the argument
The load-bearing analysis is local thermodynamic equilibrium (LTE) spectral synthesis: observed line profiles are fit with synthetic spectra produced by the LINEDB and WEEDS routines in CLASS using spectroscopic parameters from the CDMS and JPL databases. Five parameters are adjusted—source size, line width, velocity offset, rotational temperature, and column density—with source size fixed to the deconvolved 3 mm continuum size and excitation temperature fixed to 146 K for species detected in only one or two lines. This machinery turns line counts and intensities into rotational temperatures, column densities, isotopic ratios, and abundances, which are then compared with literature abundances and with slow, medium, and fast warm-up chemical model predictions.
What would settle it
Resolve the HC$_3$N and CH$_3$OH line-emitting regions with sub-arcsecond ALMA observations and compare their measured sizes with the continuum source: if the true emitting regions are significantly more compact than the deconvolved 3 mm size, then the opacity-corrected $^{12}$C/$^{13}$C and $^{16}$O/$^{18}$O ratios should rise toward the Galactic gradient values, confirming the paper's proposed source-size and optical-depth explanation rather than real isotopic anomalies.
Extended reading notes
Core claim
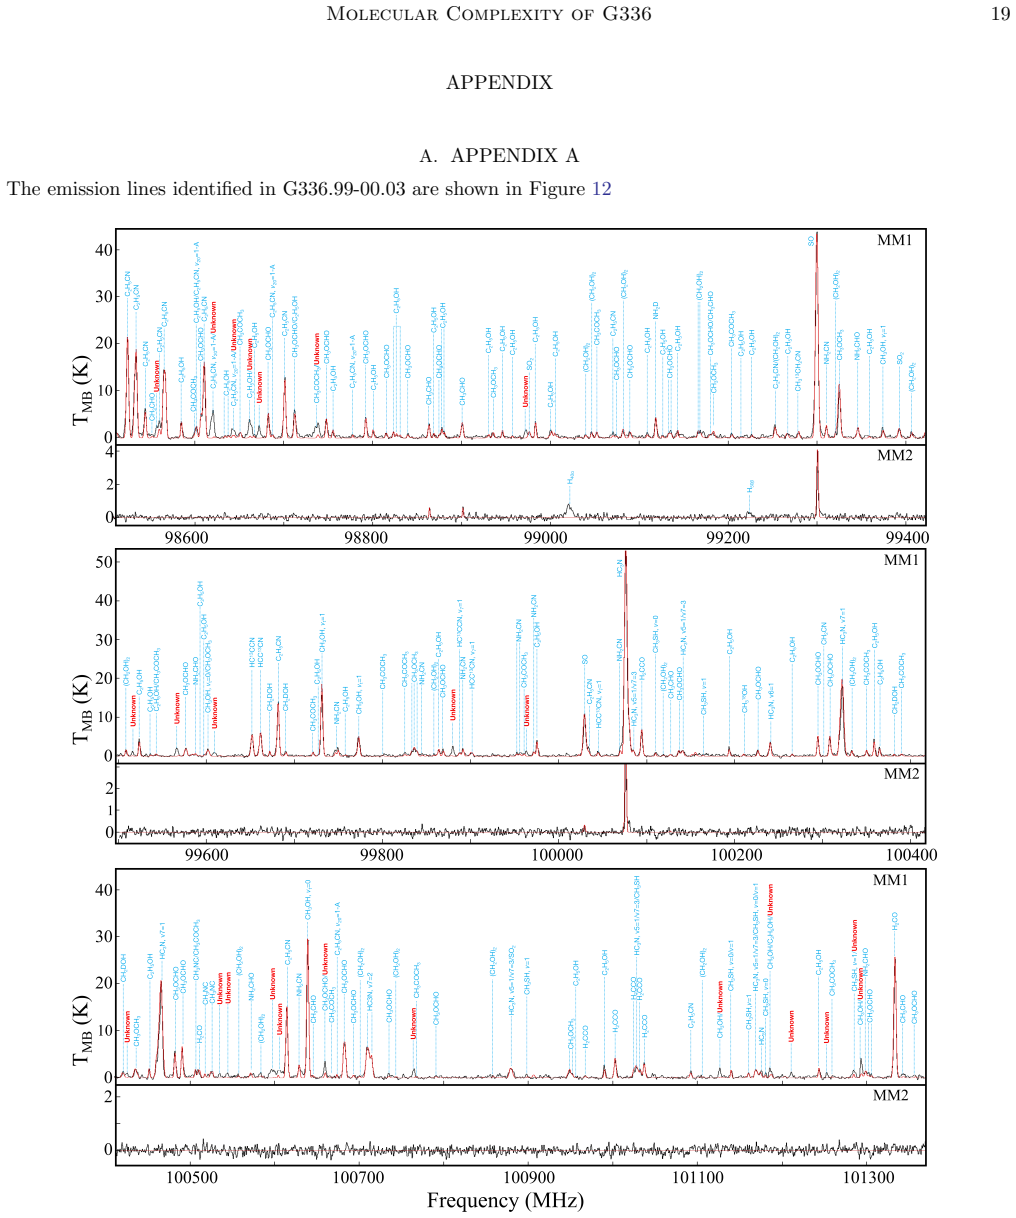
On the paper's own terms, the central claim is that G336.99-00.03 MM1 is a hot core whose 3 mm line spectrum is rich enough to support an LTE molecular inventory: 19 distinct species, 8 isotopologues, vibrationally excited HC$_3$N and C$_2$H$_5$CN, and torsionally excited CH$_3$OH, with rotational temperatures of 73 to 249 K, column densities of $4.42\times10^{14}$ to $4.00\times10^{18}$ cm$^{-2}$, and an H$_2$ column density of $(1.79\pm0.36)\times10^{24}$ cm$^{-2}$. The sibling source MM2 lacks this complexity, showing only CS, SO, SO$_2$, HC$_3$N, CH$_3$OH, and CH$_3$CHO plus radio recombination lines, which places it in the HII-region stage. The paper also claims that the derived $^{12}$C/$^{13}$C ratios (16.0 to 29.2), $^{16}$O/$^{18}$O (47.7), and $^{32}$S/$^{34}$S (19.2) mostly follow Galactic gradient relations, and that MM1's abundances match three-phase warm-up chemistry models, especially the slow warm-up timescale, within about an order of magnitude for most species.
Load-bearing premise
The derived abundances and isotope ratios rest on the assumption that each molecule emits from the same area as the deconvolved 3 mm continuum source and that the lines are in LTE; if the emitting regions are more compact or not optically thin, the numbers shift, with a larger assumed source size moving the low $^{12}$C/$^{13}$C and $^{16}$O/$^{18}$O ratios upward toward Galactic expectations.
Editorial extensions
If this is right
- MM1 is established as a chemically rich hot core and MM2 as an HII region, providing two clear evolutionary stages within a single high-mass star-forming region.
- The LTE-derived molecular inventory and parameters can serve as a benchmark for astrochemical models of complex organic molecules in hot cores.
- Slow warm-up timescale models reproduce most observed abundances, while CH$_3$NC, several sulfur species, HC$_3$N, and (CH$_2$OH)$_2$ stand out as discrepancies that future models will need to explain.
- The low $^{12}$C/$^{13}$C and $^{16}$O/$^{18}$O ratios derived from HC$_3$N and CH$_3$OH are likely affected by optical depth and source size, so higher-resolution multi-transition observations would refine or overturn the reported isotope ratios.
- Correlations among O-bearing molecule abundances weaken when normalized to CH$_3$OH instead of H$_2$, cautioning against strong chemical-link claims based on H$_2$-normalized abundances alone.
Reading between the lines
- If the low $^{12}$C/$^{13}$C and $^{16}$O/$^{18}$O ratios are purely opacity and source-size artifacts, then the true isotopic ratios of this source at a galactocentric distance of 3.3 kpc may fall squarely on the Galactic gradient; a single sub-arcsecond map of HC$_3$N and CH$_3$OH isotopologue emission could test this directly.
- The strong H$_2$-normalized correlations among O-bearing COMs that weaken under CH$_3$OH normalization may reflect common dependence on total gas column density rather than shared chemistry; a larger sample with independent H$_2$ measurements would settle the issue.
- The severe model deficiency for CH$_3$NC hints at missing gas-phase or grain-surface formation and destruction routes, and searching for CH$_3$NC in other slow-warm-up hot cores would show whether this discrepancy is unique to MM1.
- Applying the same LTE inventory method to higher-frequency ALMA data of this region could reveal whether the chemical difference between MM1 and MM2 is a sharp evolutionary transition or a gradual gradient in molecular destruction.
Signed reviews
Editorial analysis
A structured set of objections, weighed in public.
Referee Report
Summary. This paper presents an ALMA Band 3 line survey (97.5–101.4 GHz) of the high-mass star-forming region G336.99-00.03, focusing on two millimeter continuum sources, MM1 and MM2. The authors identify 19 molecular species and 8 isotopologues in MM1 from over 300 transitions, and 5 species in MM2 from 7 transitions. Under an LTE assumption, they derive rotational temperatures (73–249 K), column densities (4.42e14–4.00e18 cm^-2), and molecular abundances relative to H2 and CH3OH. Isotopic ratios 12C/13C, 16O/18O, and 32S/34S are reported and compared with Galactic gradient relations. The abundances are compared with those of other hot cores and with the three-phase warm-up models of Garrod et al. (2022), leading to the conclusion that MM1 is a hot core, MM2 is an HII region, and the slow warm-up model best reproduces the observed abundances.
Significance. If the quantitative results hold, the paper provides a valuable addition to the limited sample of detailed hot-core molecular inventories, and it supplies isotopic ratios at a Galactocentric distance of 3.3 kpc that can be compared with Galactic chemical evolution trends. The strength of the work is the careful line identification over a broad frequency range, the use of multiple transitions for many species, and the authors' explicit statements of caveats concerning optical depth, fixed excitation temperatures, and the speculative nature of formation pathways. The paper is an observational inventory rather than a derivation, so circularity is not a concern; self-citations to the ATOMS and QUARKS surveys provide context rather than supporting the central result. The main limitations are systematic uncertainties in the LTE modeling that are acknowledged but not quantified.
major comments (3)
- [Sect. 3, Table 5] The adopted source size for all LTE fits is the deconvolved 3 mm continuum size (Table 1), but the line-emitting regions of HC3N and CH3OH are measured to be more compact (1.69'' and 1.61''; Sect. 4.3 and Table 5). Because N_T, X_H2, and isotope ratios all scale with the assumed source solid angle, the quoted values in Tables 3 and 4 carry a source-size systematic that is not propagated into any error bar. For species with emission more compact than the continuum, the shifts can be comparable to or larger than the reported statistical uncertainties. I request a quantitative treatment: either refit HC3N and CH3OH with the measured line sizes and recompute the isotope ratios, or quote abundance and ratio ranges from a plausible compactness range, or explicitly present the affected values as lower/upper limits.
- [Sect. 4.2, Table 3] For molecules with only one or two detected transitions, Trot is fixed to 146 K (e.g., HC3N, HC13CCN, HCC13CN, 13CH3CH2CN, CS, 34SO). The derived column densities and the isotope ratios built from these species (Table 4) therefore depend directly on this assumed temperature, but no uncertainty from the fixed Trot is propagated into the quoted errors. This is particularly relevant for the 12C/13C values from HC3N and 13CH3CH2CN, where the authors themselves caution that only one clean transition was used. The paper should either provide a sensitivity estimate (e.g., column density and ratio changes for Trot = 100–200 K) or list these values with a caveat that they are conditional on the fixed temperature.
- [Sect. 4.3, Table 5] The isotope-ratio results are derived from lines with non-negligible optical depths: HC3N 11–10 has tau = 1.05, and the CH3OH lines used for the oxygen ratio have tau = 0.54–0.61. The paper notes this in the text and states that the effect is small, but it still reports 12C/13C = 16.0–17.1 for HC3N and 16O/18O = 47.7 as the headline numbers. Because these values deviate substantially from the Galactic gradient predictions (Eqs. 2 and 4) and the opacity bias acts in the direction of lowering the ratios, the quoted numbers should either be corrected using the measured opacities or be presented explicitly as lower limits where the opacity correction is not applied.
minor comments (4)
- [Sect. 4.4] The text refers to 'G336.99-00.06' when describing the compactness of molecular emission; this should read G336.99-00.03.
- [Fig. 9 caption] The caption labels the source as G336.999-00.03; there is an extra digit in the declination component.
- [Abstract and Sect. 6] The abstract states 'strong agreement' with chemical models, while Sect. 5.3.2 and Fig. 11 show that CH3NC exceeds the modeled abundance by more than two orders of magnitude and several S-bearing species are not reproduced. The wording should be softened to 'partial agreement' for consistency with the presented results.
- [Table 4 and Fig. 8] The single-transition 32S/34S value from SO/34SO is presented with a small statistical error but is subject to the same fixed-Trot and source-size systematics as the carbon and oxygen ratios; the figure legend does not distinguish which ratios are based on one transition, so adding a marker or note would help the reader.
Circularity Check
No significant circularity: the molecular inventory, LTE column densities, and isotope ratios are derived directly from observed line data and compared against external benchmarks and models.
full rationale
This is an observational LTE excitation analysis, not a derivation whose conclusion is fed back into its inputs. Rotational temperatures and column densities are obtained by fitting observed line intensities with fixed external spectroscopic data from CDMS/JPL under stated assumptions (LTE, source size equal to the deconvolved 3 mm continuum size, and Trot fixed to 146 K for species with one or two lines). These assumptions are external inputs, not definitions of the target result. The isotope ratios are ratios of fitted column densities, not fitted parameters relabeled as predictions; the paper explicitly flags the optical-depth and source-size caveats that affect them. The abundance comparison with Garrod et al. (2022) is external, as the models were not tuned to MM1 abundances, and the model comparison is performed using CH3OH-normalized abundances, so the uncertain NH2 normalization is not load-bearing for that comparison. Self-citations to the ATOMS and QUARKS surveys (Liu et al. 2020, 2024b) appear only for data provenance, context, and a galactocentric-distance reference used in the Galactic-gradient comparison; the ALMA data are public and the quantitative claims are independently testable. Formation-pathway suggestions are explicitly labeled speculative ('we emphasize that these proposed mechanisms remain speculative'). No equation in the paper reduces a claimed prediction to a fitted input, and no load-bearing argument rests on an unverified self-citation. The main weaknesses (source-size assumption, fixed 146 K for sparse-line species, opacity effects on isotope ratios) are systematic-accuracy risks, which the authors partially acknowledge, not circularity.
Assumptions & free parameters
free parameters (2)
- Excitation temperature for molecules with fewer than 3 clean transitions =
146 K
- Dust temperature for the H2 column density =
146 K (assumed equal to the average rotational temperature)
assumptions (5)
- domain assumption LTE holds for all fitted molecular emission
- domain assumption Molecular emitting regions have the same size as the deconvolved 3 mm continuum sources
- domain assumption Dust emission is optically thin with Rgd=100, mu=2.8, kappa_nu=0.2 cm2/g, and Tdust equal to the average rotational temperature
- domain assumption Spectroscopic parameters from CDMS and JPL are accurate enough for line identification
- domain assumption Galactocentric gradient relations of Yan et al. (2019, 2023) and Wilson (1999) are valid at DGC=3.3 kpc
Cite this review
Pith. "Pith review of An ALMA Study of Molecular Complexity in the Hot Core G336.99-00.03 MM1." pith.science (2026). https://pith.science/paper/S43QYRI7
@misc{pith2026250517403,
  author       = {Pith},
  title        = {Pith review of: An ALMA Study of Molecular Complexity in the Hot Core G336.99-00.03 MM1},
  year         = {2026},
  howpublished = {\url{https://pith.science/paper/S43QYRI7}},
  note         = {Machine review of arXiv:2505.17403}
}
abstract
High-mass star formation involves complex processes, with the hot core phase playing a crucial role in chemical enrichment and the formation of complex organic molecules. However, molecular inventories in hot cores remain limited. Using data from the ALMA Three-millimeter Observations of Massive Star-forming regions survey (ATOMS), the molecular composition and evolutionary stages of two distinct millimeter continuum sources in the high-mass star forming region G336.99-00.03 have been characterized. MM1, with 19 distinct molecular species detected, along with 8 isotopologues and several vibrationally/torsionally excited states, has been identified as a hot core. MM2 with only 5 species identified, was defined as a HII region. Isotopic ratios in MM1 were derived, with $^{12}$C/$^{13}$C ranging from 16.0 to 29.2, $^{16}$O/$^{18}$O at 47.7, and $^{32}$S/$^{34}$S at 19.2. Molecular abundances in MM1 show strong agreement with other sources and three-phase warm-up chemical models within an order of magnitude for most species. Formation pathways of key molecules were explored, revealing chemical links and reaction networks. This study provides a detailed molecular inventory of two millimeter continuum sources, shedding light on the chemical diversity and evolutionary processes in high-mass star-forming regions. The derived molecular parameters and isotopic ratios offer benchmarks for astrochemical models, paving the way for further investigation into the formation and evolution of complex organic molecules during the hot core phase.
Figures


Figures from the paper (12 more)




Reference graph
Works this paper leans on
-
[1]
2015, MNRAS, 453, L31, doi: 10.1093/mnrasl/slv094
Barone, V., Latouche, C., Skouteris, D., et al. 2015, MNRAS, 453, L31, doi: 10.1093/mnrasl/slv094
-
[2]
Belloche, A., Garrod, R. T., M¨ uller, H. S. P., et al. 2019, A&A, 628, A10, doi: 10.1051/0004-6361/201935428
-
[3]
Belloche, A., M¨ uller, H. S. P., Garrod, R. T., & Menten, K. M. 2016, A&A, 587, A91, doi: 10.1051/0004-6361/201527268
-
[4]
2013, A&A, 559, A47, doi: 10.1051/0004-6361/201321096
Comito, C. 2013, A&A, 559, A47, doi: 10.1051/0004-6361/201321096
-
[5]
Belloche, A., Meshcheryakov, A. A., Garrod, R. T., et al. 2017, A&A, 601, A49, doi: 10.1051/0004-6361/201629724
-
[6]
Kaiser, R. I. 2007, ApJ, 660, 1588, doi: 10.1086/511296
doi:10.1086/511296 2007
-
[7]
Bennett, C. J., & Kaiser, R. I. 2007, ApJ, 661, 899, doi: 10.1086/516745
doi:10.1086/516745 2007
-
[8]
Bergin, E. A., Phillips, T. G., Comito, C., et al. 2010, A&A, 521, L20, doi: 10.1051/0004-6361/201015071
Show all 86 references
-
[9]
Wachter, E. B. M. 2007, A&A, 465, 913, doi: 10.1051/0004-6361:20065963
2007 doi
-
[10]
T., et al
Bonfand, M., Belloche, A., Garrod, R. T., et al. 2019, A&A, 628, A27, doi: 10.1051/0004-6361/201935523
2019 doi
-
[11]
M., Garrod, R
Bonfand, M., Belloche, A., Menten, K. M., Garrod, R. T., & M¨ uller, H. S. P. 2017, A&A, 604, A60, doi: 10.1051/0004-6361/201730648
2017 doi
-
[12]
2022, A&A, 662, A32, doi: 10.1051/0004-6361/202140519
Bouscasse, L., Csengeri, T., Belloche, A., et al. 2022, A&A, 662, A32, doi: 10.1051/0004-6361/202140519
2022 doi
-
[13]
F., Millar, T
Chapman, J. F., Millar, T. J., Wardle, M., Burton, M. G., & Walsh, A. J. 2009, MNRAS, 394, 221, doi: 10.1111/j.1365-2966.2008.14144.x
2009
-
[14]
J., Fedoseev, G., Scir` e, C., et al
Chuang, K. J., Fedoseev, G., Scir` e, C., et al. 2021, A&A, 650, A85, doi: 10.1051/0004-6361/202140780
2021 doi
-
[15]
2017, A&A, 605, L3, doi: 10.1051/0004-6361/201731249
Codella, C., Ceccarelli, C., Caselli, P., et al. 2017, A&A, 605, L3, doi: 10.1051/0004-6361/201731249
2017 doi
-
[16]
M., et al
Coletta, A., Fontani, F., Rivilla, V. M., et al. 2020, A&A, 641, A54, doi: 10.1051/0004-6361/202038212
2020 doi
-
[17]
M., Beltr´ an, M
Colzi, L., Rivilla, V. M., Beltr´ an, M. T., et al. 2021, A&A, 653, A129, doi: 10.1051/0004-6361/202141573
2021 doi
-
[18]
2021, CARTA: The Cube Analysis and Rendering Tool for Astronomy, 2.0.0, Zenodo, doi: 10.5281/zenodo.4905459
Comrie, A., Wang, K.-S., Hsu, S.-C., et al. 2021, CARTA: The Cube Analysis and Rendering Tool for Astronomy, 2.0.0, Zenodo, doi: 10.5281/zenodo.4905459
2021 doi
-
[19]
K., van der Wiel, M
Coutens, A., Jørgensen, J. K., van der Wiel, M. H. D., et al. 2016, A&A, 590, L6, doi: 10.1051/0004-6361/201628612
2016 doi
-
[20]
R., Garrod, R
Coutens, A., Willis, E. R., Garrod, R. T., et al. 2018, A&A, 612, A107, doi: 10.1051/0004-6361/201732346
2018 doi
-
[21]
M., Lucas, D
Douglas, K. M., Lucas, D. I., Walsh, C., et al. 2022, ApJL, 937, L16, doi: 10.3847/2041-8213/ac8cef
2022 doi
-
[22]
W., Cuppen, H
Fuchs, G. W., Cuppen, H. M., Ioppolo, S., et al. 2009, A&A, 505, 629, doi: 10.1051/0004-6361/200810784
2009 doi
-
[23]
Garrod, R. T. 2013, ApJ, 765, 60, doi: 10.1088/0004-637X/765/1/60
2013 doi
-
[24]
T., Belloche, A., M¨ uller, H
Garrod, R. T., Belloche, A., M¨ uller, H. S. P., & Menten, K. M. 2017, A&A, 601, A48, doi: 10.1051/0004-6361/201630254
2017 doi
-
[25]
T., Jin, M., Matis, K
Garrod, R. T., Jin, M., Matis, K. A., et al. 2022, ApJS, 259, 1, doi: 10.3847/1538-4365/ac3131
2022 doi
-
[26]
T., Widicus Weaver, S
Garrod, R. T., Widicus Weaver, S. L., & Herbst, E. 2008, in IAU Symposium, Vol. 251, Organic Matter in Space, ed. S. Kwok & S. Sanford, 123–124, doi: 10.1017/S1743921308021339
2008 doi
-
[27]
2021, A&A, 648, A66, doi: 10.1051/0004-6361/202039670
Gieser, C., Beuther, H., Semenov, D., et al. 2021, A&A, 648, A66, doi: 10.1051/0004-6361/202039670
2021 doi
-
[28]
J., & Van Der Walt, D
Goedhart, S., Gaylard, M. J., & Van Der Walt, D. J. 2004, Monthly Notices of the Royal Astronomical Society, 355, 553, doi: 10.1111/j.1365-2966.2004.08340.x
2004
-
[29]
2020, ApJ, 895, 86, doi: 10.3847/1538-4357/ab8871
Gorai, P., Bhat, B., Sil, M., et al. 2020, ApJ, 895, 86, doi: 10.3847/1538-4357/ab8871
2020 doi
-
[30]
T., Ilyushin, V., & Ziurys, L
Halfen, D. T., Ilyushin, V., & Ziurys, L. M. 2011, ApJ, 743, 60, doi: 10.1088/0004-637X/743/1/60
2011 doi
-
[31]
T., Woolf, N
Halfen, D. T., Woolf, N. J., & Ziurys, L. M. 2017, ApJ, 845, 158, doi: 10.3847/1538-4357/aa816b
2017 doi
-
[32]
E., Herbst, E., & Garrod, R
Hassel, G. E., Herbst, E., & Garrod, R. T. 2008, ApJ, 681, 1385, doi: 10.1086/588185
2008 doi
-
[33]
Henkel, C., Guesten, R., & Gardner, F. F. 1985, A&A, 143, 148
1985
-
[34]
2009, ApJ, 691, 823, doi: 10.1088/0004-637X/691/1/823
Hosokawa, T., & Omukai, K. 2009, ApJ, 691, 823, doi: 10.1088/0004-637X/691/1/823
2009 doi
-
[35]
K., Thiel, V., Henkel, C., et al
Humire, P. K., Thiel, V., Henkel, C., et al. 2020, A&A, 642, A222, doi: 10.1051/0004-6361/202038216 Jørgensen, J. K., Belloche, A., & Garrod, R. T. 2020, ARA&A, 58, 727, doi: 10.1146/annurev-astro-032620-021927
2020 doi
-
[36]
2013, in Astronomical Society of the Pacific Conference Series, Vol
Kahane, C., Ceccarelli, C., Faure, A., & Caux, E. 2013, in Astronomical Society of the Pacific Conference Series, Vol. 476, New Trends in Radio Astronomy in the ALMA Era: The 30th Anniversary of Nobeyama Radio Observatory, ed. R. Kawabe, N. Kuno, & S. Yamamoto, 323
2013
-
[37]
L., Evans, N
Kauffmann, J., Bertoldi, F., Bourke, T. L., Evans, N. J., I., & Lee, C. W. 2008, A&A, 487, 993, doi: 10.1051/0004-6361:200809481
2008 doi
-
[38]
Walmsley, C. M. 2000, in Protostars and Planets IV, ed. V. Mannings, A. P. Boss, & S. S. Russell, 299–326
2000
-
[39]
D., & Penzias, A
Langer, W. D., & Penzias, A. A. 1990, ApJ, 357, 477, doi: 10.1086/168935 Molecular Complexity of G336 27 —. 1993, ApJ, 408, 539, doi: 10.1086/172611
1990 doi
-
[40]
J., Zhang, Q., ¨Oberg, K
Law, C. J., Zhang, Q., ¨Oberg, K. I., et al. 2021, ApJ, 909, 214, doi: 10.3847/1538-4357/abdeb8
2021 doi
-
[41]
S., et al
Liu, T., Lacy, J., Li, P. S., et al. 2017, ApJ, 849, 25, doi: 10.3847/1538-4357/aa8d73
2017 doi
-
[42]
J., Kim, K.-T., et al
Liu, T., Evans, N. J., Kim, K.-T., et al. 2020, MNRAS, 496, 2790, doi: 10.1093/mnras/staa1577
2020 doi
-
[43]
2022, ApJS, 263, 13, doi: 10.3847/1538-4365/ac9127 —
Liu, X., Liu, T., Shen, Z., et al. 2022, ApJS, 263, 13, doi: 10.3847/1538-4365/ac9127 —. 2024a, ApJS, 271, 3, doi: 10.3847/1538-4365/ad1601
2022 doi
-
[44]
2024b, Research in Astronomy and Astrophysics, 24, 025009, doi: 10.1088/1674-4527/ad0d5c
Liu, X., Liu, T., Zhu, L., et al. 2024b, Research in Astronomy and Astrophysics, 24, 025009, doi: 10.1088/1674-4527/ad0d5c
-
[45]
H., Gibb, A
MacDonald, G. H., Gibb, A. G., Habing, R. J., & Millar, T. J. 1996, A&AS, 119, 333
1996
-
[46]
I., & Jones, B
Maity, S., Kaiser, R. I., & Jones, B. M. 2015, Physical Chemistry Chemical Physics (Incorporating Faraday Transactions), 17, 3081, doi: 10.1039/C4CP04149F
2015 doi
-
[47]
2016, MNRAS, 458, 1859, doi: 10.1093/mnras/stw457
Majumdar, L., Gratier, P., Vidal, T., et al. 2016, MNRAS, 458, 1859, doi: 10.1093/mnras/stw457
2016 doi
-
[48]
2024, A&A, 687, A195, doi: 10.1051/0004-6361/202450023
Marchand, P., Coutens, A., Scigliuto, J., et al. 2024, A&A, 687, A195, doi: 10.1051/0004-6361/202450023
2024 doi
-
[49]
2011, A&A, 526, A47, doi: 10.1051/0004-6361/201015487
Maret, S., Hily-Blant, P., Pety, J., Bardeau, S., & Reynier, E. 2011, A&A, 526, A47, doi: 10.1051/0004-6361/201015487
2011 doi
-
[50]
J., et al
McElroy, D., Walsh, C., Markwick, A. J., et al. 2013, A&A, 550, A36, doi: 10.1051/0004-6361/201220465
2013 doi
-
[51]
2007, in Astronomical Society of the Pacific Conference Series, Vol
Golap, K. 2007, in Astronomical Society of the Pacific Conference Series, Vol. 376, Astronomical Data Analysis Software and Systems XVI, ed. R. A. Shaw, F. Hill, & D. J. Bell, 127
2007
-
[52]
2005, ApJ, 634, 1126, doi: 10.1086/497123 M¨ uller, H
Wyckoff, S. 2005, ApJ, 634, 1126, doi: 10.1086/497123 M¨ uller, H. S. P., Schl¨ oder, F., Stutzki, J., & Winnewisser, G. 2005, Journal of Molecular Structure, 742, 215, doi: 10.1016/j.molstruc.2005.01.027 M¨ uller, H. S. P., Thorwirth, S., Roth, D. A., &
2005 doi
-
[53]
2001, A&A, 370, L49, doi: 10.1051/0004-6361:20010367 M¨ uller, H
Winnewisser, G. 2001, A&A, 370, L49, doi: 10.1051/0004-6361:20010367 M¨ uller, H. S. P., Belloche, A., Xu, L.-H., et al. 2016, A&A, 587, A92, doi: 10.1051/0004-6361/201527470
2001 doi
-
[54]
L., van Dishoeck, E
Nazari, P., van Gelder, M. L., van Dishoeck, E. F., et al. 2021, A&A, 650, A150, doi: 10.1051/0004-6361/202039996
2021 doi
-
[55]
D., van Gelder, M
Nazari, P., Meijerhof, J. D., van Gelder, M. L., et al. 2022, A&A, 668, A109, doi: 10.1051/0004-6361/202243788
2022 doi
-
[56]
H., Zingsheim, O., Belloche, A., et al
Ordu, M. H., Zingsheim, O., Belloche, A., et al. 2019, A&A, 629, A72, doi: 10.1051/0004-6361/201935887
2019 doi
-
[57]
1994, A&A, 291, 943
Ossenkopf, V., & Henning, T. 1994, A&A, 291, 943
1994
-
[58]
2022, MNRAS, 512, 4419, doi: 10.1093/mnras/stac624
Peng, Y., Liu, T., Qin, S.-L., et al. 2022, MNRAS, 512, 4419, doi: 10.1093/mnras/stac624
2022 doi
-
[59]
M., Poynter, R
Pickett, H. M., Poynter, R. L., Cohen, E. A., et al. 1998, JQSRT, 60, 883, doi: 10.1016/S0022-4073(98)00091-0
1998 doi
-
[60]
2022, MNRAS, 511, 3463, doi: 10.1093/mnras/stac219
Qin, S.-L., Liu, T., Liu, X., et al. 2022, MNRAS, 511, 3463, doi: 10.1093/mnras/stac219
2022 doi
-
[61]
2007, A&A, 474, 521, doi: 10.1051/0004-6361:20078246 Qu´ enard, D., Jim´ enez-Serra, I., Viti, S., Holdship, J., &
Quan, D., & Herbst, E. 2007, A&A, 474, 521, doi: 10.1051/0004-6361:20078246 Qu´ enard, D., Jim´ enez-Serra, I., Viti, S., Holdship, J., &
2007 doi
-
[62]
2018, MNRAS, 474, 2796, doi: 10.1093/mnras/stx2960
Coutens, A. 2018, MNRAS, 474, 2796, doi: 10.1093/mnras/stx2960
2018 doi
-
[63]
M., Garay, G., Jackson, J
Rathborne, J. M., Garay, G., Jackson, J. M., et al. 2011, ApJ, 741, 120, doi: 10.1088/0004-637X/741/2/120
2011 doi
-
[64]
2018, ACS Earth and Space Chemistry, 2, 720, doi: 10.1021/acsearthspacechem.7b00156
Rimola, A., Skouteris, D., Balucani, N., et al. 2018, ACS Earth and Space Chemistry, 2, 720, doi: 10.1021/acsearthspacechem.7b00156
2018 doi
-
[65]
Wilson, T. L. 2010, A&A, 523, A45, doi: 10.1051/0004-6361/200913359
2010 doi
-
[66]
2006, A&A, 454, L41, doi: 10.1051/0004-6361:20065398
Schilke, P., Comito, C., Thorwirth, S., et al. 2006, A&A, 454, L41, doi: 10.1051/0004-6361:20065398
2006 doi
-
[67]
N., Chapman, J
Sevenster, M. N., Chapman, J. M., Habing, H. J., Killeen, N. E. B., & Lindqvist, M. 1997, A&AS, 124, 509, doi: 10.1051/aas:1997365
1997 doi
-
[68]
2021, ApJ, 922, 206, doi: 10.3847/1538-4357/ac289b
Shimonishi, T., Izumi, N., Furuya, K., & Yasui, C. 2021, ApJ, 922, 206, doi: 10.3847/1538-4357/ac289b
2021 doi
-
[69]
C., Peng, R., Danchi, W
Sutton, E. C., Peng, R., Danchi, W. C., et al. 1995, ApJS, 97, 455, doi: 10.1086/192147
1995 doi
-
[70]
2018, ApJS, 237, 3, doi: 10.3847/1538-4365/aac8db
Suzuki, T., Ohishi, M., Saito, M., et al. 2018, ApJS, 237, 3, doi: 10.3847/1538-4365/aac8db
2018 doi
-
[71]
2019, ApJ, 881, 57, doi: 10.3847/1538-4357/ab2d9e
Taniguchi, K., Herbst, E., Caselli, P., et al. 2019, ApJ, 881, 57, doi: 10.3847/1538-4357/ab2d9e
2019 doi
-
[72]
2016, ApJ, 830, 106, doi: 10.3847/0004-637X/830/2/106
Taniguchi, K., Saito, M., & Ozeki, H. 2016, ApJ, 830, 106, doi: 10.3847/0004-637X/830/2/106
2016 doi
-
[73]
A., et al
Taniguchi, K., Sanhueza, P., Olguin, F. A., et al. 2023, ApJ, 950, 57, doi: 10.3847/1538-4357/acca1d
2023 doi
-
[74]
S., K¨ onig, C., Giannetti, A., et al
Urquhart, J. S., K¨ onig, C., Giannetti, A., et al. 2018, MNRAS, 473, 1059, doi: 10.1093/mnras/stx2258 van Dishoeck, E. F., & Blake, G. A. 1998, ARA&A, 36, 317, doi: 10.1146/annurev.astro.36.1.317 van Gelder, M. L., Tabone, B., Tychoniec, L., et al. 2020, A&A, 639, A87, doi: 1...
2018 doi
-
[75]
Vidal, T. H. G., Loison, J.-C., Jaziri, A. Y., et al. 2017, MNRAS, 469, 435, doi: 10.1093/mnras/stx828
2017 doi
-
[76]
C., Herbst, E., et al
Wakelam, V., Loison, J. C., Herbst, E., et al. 2015, ApJS, 217, 20, doi: 10.1088/0067-0049/217/2/20
2015 doi
-
[77]
J., Burton, M
Walsh, A. J., Burton, M. G., Hyland, A. R., & Robinson, G. 1998, Monthly Notices of the Royal Astronomical Society, 301, 640, doi: 10.1111/j.1365-8711.1998.02014.x 28 Duan et al
1998
-
[78]
J., Hyland, A
Walsh, A. J., Hyland, A. R., Robinson, G., & Burton, M. G. 1997, Monthly Notices of the Royal Astronomical Society, 291, 261, doi: 10.1093/mnras/291.2.261
1997 doi
-
[79]
2002, ApJL, 571, L173, doi: 10.1086/341412
Watanabe, N., & Kouchi, A. 2002, ApJL, 571, L173, doi: 10.1086/341412
2002 doi
-
[80]
R., Garrod, R
Willis, E. R., Garrod, R. T., Belloche, A., et al. 2020, A&A, 636, A29, doi: 10.1051/0004-6361/201936489
2020 doi
-
[81]
Wilson, T. L. 1999, Reports on Progress in Physics, 62, 143, doi: 10.1088/0034-4885/62/2/002
1999 doi
-
[82]
L., & Rood, R
Wilson, T. L., & Rood, R. 1994, ARA&A, 32, 191, doi: 10.1146/annurev.aa.32.090194.001203
1994
-
[83]
2024, Research in Astronomy and Astrophysics, 24, 065011, doi: 10.1088/1674-4527/ad3dc3
Xu, F., Wang, K., Liu, T., et al. 2024, Research in Astronomy and Astrophysics, 24, 065011, doi: 10.1088/1674-4527/ad3dc3
2024 doi
-
[84]
T., Zhang, J
Yan, Y. T., Zhang, J. S., Henkel, C., et al. 2019, ApJ, 877, 154, doi: 10.3847/1538-4357/ab17d6
2019 doi
-
[85]
T., Henkel, C., Kobayashi, C., et al
Yan, Y. T., Henkel, C., Kobayashi, C., et al. 2023, A&A, 670, A98, doi: 10.1051/0004-6361/202244584
2023 doi
-
[86]
2023, MNRAS, 521, 1578, doi: 10.1093/mnras/stad627
Zhang, X., Quan, D., Li, R., et al. 2023, MNRAS, 521, 1578, doi: 10.1093/mnras/stad627
2023 doi
Reviewed August 7, 2026 · model on record in the stance chip above.
Discussion (0). Continue with ORCID to comment.