REVIEW 1 major objections 4 minor 45 references
The Sub-mm Variability of IRC+10216 and $o$ Ceti
T0 review · 1 major / 4 minor · reviewed 2026-08-14 · deepseek-v4-flash
Pith's one-line read By folding seven years of 850-micron observations of the carbon-rich star IRC+10216, the paper finds the sub-mm brightness peaks about 540 days after the optical peak and argues that the dust formation-destruction cycle is partially…
desk verdict Solid sub-mm period dataset for two AGB stars, but the 540-day phase lag is not robust to the 85-day period uncertainty and needs a stability check before it can be taken as real. read the letter →
The pith
A machine-rendered reading of the paper's core claim, the machinery that carries it, and where it could break.
The reading
What carries the argument
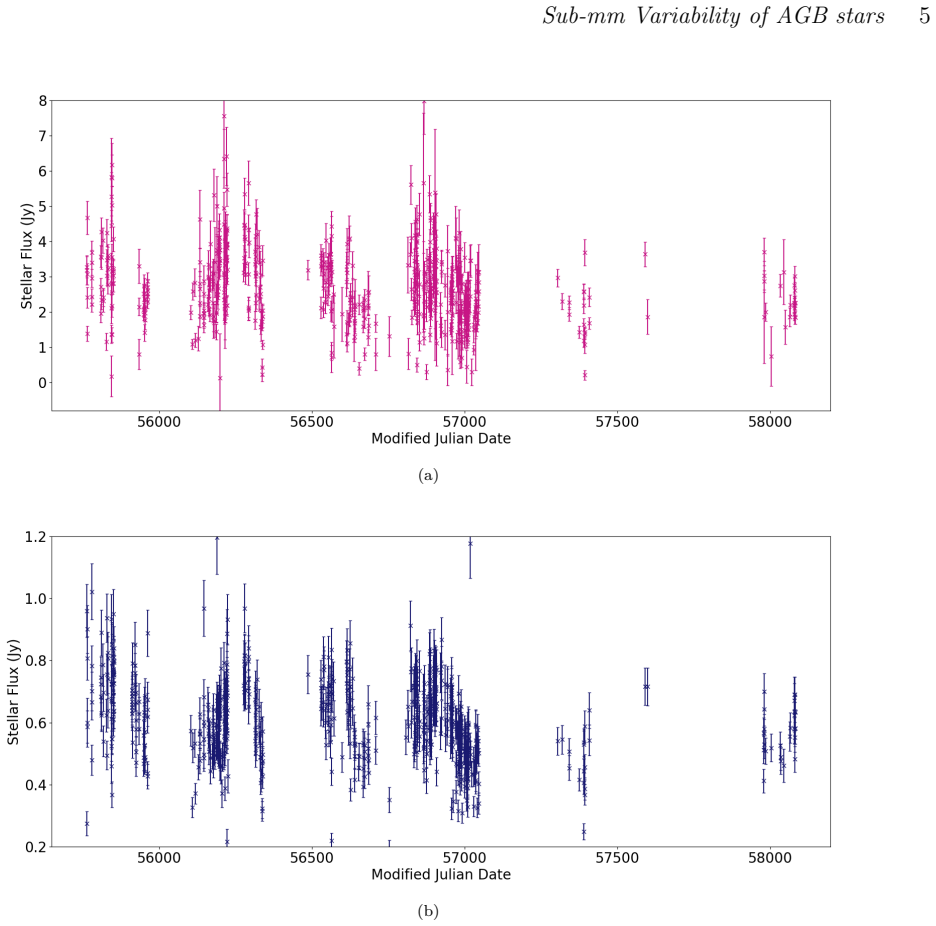
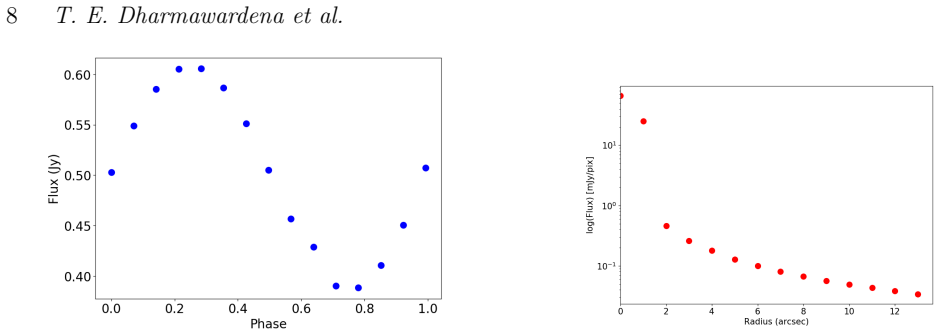
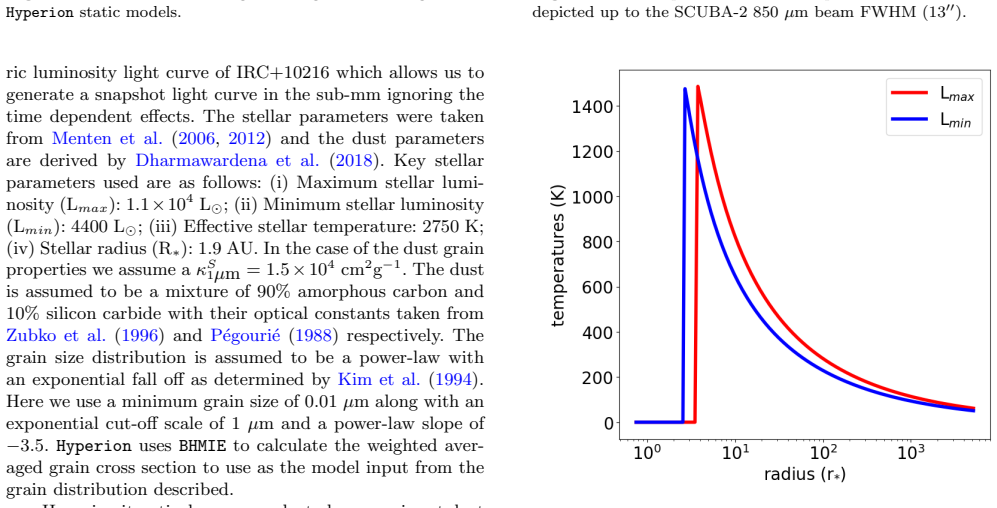
The workhorse is phase folding: rebinning the unevenly sampled sub-mm time series at a candidate period and comparing the phase of peak brightness with the phase of the optical peak after aligning both to a common zero-point. To avoid assuming a sine shape for the light curve, two non-parametric period estimators were used alongside two parametric sine-based methods, and the consistency of all four at 850 microns is what makes the lag claim interpretable. The physical mechanism is probed with a sequence of static radiative-transfer models built along the bolometric luminosity light curve; these models locate 99 percent of the beam flux in the inner 2-arcsecond region, show the dust condensation radius changing by about one stellar radius between minimum and maximum light, and recover the observed amplitude of variation.
What would settle it
A longer 850-micron time series covering at least three more cycles, folded at both the paper's 667 to 678 day period and the Herschel 640-day period, should reproduce a roughly 0.79 phase shift for the lag to count as real; if the peak shifts to align with the optical light curve, or if the rebinned folded shape changes when the period is varied within the FWHM of the periodogram peak, the 540-day lag is an artifact of sparse sampling.
Extended reading notes
Core claim
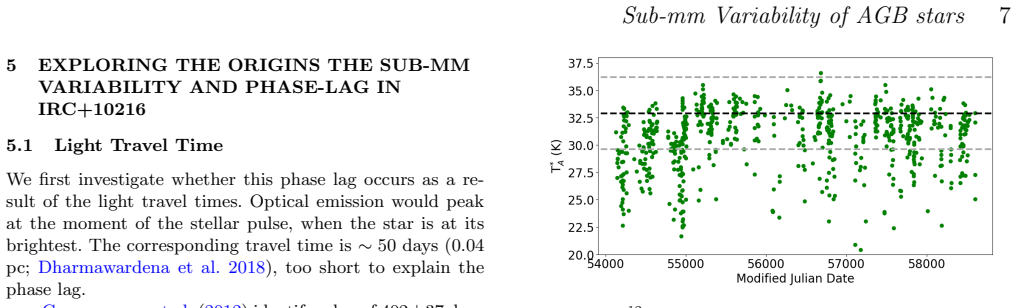
The central discovery is a measured phase lag at submillimetre wavelengths: when the 850-micron light curve of IRC+10216 is folded at the common period of about 678 days and aligned to the same zero-point as the optical light curve, its peak occurs at a phase difference of roughly 0.79, corresponding to about 540 days. The same period is recovered by four independent methods at 850 microns, with values from 667 to 678 days, while the 450-micron data are noisier and consistent only within their larger uncertainties. Light-travel time across the envelope is far too short to explain the lag, and molecular-line contamination and free-free emission can account for at most a few percent and about ten percent of the flux respectively, so the lag must arise in the dust or in some other mechanism tied to the pulse. Static radiative transfer snapshots along the stellar luminosity cycle reproduce the observed fractional amplitude, with a peak-to-trough ratio of about 1.4 observed versus 1.6 in the model, and show the dust condensation radius shifting by roughly one stellar radius, from about 2.5 to 3.5 stellar radii between minimum and maximum light. The paper concludes that the dust formation and destruction cycle contributes to the variability and lag, but a second, dominant mechanism is still required.
Load-bearing premise
The 540-day lag rests on the assumption that IRC+10216's sub-mm brightness varies with the same period as its optical brightness, and that the peak seen in only about three cycles of sparse, calibration-limited 850-micron data is real rather than a product of noise or the chosen period.
Editorial extensions
If this is right
- o Ceti's sub-mm periods agree with its well-established optical period, so sub-mm continuum variability traces the same stellar pulsation in a dust-poor, optically thin case.
- IRC+10216's sub-mm period matches optical-to-far-IR periods, meaning the pulsation period is stable across wavelengths and the 540-day lag is a phase shift rather than a different period.
- The close phase agreement between the 850-micron and radio light curves suggests that one physical mechanism may drive variability at both long wavelengths.
- The modelled inward and outward shift of the dust condensation radius by about one stellar radius over the pulsation cycle provides a partial explanation of the lag, linking it to dust formation and destruction.
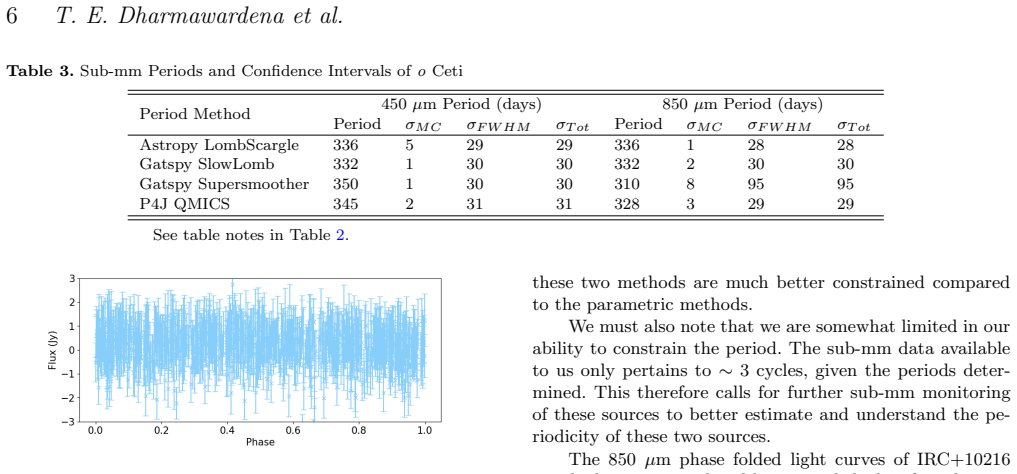
- Because the sub-mm data cover only about three cycles and the periodogram peak is wide, continued sub-mm monitoring is needed to tighten the periods and confirm the lag.
Reading between the lines
- If the lag is real, sub-mm light curves could become a practical tracer of dust formation and destruction timescales in AGB stars, since the lag would encode the delay between the stellar pulse and the dust response.
- The same phase-lag analysis could be applied to other AGB stars that appear in pointing-calibration archives, potentially revealing how the lag depends on mass-loss rate and dust composition.
- The static radiative-transfer models show no lag even though they match the amplitude, which suggests that time-dependent dust formation and destruction, rather than simple geometry, is essential to explaining the observations.
- If the dominant mechanism is shock-driven, the lag should vary with wavelength and might be resolved with high-resolution sub-mm imaging; that is a testable prediction the paper does not make explicitly.
Signed reviews
Editorial analysis
A structured set of objections, weighed in public.
Referee Report
Summary. The paper presents sub-mm (450 and 850 micron) light curves of two AGB stars, IRC+10216 and o Ceti, obtained from JCMT/SCUBA-2 pointing calibration observations over seven years. Periods are derived with four methods: two Lomb-Scargle implementations, Gatspy Supersmoother, and P4J. For IRC+10216 at 850 micron, the periods range from 667 to 678 days with total uncertainties of about 80-95 days, while the 450 micron data are noisier and partly aliased. After phase-folding the 850 micron data with the Astropy Lomb-Scargle period of 678 days, the authors report a phase offset of about 0.79 relative to the optical peak, corresponding to a ~540 day lag. They then explore possible origins: light travel time, molecular-line contamination, free-free emission, and a dust formation/destruction cycle modeled with Hyperion radiative-transfer snapshots. They conclude that the dust cycle can contribute only partially and that a second, unknown mechanism is needed to explain the sub-mm variability and the phase lag.
Significance. The paper makes clever use of a large volume of calibration data to probe long-timescale sub-mm variability in two benchmark AGB stars. The multi-method period analysis is careful, and the public release of scripts and photometry tables is a strength. If the phase-lag measurement were robust, it would provide a new observational constraint on the connection between stellar pulsation and dust formation in the inner circumstellar envelope. However, the headline ~540 day lag is currently presented without a propagated uncertainty, and the wide periodogram peak (sigma_Tot = 85 days) directly threatens the stability of the folded phase. The central observational claim therefore needs additional analysis before the result can be considered established.
major comments (1)
- [Sec. 4.2, Table 2] The ~540-day phase lag is not robust to the period uncertainty. The phase folding in Sec. 4.2 uses a single period of 678 days, but the reported total uncertainty is sigma_Tot = 85 days, dominated by the periodogram FWHM. Over the roughly 2557-day baseline (about 3.8 cycles), a period error of 85 days corresponds to a phase drift of approximately 0.47 cycles at the end of the baseline, which will substantially smear the folded light curve and can shift the apparent peak by a large fraction of a period. The authors correctly note in Sec. 4.2 that the data cover only about three cycles and that the periodogram peak is wide, but they do not propagate this uncertainty into the lag. The statement that the four methods agree to within 11 days measures method scatter, not the FWHM uncertainty, so it does not justify the use of a single period. To support the 540-day claim, the authors should provide a sensitivity analysis or Monte Carlo procedure that folds the data with periods drawn from the sigma_Tot distribution and reports the resulting distribution of peak phases and lags. Without this, the phase lag and the subsequent comparison with radio data and with the dust-cycle interpretation are effectively unconstrained.
minor comments (4)
- [Sec. 3.2] There is a typo: "sqaure root" should be "square root".
- [Sec. 5.3.1] The statement that recovering only ~4% of the observed flux "is not an issue for our analysis" is under-justified. A model that underestimates the 850 micron flux by a factor of ~25 may not correctly capture the radial distribution of emission even if the peak-to-trough ratio is similar; a brief caveat about this assumption would strengthen the discussion.
- [Fig. A1 caption] The caption says "the peak is shifted by delta-phi = 0.45 to better present the shape" but does not explain whether the phase axis has been offset for display or whether this shift affects the reported phase lag. Please clarify.
- [Acknowledgements] The citation "SciPy (Jones et al. 01)" is incomplete; a full reference with year and DOI or arXiv identifier should be provided.
Circularity Check
No circular derivation; the period and phase-lag measurements are independent of the model inputs, with only a minor non-load-bearing self-citation.
full rationale
The paper's central results are the sub-mm periods and the ~540-day phase lag of IRC+10216. The periods are derived directly from new SCUBA-2 photometry using four independent period-finding methods (two non-parametric, two Lomb-Scargle), and they are compared with, not fit to, optical and far-IR periods from other groups. The phase lag is read off from the rebinned 850 micron light curve folded at the independently measured Astropy Lomb-Scargle period (678 days) and aligned to the published Catalina optical T0; no parameter is fitted to produce the lag. The radiative-transfer modeling does reuse dust parameters from the authors' own prior paper (Dharmawardena et al. 2018), but those parameters were derived from static co-added maps, not from the variability time series, and the model explicitly does not reproduce the observed phase lag. The paper even states that a second, unknown mechanism must be invoked. Thus the self-citation is not load-bearing for the main variability and phase-lag claims. The large periodogram FWHM and short baseline noted in Sec. 4.2 raise a legitimate robustness concern about the lag, but that is a statistical/correctness issue, not circularity.
Assumptions & free parameters
free parameters (5)
- Radiation transfer stellar luminosity input (Lmax, Lmin) =
1.1e4 Lsun, 4400 Lsun
- Effective temperature and stellar radius =
2750 K, 1.9 AU
- Dust composition =
90% amorphous carbon + 10% silicon carbide
- Grain size distribution parameters =
power-law slope -3.5, amin 0.01 um, exponential cutoff 1 um
- Dust sublimation temperature
assumptions (5)
- domain assumption PSF photometry with a pseudo-PSF built from co-added maps measures the flux of an extended source without bias from negative bowling or blooming artefacts.
- domain assumption Pointing-calibration observations form a time series whose scatter is dominated by astrophysical variability plus a known calibration uncertainty, not by time-varying instrumental systematics.
- domain assumption 12CO(3-2) line contamination changes the 850 um continuum by less than 0.5%, so molecular line variability does not drive the measured periods or lag.
- ad hoc to paper A sequence of static Hyperion radiative-transfer snapshots along the bolometric light curve approximates the sub-mm light curve well enough to draw conclusions about the dust formation and destruction cycle.
- domain assumption The dust condensation radius inferred from Hyperion's dust sublimation iteration corresponds to the physical dust formation region in IRC+10216.
invented entities (1)
-
Second, unknown mechanism for sub-mm and radio variability
Cite this review
Pith. "Pith review of The Sub-mm Variability of IRC+10216 and $o$ Ceti." pith.science (2026). https://pith.science/paper/SBAG7ZSH
@misc{pith2026190804555,
  author       = {Pith},
  title        = {Pith review of: The Sub-mm Variability of IRC+10216 and $o$ Ceti},
  year         = {2026},
  howpublished = {\url{https://pith.science/paper/SBAG7ZSH}},
  note         = {Machine review of arXiv:1908.04555}
}
abstract
We present the sub-mm variability of two of the most well studied AGB stars, IRC+10216 and $o$ Ceti. The data are obtained at $450~\micron$ and $850~\micron$ as part of pointing calibration observations for the James Clerk Maxwell Telescope's SCUBA-2 instrument over a span of 7 years. The periods are derived using non-parametric methods, \texttt{Gatspy Supersmoother} and \texttt{P4J} in order not to assume an underlying shape to the periodicity. These were compared to two Lomb-Scargle parametric methods. We find that for both sources and wavelengths the periods derived from all methods are consistent within $1\sigma$. The $850~\micron$ phase folded light curves of IRC+10216 show a time lag of $\sim 540$ days compared to its optical counterpart. We explore the origins of the sub-mm variability and the phase lag using radiative transfer models. Combining the modelling with findings in the literature, we find that the sub-mm emission and phase lag can be partially attributed to the dust formation/destruction cycle. A second, unknown mechanism must be invoked; we defer an investigation of the origin and nature of this mechanism to a future work.
Figures

Figures from the paper (3 more)
Reference graph
Works this paper leans on
-
[1]
Bladh S., 2019, arXiv e-prints, http://adsabs.harvard.edu/abs/2019arXiv190110954B
work page 2019
-
[2]
Bradley L., et al., 2016, astropy/photutils: v0.3, @doi 10.5281/zenodo.164986 , https://doi.org/10.5281/zenodo.164986
-
[3]
Cernicharo J., Marcelino N., Ag \'u ndez M., Gu \'e lin M., 2015, @doi [ ] 10.1051/0004-6361/201424565 , http://adsabs.harvard.edu/abs/2015A
-
[4]
Chapin E. L., Berry D. S., Gibb A. G., Jenness T., Scott D., Tilanus R. P. J., Economou F., Holland W. S., 2013, @doi [ ] 10.1093/mnras/stt052 , http://cdsads.u-strasbg.fr/abs/2013MNRAS.430.2545C 430, 2545
-
[5]
Dehaes S., Groenewegen M. A. T., Decin L., Hony S., Raskin G., Blommaert J. A. D. L., 2007, @doi [ ] 10.1111/j.1365-2966.2007.11665.x , http://adsabs.harvard.edu/abs/2007MNRAS.377..931D 377, 931
arXiv 2007
-
[6]
Dempsey J. T., et al., 2013, @doi [ ] 10.1093/mnras/stt090 , http://adsabs.harvard.edu/abs/2013MNRAS.430.2534D 430, 2534
-
[7]
Dharmawardena T. E., et al., 2018, @doi [Monthly Notices of the Royal Astronomical Society] 10.1093/mnras/sty1422 , 479, 536
-
[8]
Drabek E., et al., 2012, @doi [ ] 10.1111/j.1365-2966.2012.21140.x , http://adsabs.harvard.edu/abs/2012MNRAS.426...23D 426, 23
arXiv 2012
Show all 45 references
-
[9]
J., et al., 2014, @doi [ ] 10.1088/0067-0049/213/1/9 , http://adsabs.harvard.edu/abs/2014ApJS..213....9D 213, 9
Drake A. J., et al., 2014, @doi [ ] 10.1088/0067-0049/213/1/9 , http://adsabs.harvard.edu/abs/2014ApJS..213....9D 213, 9
2014 doi
-
[10]
M., Benson J
Dyck H. M., Benson J. A., Howell R. R., Joyce R. R., Leinert C., 1991, @doi [ ] 10.1086/115866 , http://adsabs.harvard.edu/abs/1991AJ....102..200D 102, 200
1991 doi
-
[11]
P., et al., 2018, @doi [ ] 10.3847/1538-4357/aac5e3 , https://ui.adsabs.harvard.edu/abs/2018ApJ...860..162F 860, 162
Fonfr \' a J. P., et al., 2018, @doi [ ] 10.3847/1538-4357/aac5e3 , https://ui.adsabs.harvard.edu/abs/2018ApJ...860..162F 860, 162
2018 doi
-
[12]
Gaudet S., et al., 2010, in Software and Cyberinfrastructure for Astronomy. p. 77401I, @doi 10.1117/12.858026
2010 doi
-
[13]
Groenewegen M. A. T., et al., 2012, @doi [ ] 10.1051/0004-6361/201219604 , http://adsabs.harvard.edu/abs/2012A
2012 doi
-
[14]
Z., Long J., Macri L
He S., Yuan W., Huang J. Z., Long J., Macri L. M., 2016, @doi [ ] 10.3847/0004-6256/152/6/164 , https://ui.adsabs.harvard.edu/#abs/2016AJ....152..164H 152, 164
2016 doi
-
[15]
H., Dinh-V-Trung Hasegawa T
He J. H., Dinh-V-Trung Hasegawa T. I., 2017, @doi [ ] 10.3847/1538-4357/aa7e76 , https://ui.adsabs.harvard.edu/abs/2017ApJ...845...38H 845, 38
2017 doi
-
[16]
H \"o fner S., Olofsson H., 2018, @doi [ ] 10.1007/s00159-017-0106-5 , http://adsabs.harvard.edu/abs/2018A
2018 doi
-
[17]
S., et al., 2013, @doi [ ] 10.1093/mnras/sts612 , http://cdsads.u-strasbg.fr/abs/2013MNRAS.430.2513H 430, 2513
Holland W. S., et al., 2013, @doi [ ] 10.1093/mnras/sts612 , http://cdsads.u-strasbg.fr/abs/2013MNRAS.430.2513H 430, 2513
2013 doi
-
[18]
A., F \"o rster F., Daniel S
Huijse P., Est \'e vez P. A., F \"o rster F., Daniel S. F., Connolly A. J., Protopapas P., Carrasco R., Pr \' ncipe J. C., 2018, @doi [ ] 10.3847/1538-4365/aab77c , http://adsabs.harvard.edu/abs/2018ApJS..236...12H 236, 12
2018 doi
-
[19]
Jones E., Oliphant T., Peterson P., et al., 2001--, SciPy : Open source scientific tools for Python , http://www.scipy.org/
2001
-
[20]
G., Hendry P
Kim S.-H., Martin P. G., Hendry P. D., 1994, @doi [ ] 10.1086/173714 , http://adsabs.harvard.edu/abs/1994ApJ...422..164K 422, 164
1994 doi
-
[21]
Kim H., Lee H.-G., Mauron N., Chu Y.-H., 2015, @doi [ ] 10.1088/2041-8205/804/1/L10 , http://adsabs.harvard.edu/abs/2015ApJ...804L..10K 804, L10
2015 doi
-
[22]
Le Bertre T., 1992, , http://adsabs.harvard.edu/abs/1992A
1992
-
[23]
R., 1976, @doi [ ] 10.1007/BF00648343 , http://adsabs.harvard.edu/abs/1976Ap
Lomb N. R., 1976, @doi [ ] 10.1007/BF00648343 , http://adsabs.harvard.edu/abs/1976Ap
1976 doi
-
[24]
Mairs S., et al., 2017, @doi [ ] 10.3847/1538-4357/aa7844 , http://adsabs.harvard.edu/abs/2017ApJ...843...55M 843, 55
2017 doi
-
[25]
A., Watson R
McDonald I., Zijlstra A. A., Watson R. A., 2017, @doi [ ] 10.1093/mnras/stx1433 , http://adsabs.harvard.edu/abs/2017MNRAS.471..770M 471, 770
2017 doi
-
[26]
M., Reid M
Menten K. M., Reid M. J., Kr \"u gel E., Claussen M. J., Sahai R., 2006, @doi [ ] 10.1051/0004-6361:20054463 , http://adsabs.harvard.edu/abs/2006A
2006 doi
-
[27]
M., Reid M
Menten K. M., Reid M. J., Kami \'n ski T., Claussen M. J., 2012, @doi [ ] 10.1051/0004-6361/201219422 , http://adsabs.harvard.edu/abs/2012A
2012 doi
-
[28]
R., et al., 2018, @doi [ ] 10.1051/0004-6361/201833303 , https://ui.adsabs.harvard.edu/abs/2018A&A...615L...4P 615, L4
Pardo J. R., et al., 2018, @doi [ ] 10.1051/0004-6361/201833303 , https://ui.adsabs.harvard.edu/abs/2018A&A...615L...4P 615, L4
2018 doi
-
[29]
Parsons H., et al., 2018, @doi [ ] 10.3847/1538-4365/aa989c , http://adsabs.harvard.edu/abs/2018ApJS..234...22P 234, 22
2018 doi
-
[30]
P\'egouri\'e B., 1988, , http://adsabs.harvard.edu/abs/1988A
1988
-
[31]
C., 2010, Information Theoretic Learning: Renyi's Entropy and Kernel Perspectives, 1st edn
Principe J. C., 2010, Information Theoretic Learning: Renyi's Entropy and Kernel Perspectives, 1st edn. Springer Publishing Company, Incorporated
2010
-
[32]
D., 1994, PhD thesis, UNIVERSITY OF CALIFORNIA, BERKELEY
Reimann J. D., 1994, PhD thesis, UNIVERSITY OF CALIFORNIA, BERKELEY
1994
-
[33]
P., 2011, @doi [ ] 10.1051/0004-6361/201117150 , http://adsabs.harvard.edu/abs/2011A
Robitaille T. P., 2011, @doi [ ] 10.1051/0004-6361/201117150 , http://adsabs.harvard.edu/abs/2011A
2011 doi
-
[34]
D., 1982, @doi [ ] 10.1086/160554 , http://adsabs.harvard.edu/abs/1982ApJ...263..835S 263, 835
Scargle J. D., 1982, @doi [ ] 10.1086/160554 , http://adsabs.harvard.edu/abs/1982ApJ...263..835S 263, 835
1982 doi
-
[35]
I., Taranova O
Shenavrin V. I., Taranova O. G., Nadzhip A. E., 2011, @doi [Astronomy Reports] 10.1134/S1063772911010070 , http://adsabs.harvard.edu/abs/2011ARep...55...31S 55, 31
2011 doi
-
[36]
R., Karovska M., 2009, @doi [ ] 10.1088/0004-637X/691/2/1470 , https://ui.adsabs.harvard.edu/#abs/2009ApJ...691.1470T 691, 1470
Templeton M. R., Karovska M., 2009, @doi [ ] 10.1088/0004-637X/691/2/1470 , https://ui.adsabs.harvard.edu/#abs/2009ApJ...691.1470T 691, 1470
2009 doi
-
[37]
F., Hron J., eds, Astronomical Society of the Pacific Conference Series Vol
Teyssier D., et al., 2015, in Kerschbaum F., Wing R. F., Hron J., eds, Astronomical Society of the Pacific Conference Series Vol. 497, Why Galaxies Care about AGB Stars III: A Closer Look in Space and Time. p. 43
2015
-
[38]
The Astropy Collaboration et al., 2018, preprint, http://adsabs.harvard.edu/abs/2018arXiv180102634T ( @eprint arXiv 1801.02634 )
2018 arXiv
-
[39]
T., 2018, @doi [ ] 10.3847/1538-4365/aab766 , http://adsabs.harvard.edu/abs/2018ApJS..236...16V 236, 16
VanderPlas J. T., 2018, @doi [ ] 10.3847/1538-4365/aab766 , http://adsabs.harvard.edu/abs/2018ApJS..236...16V 236, 16
2018 doi
-
[40]
T., Ivezi \'c Z ., 2015, @doi [ ] 10.1088/0004-637X/812/1/18 , http://adsabs.harvard.edu/abs/2015ApJ...812...18V 812, 18
VanderPlas J. T., Ivezi \'c Z ., 2015, @doi [ ] 10.1088/0004-637X/812/1/18 , http://adsabs.harvard.edu/abs/2015ApJ...812...18V 812, 18
2015 doi
-
[41]
Vanderplas J., 2015, gatspy: General tools for Astronomical Time Series in Python , @doi 10.5281/zenodo.14833 , https://doi.org/10.5281/zenodo.14833
2015 doi
-
[42]
C., Strecker D
Witteborn F. C., Strecker D. W., Erickson E. F., Smith S. M., Goebel J. H., Taylor B. J., 1980, @doi [ ] 10.1086/158014 , http://adsabs.harvard.edu/abs/1980ApJ...238..577W 238, 577
1980 doi
-
[43]
T., Kami \'n ski T., Menten K
Wong K. T., Kami \'n ski T., Menten K. M., Wyrowski F., 2016, @doi [ ] 10.1051/0004-6361/201527867 , https://ui.adsabs.harvard.edu/#abs/2016A&A...590A.127W 590, A127
2016 doi
-
[44]
G., Mennella V., Colangeli L., Bussoletti E., 1996, @doi [ ] 10.1093/mnras/282.4.1321 , http://adsabs.harvard.edu/abs/1996MNRAS.282.1321Z 282, 1321
Zubko V. G., Mennella V., Colangeli L., Bussoletti E., 1996, @doi [ ] 10.1093/mnras/282.4.1321 , http://adsabs.harvard.edu/abs/1996MNRAS.282.1321Z 282, 1321
1996 doi
-
[45]
write newline
" write newline "" before.all 'output.state := FUNCTION fin.entry write newline FUNCTION new.block output.state before.all = 'skip after.block 'output.state := if FUNCTION new.sentence output.state after.block = 'skip output.state before.all = 'skip after.sentence 'output.stat...
Reviewed August 14, 2026 · model on record in the stance chip above.
Discussion (0). Continue with ORCID to comment.