REVIEW 4 major objections 6 minor 1 cited by
Abundances of P, S, and K in 58 bulge spheroid stars from APOGEE
T0 review · 4 major / 6 minor · reviewed 2026-08-06 · deepseek-v4-flash
Pith's one-line read About a third of 58 old bulge spheroid stars show moderately enhanced phosphorus, an effect seen for the first time in the Milky Way's oldest spheroidal population.
desk verdict The P-enhancement claim in this bulge spheroid sample is new and plausible but not established: K is the solid part, and the single blended P line with a 0.4 dex cross-check offset means the headline needs a calibration check before it carries weight. read the letter →
The pith
A machine-rendered reading of the paper's core claim, the machinery that carries it, and where it could break.
The reading
What carries the argument
The load-bearing object is the P I 16482.932 Å line in the H-band, which is weak and blended with CO molecular lines. The authors anchor the molecular background by recomputing C, N, and O abundances from the CO band-head and the OH and CN lines in the 15520–15590 Å region, then fit the P line via spectrum synthesis with TURBOSPECTRUM and MARCS model atmospheres. The same synthesis isolates the S I 15478.482 Å line and two K I lines, giving abundances for 58 stars based on APOGEE DR17 uncalibrated stellar parameters.
What would settle it
Measure phosphorus abundances in the same stars with an independent set of lines, such as the near-UV P I 2136 Å line or the 10581/10596 Å lines observed in other samples, and check whether the [P/Fe] values reproduce; a systematic disagreement would indicate that the reported phosphorus enhancement is an artifact of the H-band CO deblending.
Extended reading notes
Core claim
For the first time, moderately phosphorus-enhanced stars are found among old bulge spheroid stars. Using spectral synthesis of the P I 16482.932 Å line, with CNO abundances fixed by fitting the CO, OH, and CN features in the 15520–15590 Å region, the authors derive [P/Fe] for 58 stars and find that about one third exceed the local thick-disk and halo trend, reaching up to [P/Fe] ≈ +1.0. The enhanced stars cluster near [Fe/H] ≈ −1.0, coinciding with the P-rich population identified in thick-disk and inner-halo stars, but with more moderate amplitudes. Sulphur behaves as an alpha element, and potassium is reproduced by the models when neutrino-process enhancements are applied.
Load-bearing premise
The central claim rests on the P I 16482.932 Å line being reliably deblended from CO molecular features using CNO abundances that are themselves fixed by fitting a nearby molecular region; if the molecular line data or the CNO values are wrong, the phosphorus abundances shift.
Editorial extensions
If this is right
- Phosphorus enhancement exists in the oldest bulge spheroid population, not only in the thick disk and halo.
- Any proposed nucleosynthesis source for the phosphorus excess must act near [Fe/H] ≈ −1.0 in the early bulge but not at very low metallicities.
- Sulphur behaves as an alpha element in the bulge spheroid, consistent with its production in core-collapse supernovae.
- The H-band contains usable lines for phosphorus, sulphur, and potassium in moderately metal-poor stars, and the paper recommends which lines to use.
- The chemical-evolution models reproduce the potassium trend only when neutrino-process yields are included for odd-Z elements.
Reading between the lines
- The clustering of P-rich stars at [Fe/H] ≈ −1.0 across three independent populations suggests a single enrichment channel tied to a brief early epoch; a testable extension would be to check phosphorus in bulge globular clusters of the same metallicity.
- If the neutrino-process explanation is correct, phosphorus and potassium abundances should correlate with each other across the sample, a correlation the paper does not examine.
- The weak P–Si correlation seen here, compared with the strong one in field P-rich stars, may simply reflect the narrow phosphorus range of this sample; a larger sample spanning [P/Fe] from 0 to +1.5 would settle whether the correlation is real.
Editorial analysis
A structured set of objections, weighed in public.
Referee Report
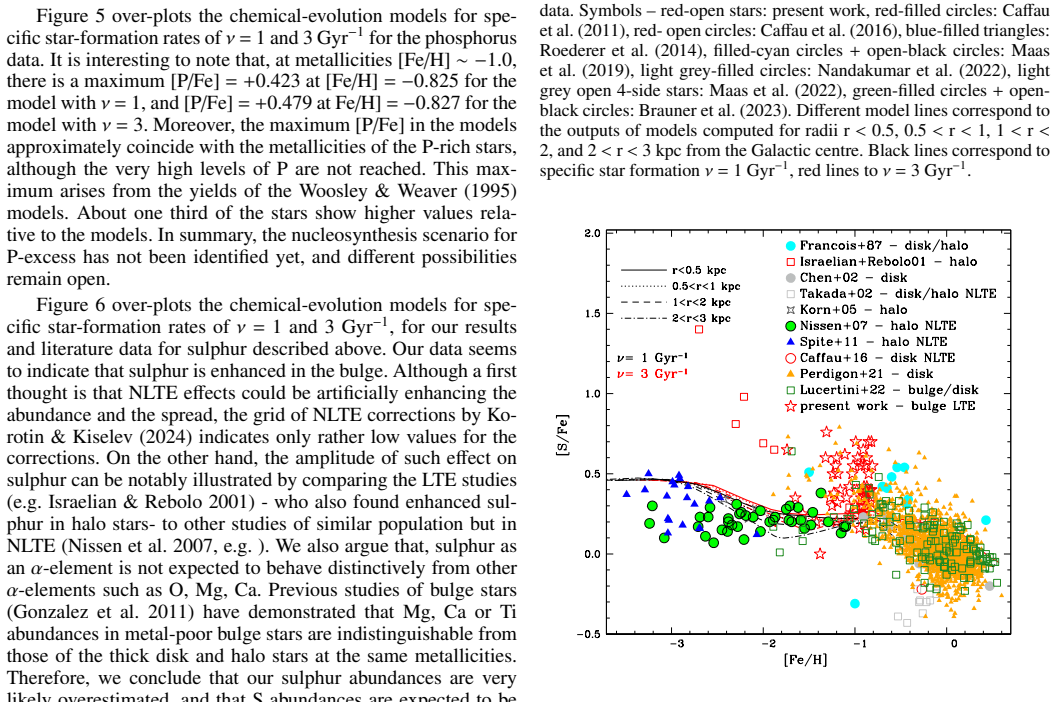
Summary. The paper derives phosphorus, sulphur, and potassium abundances for 58 bulge spheroid stars from APOGEE DR17 H-band spectra, using TURBOSPECTRUM spectral synthesis with MARCS model atmospheres and recomputed CNO abundances. It reports that roughly one third of the sample show moderately enhanced phosphorus ([P/Fe] > +0.45), which the authors describe as the first identification of the P-rich phenomenon in the old bulge spheroid population. The paper also provides line recommendations for the H-band, compares the abundances with APOGEE-ASPCAP values and with literature samples, and compares the combined dataset with chemical-evolution models that include neutrino-process contributions. The results are presented in a table of abundances and in figures comparing the present data with literature data and model curves.
Significance. If the P-rich claim is robust, the paper reports an observationally new phenomenon in an important stellar population: moderate P enhancement in the oldest bulge spheroid stars, reminiscent of P-rich thick-disk and halo stars at [Fe/H] ~ -1.0. This would bear on early chemical enrichment in the central Galaxy and on nucleosynthesis in core-collapse supernovae. The paper also provides useful line recommendations and a table of P, S, and K abundances in a sample that has been characterized kinematically and chemically in previous work, which is valuable for future surveys. However, the central claim currently rests on a single CO-blended P I line, and the comparison with chemical-evolution models is partially calibrated rather than predictive; the significance is therefore conditional until the systematic checks requested below are performed.
major comments (4)
- [Sections 3.1 and 3.2, Table 2] The P-rich claim depends entirely on the reliability of [P/Fe] from the single P I 16482.932 Å line, blended with CO and deblended using CNO abundances fixed from the 15520-15590 Å region. The only sample star with an independent literature measurement, b2 = 2M17173693-2806495, gives [P/Fe] = +0.40 here versus +0.83 from BAWLAS and a conservative upper limit of 1.24 from Brauner et al. (2023). The paper attributes the ~0.4 dex offset to calibrated versus uncalibrated APOGEE parameters, but it does not quantify this by rerunning the analysis with calibrated parameters. Since the adopted P-rich threshold of +0.45 is close to the typical derived values, a systematic offset of this size could change the reported P-rich fraction substantially. The random errors in Table 2 exclude the CNO reference abundances, the molecular line data, the log gf values (not in NIST for these lines), and continuum placement, which the text itself adds as another 0.1 dex for P. The authors should quantify the sensitivity of [P/Fe] to these systematics and report how many stars cross the P-rich threshold under alternative assumptions.
- [Section 5.2] The agreement between the chemical-evolution models and the observed [P/Fe] and [K/Fe] is not an independent test, because the model yields are tuned to the data: the WW95 yields are multiplied by a factor of 2 for P and a factor of 3 for K, with the factors chosen from comparisons with literature observations (Timmes et al. 1995; Caffau et al. 2011). The statements in the Abstract and Conclusions that potassium and sulphur 'fit within the expectations from chemical evolution models' should therefore be presented as post-hoc consistency rather than as a predictive success. The paper would be strengthened by showing the model predictions before the yield scaling is applied, and by stating explicitly that the scaling is a calibration, not a derivation.
- [Sections 4 and 6] The P-rich threshold [P/Fe] > +0.45 appears to be chosen after inspecting the results, and the paper itself notes that Brauner et al. (2023) used a higher threshold of +0.8 for their more extreme sample. Because the central claim is that 'about one third' of the sample is P-rich, the fraction is directly sensitive to an arbitrary threshold placed near the typical values and their uncertainties. The authors should justify the threshold a priori, or alternatively present the full [P/Fe] distribution and report how the P-rich fraction changes across a plausible range of thresholds and systematic offsets.
- [Sections 5.2 and 6] There is an internal tension in the sulphur discussion. Section 5.2 states that 'our sulphur abundances are very likely overestimated,' while the Abstract and Conclusions state that sulphur behaves as an alpha-element and that the models reproduce the data. If the abundances are likely overestimated, then the claimed alpha-element behavior and the model comparison are not supported without first applying the relevant NLTE corrections or demonstrating that the overestimation does not affect the comparison. The authors should either soften the sulphur conclusions or provide the analysis that reconciles the stated overestimation with the conclusions.
minor comments (6)
- [Text and Table .1] The text repeatedly refers to 'Table .1' with a placeholder; the abundance table at the end should be properly numbered and cross-referenced throughout.
- [Table .1] The table mixes present [S/Fe] values with BAWLAS-based values in bold without a clear legend in the table itself; the note describing the bolding should be moved into the table caption or made more prominent.
- [Section 3.2] The continuum-placement uncertainty of 0.1 dex for the P line is stated in the text but is not included in the totals in Table 2; the table should report a total systematic budget that includes this term.
- [Figure 1] The fits to the P I line are described as visual; a quantitative measure of the fit quality, or at least a consistent display of the goodness of fit, would help the reader assess how securely the P abundances are determined in individual stars.
- [Abstract] The phrase 'for the first time' in the Abstract and Conclusions is stronger than the current evidence supports; it should be conditioned on the outcome of the systematic and threshold-sensitivity checks recommended above.
- [Section 2] There is a typo in 'StarHorsedistances'; it should read 'StarHorse distances'. Several other minor typographical issues appear in the acknowledgments, such as 'the the proyecto plan nacional.'
Circularity Check
The chemical-evolution model 'expectations' for P and K are partly calibrated to abundance data, so the model-agreement statements reduce to the adopted yield scaling; the measured P-rich abundances themselves are independent.
-
fitted input called prediction
[Section 5.2, Chemical-evolution models; echoed in Section 6, Conclusions]
"In our calculations, we multiplied the yields from WW95 for subsolar metallicities by a factor 2 for P, and a factor 3 for K. ... The value of this correction comes from the comparison of [P/Fe] vs. [Fe/H] given by Figure 23 of Timmes et al. (1995) and the observations of Caffau et al. (2011). In the case of K, the Galactic chemical evolution model of Timmes et al. (1995), using yields of WW95, shows a sharp drop of [K/Fe] below [Fe/H]≈0.6 in serious disagreement with the observations."
The model curves presented as 'expectations from chemical evolution models' are not independent predictions for the abundance level: the WW95 yields were multiplied by 2 (P) and 3 (K) precisely to fix the disagreement with previously published [P/Fe] and [K/Fe] observations. The later statements that the data 'fit within the expectations' (Abstract) and that the models fit [K/Fe] 'remarkably well' (Section 6) therefore reduce, at the normalization level, to the input scaling. The bulge [P/Fe] measurements were not used in the tuning, so the observed P-rich fraction retains independent content; the circularity is confined to the model-agreement statements.
full rationale
The central abundance measurements are not circular: [P/Fe], [S/Fe], and [K/Fe] are derived by spectral synthesis of H-band lines with TURBOSPECTRUM, MARCS model atmospheres, and CNO abundances fixed from a different spectral region (15520-15590 Å), so the P deblending is not defined in terms of the P result. The sample membership is imported from Razera et al. (2022), a separate published analysis, rather than re-derived here, so that premise is not a reduction of the present measurement. The one substantive circular step is in the chemical-evolution comparison: the WW95 yields are rescaled by factors chosen from literature [P/Fe] and [K/Fe] data, and the paper then presents the resulting model curves as 'expectations' that the data 'fit', with Section 6 explicitly crediting the ν-process and the scaling for the good K fit. This makes the model-agreement claim partly constructed, but it does not force the observational P-rich finding, which stands on the measured line abundances and literature comparisons.
Assumptions & free parameters
free parameters (3)
- WW95 yield multiplier for P =
2
- WW95 yield multiplier for K =
3
- P-rich threshold =
[P/Fe] > +0.45
assumptions (4)
- domain assumption MARCS CN-mild model atmospheres with uncalibrated APOGEE DR17 parameters adequately represent the sample's cool, low-gravity, metal-poor giants.
- domain assumption The APOGEE line list and the region 15520-15590 Å fitting of CO/CN/OH features correctly fix the molecular blending of the P I 16482.932 Å line.
- domain assumption NLTE effects on P are negligible and on K are below 0.1 dex; S NLTE corrections are small per Korotin & Kiselev (2024), which is limited to Teff>=4000 K.
- domain assumption Yields from Woosley & Weaver (1995), with hypernovae for [Fe/H]<-2.5 and neutrino-process enhancements from Yoshida et al. (2008), apply to bulge chemical evolution.
Cite this review
Pith. "Pith review of Abundances of P, S, and K in 58 bulge spheroid stars from APOGEE." pith.science (2026). https://pith.science/paper/SDYSSRFW
@misc{pith2026250711667,
  author       = {Pith},
  title        = {Pith review of: Abundances of P, S, and K in 58 bulge spheroid stars from APOGEE},
  year         = {2026},
  howpublished = {\url{https://pith.science/paper/SDYSSRFW}},
  note         = {Machine review of arXiv:2507.11667}
}
read the original abstract
We have previously studied several elements in 58 selected bulge spheroid stars, based on spectral lines in the H-band. We now derive the abundances of the less-studied elements phosphorus (P; Z=15), sulphur (S; Z=16), and potassium (K; Z=19). The abundances of P, S, and K in 58 bulge spheroid stars are compared both with the results of a previous analysis of the data from the Apache Point Observatory Galactic Evolution Experiment (APOGEE), and with a few available studies of these elements. We derive the individual abundances through spectral synthesis, using the stellar physical parameters available for our sample from the DR17 release of the APOGEE project. We provide recommendations for the best lines to be used for the studied elements among those in the H-band. We also compare the present results, together with literature data, with chemical-evolution models. Finally, the neutrino-process was taken into account for the suitable fit to the odd-Z elements P and K. We confirm that the H-band has useful lines for the derivation of the elements P, S, and K in moderately metal-poor stars. The abundances, plotted together with literature results from high-resolution spectroscopy, indicate that: moderately enhanced phosphorus stars are found, reminiscent results obtained for thick disk and halo stars of metallicity [Fe/H]~-1.0. Therefore, for the first time, we identify this effect to occur in the old stars from the bulge spheroid. Sulphur is an alpha-element and behaves as such. Potassium and sulphur both exhibit some star-to-star scatter, but fit within the expectations from chemical evolution models.
Figures


Figures from the paper (3 more)


Forward citations
Cited by 1 Pith paper
-
Investigating Phosphorus Abundances in a Sample of APOGEE-2 Bulge Globular Clusters
Phosphorus-enhanced stars are found in two of seven bulge globular clusters, and these stars tend to also be nitrogen-rich, hinting at a second-generation origin.
Reference graph
Works this paper leans on
-
[1]
2022, ApJS, 259, 35 Allende Prieto, C., Beers, T
Abdurro’uf, Accetta, K., Aerts, C., et al. 2022, ApJS, 259, 35 Allende Prieto, C., Beers, T. C., Wilhelm, R., et al. 2006, ApJ, 636, 804
2022
-
[2]
& Plez, B
Alvarez, R. & Plez, B. 1998, A&A, 330, 1109
1998
-
[3]
M., Spite, M., Korotin, S
Andrievsky, S. M., Spite, M., Korotin, S. A., et al. 2010, A&A, 509, A88
2010
-
[4]
2025, A&A, 698, A164
Aschenbrenner, P., Butler, K., & Przybilla, N. 2025, A&A, 698, A164
2025
-
[5]
2021, AJ, 161, 167
Ashok, A., Zasowski, G., Seth, A., et al. 2021, AJ, 161, 167
2021
-
[6]
M., & Grevesse, N
Asplund, M., Amarsi, A. M., & Grevesse, N. 2021, A&A, 653, A141
2021
-
[7]
J., & Scott, P
Asplund, M., Grevesse, N., Sauval, A. J., & Scott, P. 2009, ARA&A, 47, 481
2009
- [8]
Show all 85 references
-
[9]
Barbuy, B., Friaça, A. C. S., Ernandes, H., et al. 2024, A&A, 691, A296
2024
-
[10]
Barbuy, B., Friaça, A. C. S., Ernandes, H., et al. 2023, MNRAS, 526, 2365
2023
-
[11]
L., Oelkers, R
Beaton, R. L., Oelkers, R. J., Hayes, C. R., et al. 2021, AJ, 162, 302
2021
-
[12]
& Tsujimoto, T
Bekki, K. & Tsujimoto, T. 2024, ApJ, 967, L1
2024
-
[13]
2016, PASA, 33, e028
Bica, E., Ortolani, S., & Barbuy, B. 2016, PASA, 33, e028
2016
-
[14]
Bica, E., Ortolani, S., Barbuy, B., & Oliveira, R. A. P. 2024, A&A, 687, A201
2024
-
[15]
R., Bershady, M
Blanton, M. R., Bershady, M. A., Abolfathi, B., et al. 2017, AJ, 154, 28
2017
-
[16]
Bowen, I. S. & Vaughan, A. H., J. 1973, Appl. Opt., 12, 1430
1973
-
[17]
A., et al
Brauner, M., Masseron, T., García-Hernández, D. A., et al. 2023, A&A, 673, A123
2023
-
[18]
A., & Lugaro, M
Brauner, M., Pignatari, M., Masseron, T., García-Hernández, D. A., & Lugaro, M. 2024, A&A, 690, A262
2024
-
[19]
2016, A&A, 585, A16
Caffau, E., Andrievsky, S., Korotin, S., et al. 2016, A&A, 585, A16
2016
-
[20]
2011, A&A, 532, A98
Caffau, E., Bonifacio, P., Faraggiana, R., & Steffen, M. 2011, A&A, 532, A98
2011
-
[21]
2004, A&A, 416, 1117
Cayrel, R., Depagne, E., Spite, M., et al. 2004, A&A, 416, 1117
2004
-
[22]
2012, A&A, 540, A33
Cescutti, G., Matteucci, F., Caffau, E., & François, P. 2012, A&A, 540, A33
2012
-
[23]
Q., Nissen, P
Chen, Y . Q., Nissen, P. E., Zhao, G., & Asplund, M. 2002, A&A, 390, 225
2002
-
[24]
2011, Nature, 472, 454
Chiappini, C., Frischknecht, U., Meynet, G., et al. 2011, Nature, 472, 454
2011
-
[25]
Clegg, R. E. S., Lambert, D. L., & Tomkin, J. 1981, ApJ, 250, 262 da Silva, P., Barbuy, B., Ernandes, H., et al. 2024, A&A, 687, A66
1981
-
[26]
2009, AJ, 138, 1577
Daflon, S., Cunha, K., de la Reza, R., Holtzman, J., & Chiappini, C. 2009, AJ, 138, 1577
2009
-
[27]
Ernandes, H., Barbuy, B., Friaça, A. C. S., et al. 2020, A&A, 640, A89 Fernández-Trincado, J. G., Minniti, D., Beers, T. C., et al. 2020, A&A, 643, A145
2020
-
[28]
1987, A&A, 176, 294
Francois, P. 1987, A&A, 176, 294
1987
-
[29]
1988, A&A, 195, 226
Francois, P. 1988, A&A, 195, 226
1988
-
[30]
Friaca, A. C. S. & Terlevich, R. J. 1998, MNRAS, 298, 399 Friaça, A. C. S. & Barbuy, B. 2017, A&A, 598, A121 Gaia Collaboration, Brown, A. G. A., Vallenari, A., et al. 2021, A&A, 649, A1
1998
-
[31]
S., et al
Gao, L., Theuns, T., Frenk, C. S., et al. 2010, MNRAS, 403, 1283 García Pérez, A. E., Allende Prieto, C., Holtzman, J. A., et al. 2016, AJ, 151, 144
2010
-
[32]
C., Dias, B., et al
Geisler, D., Parisi, M. C., Dias, B., et al. 2023, A&A, 669, A115
2023
-
[33]
A., Rejkuba, M., Zoccali, M., et al
Gonzalez, O. A., Rejkuba, M., Zoccali, M., et al. 2011, A&A, 530, A54 González Hernández, J. I. & Bonifacio, P. 2009, A&A, 497, 497
2011
-
[34]
E., Siegmund, W
Gunn, J. E., Siegmund, W. A., Mannery, E. J., et al. 2006, AJ, 131, 2332
2006
-
[35]
2008, A&A, 486, 951
Gustafsson, B., Edvardsson, B., Eriksson, K., et al. 2008, A&A, 486, 951
2008
-
[36]
2023, in American Astronomical So- ciety Meeting Abstracts, V ol
Hayes, C., Masseron, T., Sobeck, J., et al. 2023, in American Astronomical So- ciety Meeting Abstracts, V ol. 241, American Astronomical Society Meeting Abstracts, 401.07
2023
-
[37]
R., Masseron, T., Sobeck, J., et al
Hayes, C. R., Masseron, T., Sobeck, J., et al. 2022, ApJS, 262, 34
2022
-
[38]
2021, arXiv e-prints, arXiv:2104.02829
Hubeny, I., Allende Prieto, C., Osorio, Y ., & Lanz, T. 2021, arXiv e-prints, arXiv:2104.02829
2021 arXiv
- [39]
-
[40]
& Rebolo, R
Israelian, G. & Rebolo, R. 2001, ApJ, 557, L43
2001
-
[41]
1999, ApJS, 125, 439
Iwamoto, K., Brachwitz, F., Nomoto, K., et al. 1999, ApJS, 125, 439
1999
-
[42]
R., Thanathibodee, T., Frebel, A., et al
Jacobson, H. R., Thanathibodee, T., Frebel, A., et al. 2014, ApJ, 796, L24 Jönsson, H., Holtzman, J. A., Allende Prieto, C., et al. 2020, AJ, 160, 120
2014
-
[43]
Karakas, A. I. & Lugaro, M. 2016, ApJ, 825, 26
2016
-
[44]
2006, ApJ, 653, 1145
Kobayashi, C., Umeda, H., Nomoto, K., Tominaga, N., & Ohkubo, T. 2006, ApJ, 653, 1145
2006
-
[45]
Korn, A. J. & Ryde, N. 2005, A&A, 443, 1029
2005
-
[46]
2017, in Astronomi- cal Society of the Pacific Conference Series, V ol
Korotin, S., Andrievsky, S., Caffau, E., & Bonifacio, P. 2017, in Astronomi- cal Society of the Pacific Conference Series, V ol. 510, Stars: From Collapse to Collapse, ed. Y . Y . Balega, D. O. Kudryavtsev, I. I. Romanyuk, & I. A. Yakunin, 141
2017
-
[47]
Korotin, S. A. & Kiselev, K. O. 2024, Astronomy Reports, 68, 1159
2024
-
[48]
& Bell, B
Kurucz, R. & Bell, B. 1995, Robert Kurucz CD-ROM, 23
1995
-
[49]
2022, A&A, 657, A29
Lucertini, F., Monaco, L., Caffau, E., Bonifacio, P., & Mucciarelli, A. 2022, A&A, 657, A29
2022
-
[50]
2021, MNRAS, 501, 5981
Lucey, M., Hawkins, K., Ness, M., et al. 2021, MNRAS, 501, 5981
2021
-
[51]
G., Cescutti, G., & Pilachowski, C
Maas, Z. G., Cescutti, G., & Pilachowski, C. A. 2019, AJ, 158, 219
2019
-
[52]
G., Hawkins, K., Hinkel, N
Maas, Z. G., Hawkins, K., Hinkel, N. R., et al. 2022, AJ, 164, 61
2022
-
[53]
R., Schiavon, R
Majewski, S. R., Schiavon, R. P., Frinchaboy, P. M., et al. 2017, AJ, 154, 94
2017
-
[54]
2021, A&A Rev., 29, 5
Matteucci, F. 2021, A&A Rev., 29, 5
2021
-
[55]
2022, A&A, 668, A88
Nandakumar, G., Ryde, N., Montelius, M., et al. 2022, A&A, 668, A88
2022
-
[56]
Nelder, J. A. & Mead, H. 1965, The Computer Journal, 7, 308–313
1965
-
[57]
L., Holtzman, J
Nidever, D. L., Holtzman, J. A., Allende Prieto, C., et al. 2015, AJ, 150, 173
2015
-
[58]
E., Akerman, C., Asplund, M., et al
Nissen, P. E., Akerman, C., Asplund, M., et al. 2007, A&A, 469, 319
2007
-
[59]
2013, ARA&A, 51, 457
Nomoto, K., Kobayashi, C., & Tominaga, N. 2013, ARA&A, 51, 457
2013
-
[60]
2021, A&A, 647, A162 Pérez-Villegas, A., Barbuy, B., Kerber, L
Perdigon, J., de Laverny, P., Recio-Blanco, A., et al. 2021, A&A, 647, A162 Pérez-Villegas, A., Barbuy, B., Kerber, L. O., et al. 2020, MNRAS, 491, 3251
2021
-
[61]
2016, ApJS, 225, 24
Pignatari, M., Herwig, F., Hirschi, R., et al. 2016, ApJS, 225, 24
2016
-
[62]
H., Elsworth, Y
Pinsonneault, M. H., Elsworth, Y . P., Tayar, J., et al. 2018, ApJS, 239, 32 Planck Collaboration, Aghanim, N., Akrami, Y ., et al. 2020, A&A, 641, A6
2018
-
[63]
2012, Turbospectrum: Code for spectral synthesis, Astrophysics Source Code Library, record ascl:1205.004
Plez, B. 2012, Turbospectrum: Code for spectral synthesis, Astrophysics Source Code Library, record ascl:1205.004
2012
-
[64]
Queiroz, A. B. A., Anders, F., Santiago, B. X., et al. 2018, MNRAS, 476, 2556
2018
-
[65]
Queiroz, A. B. A., Chiappini, C., Perez-Villegas, A., et al. 2021, A&A, 656, A156
2021
-
[66]
C., et al
Razera, R., Barbuy, B., Moura, T. C., et al. 2022, MNRAS, 517, 4590
2022
-
[67]
Reinhard, M. V . & Laird, J. B. 2024, AJ, 167, 6
2024
-
[68]
U., Jacobson, H
Roederer, I. U., Jacobson, H. R., Thanathibodee, T., Frebel, A., & Toller, E. 2014, ApJ, 797, 69
2014
-
[69]
U., Placco, V
Roederer, I. U., Placco, V . M., & Beers, T. C. 2016, ApJ, 824, L19
2016
-
[70]
J., Ortolani, S., Barbuy, B., Bica, E., & Bonfanti, A
Rossi, L. J., Ortolani, S., Barbuy, B., Bica, E., & Bonfanti, A. 2015, MNRAS, 450, 3270
2015
-
[71]
& Pakhomov, Y
Ryabchikova, T. & Pakhomov, Y . 2015, Baltic Astronomy, 24, 453
2015
-
[72]
& Nishimura, M
Sadakane, K. & Nishimura, M. 2022, PASJ, 74, 298
2022
-
[73]
V ., Cunha, K., Smith, V
Sales-Silva, J. V ., Cunha, K., Smith, V . V ., et al. 2024, ApJ, 965, 119
2024
-
[74]
A., Beaton, R
Santana, F. A., Beaton, R. L., Covey, K. R., et al. 2021, AJ, 162, 303
2021
-
[75]
X., Brauer, D
Santiago, B. X., Brauer, D. E., Anders, F., et al. 2016, A&A, 585, A42
2016
-
[76]
V ., Bizyaev, D., Cunha, K., et al
Smith, V . V ., Bizyaev, D., Cunha, K., et al. 2021, AJ, 161, 254
2021
-
[77]
M., et al
Spite, M., Caffau, E., Andrievsky, S. M., et al. 2011, A&A, 528, A9
2011
-
[78]
2002, ApJ, 573, 614
Takada-Hidai, M., Takeda, Y ., Sato, S., et al. 2002, ApJ, 573, 614
2002
-
[79]
2016, PASJ, 68, 81
Takeda, Y ., Omiya, M., Harakawa, H., & Sato, B. 2016, PASJ, 68, 81
2016
-
[80]
X., Woosley, S
Timmes, F. X., Woosley, S. E., & Weaver, T. A. 1995, ApJS, 98, 617 van den Hoek, L. B. & Groenewegen, M. A. T. 1997, A&AS, 123, 305
1995
-
[81]
C., Hearty, F
Wilson, J. C., Hearty, F. R., Skrutskie, M. F., et al. 2019, PASP, 131, 055001
2019
-
[82]
H., Turk, M
Wise, J. H., Turk, M. J., Norman, M. L., & Abel, T. 2012, ApJ, 745, 50
2012
-
[83]
Woosley, S. E. & Weaver, T. A. 1995, in American Institute of Physics Confer- ence Series, V ol. 327, Nuclei in the Cosmos III, ed. M. Busso, C. M. Raiteri, & R. Gallino (AIP), 365
1995
-
[84]
2008, ApJ, 686, 448
Yoshida, T., Suzuki, T., Chiba, S., et al. 2008, ApJ, 686, 448
2008
-
[85]
W., Gehren, T., Butler, K., Shi, J
Zhang, H. W., Gehren, T., Butler, K., Shi, J. R., & Zhao, G. 2006, A&A, 457, 645 Article number, page 9 of 10 A&A proofs:manuscript no. psk Table .1.Internal and 2MASS star identification, the ASPCAP uncalibrated stellar parameters, recomputed C, N, O abundances, the abundance...
2006
Reviewed August 6, 2026 · model on record in the stance chip above.
Discussion (0). Continue with ORCID to comment.