REVIEW 3 major objections 5 minor 7 cited by
A hydrodynamical simulations-based model that connects the FRB DM--redshift relation to suppression of the matter power spectrum via feedback
T0 review · 3 major / 5 minor · reviewed 2026-08-16 · deepseek-v4-flash
Pith's one-line read This paper argues that the sightline-to-sightline scatter in fast radio burst dispersion measures, modeled as a log-normal distribution whose moments are computed from the feedback-dependent electron power spectrum, can constrain baryonic…
desk verdict A useful, honest replacement for the F-parameter that ties FRB DM scatter to the electron power spectrum; the headline forecasts are self-consistency checks, but the framework is worth refereeing. read the letter →
The pith
A machine-rendered reading of the paper's core claim, the machinery that carries it, and where it could break.
The reading
What carries the argument
The load-bearing object is the log-normal ansatz for $p(\mathrm{DM}_{\rm cosmic}|z)$, specified by two analytically computed moments. The mean is $\langle\mathrm{DM}_{\rm cosmic}(z_s)\rangle = \int_0^{z_s} \frac{3c\chi_e\Omega_b H_0}{8\pi G m_p} \frac{f_d(z)(1+z)\,dz}{\sqrt{\Omega_m(1+z)^3+\Omega_\Lambda}}$, and the variance is $\sigma^2[\mathrm{DM}_{\rm cosmic}(z_s)] = \int_0^{\chi_s} d\chi\, W_{\rm DM}^2(\chi) \int_0^\infty \frac{k\,dk}{2\pi} P_{ee}(k,z(\chi))$, where $P_{ee}$ is the electron power spectrum, the Fourier-space clustering of the free-electron density contrast. The paper calibrates $P_{ee}(k,z)$ as a function of two cosmological and four feedback parameters using nearest-neighbor interpolation on 1,000 hydrodynamical simulations, then feeds the moments into a per-FRB likelihood that is sampled with MCMC to constrain the parameters and the suppression ratio.
What would settle it
Take many mock FRB sightlines from a strong-feedback hydrodynamical simulation and measure the third and fourth moments of $\mathrm{DM}_{\rm cosmic}$ directly; if they disagree with the log-normal values implied by the fitted mean and variance, or if a simulation-based likelihood gives different posteriors on $P_{\rm hydro}/P_{\rm gravity-only}$ than the log-normal likelihood, the central claim is falsified.
Extended reading notes
Core claim
The central claim is that the log-normal parameterization $p(\mathrm{DM}_{\rm cosmic}|z)$, fully defined by its mean and variance, describes simulated FRB dispersion measures better than the standard $F$-parameterization, and that the variance computed from $P_{ee}(k,z)$ carries the feedback signal. Because the variance integral is dominated by scales out to $k\sim10\,h\,\mathrm{Mpc}^{-1}$, the scatter between FRB sightlines at fixed redshift responds to the same baryonic feedback that suppresses the matter power spectrum. Using the calibrated model, the paper reports that 10,000 FRBs would recover the true suppression ratio $P_{\rm hydro}/P_{\rm gravity-only}$ within 0.6, 2, 8, and 15 percent at $k=0.5,1,10,$ and $50\,h\,\mathrm{Mpc}^{-1}$, and that the same model recovers the suppression in simulations with substantially different feedback physics.
Load-bearing premise
The inference depends on the assumption that the cosmic dispersion measure at a fixed redshift is exactly log-normal, which the paper concedes has no rigorous derivation; if the true distribution has different skewness or a heavier tail, the feedback constraints could be biased.
Editorial extensions
If this is right
- With $10^4$ localized FRBs, the baryonic suppression ratio $P_{\rm hydro}/P_{\rm gravity-only}$ can be constrained to 0.6% at $k=0.5\,h\,\mathrm{Mpc}^{-1}$ and about 8% at $k=10\,h\,\mathrm{Mpc}^{-1}$, reaching the accuracy needed for upcoming weak-lensing cosmology.
- Even today's roughly $10^2$ localized FRBs would constrain the suppression to 1-3% at large scales and 12-20% at $k\sim10$-$50\,h\,\mathrm{Mpc}^{-1}$.
- The redshift evolution of the DM variance is included by construction, so the model avoids the assumptions behind the $F$-parameter (Poisson halo statistics and $\sigma_{\rm DM}=F z^{-1/2}$) that can bias feedback estimates by 20-40%.
- The same calibrated model recovers the suppression in simulations with substantially different subgrid feedback physics, so it is not tied to one feedback prescription.
- Constrained feedback parameters translate directly into predictions for baryon fractions in galaxy groups and clusters and for halo gas profiles within standard halo-model analyses.
Reading between the lines
- Because the DM variance is an integral over $P_{ee}(k,z)$, it carries limited scale information; the paper's shape recovery relies on the correlation between feedback parameters and $P_{ee}$. An extension the authors do not make is to use the angular correlation of DM across neighboring sightlines, which would measure $P_{ee}(k,z)$ by scale and could break remaining degeneracies.
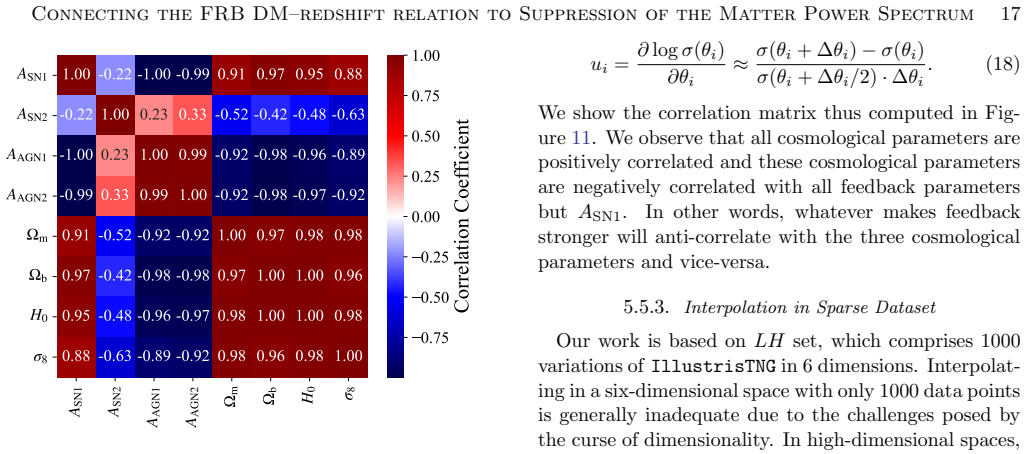
- The paper reports strong degeneracies between $H_0$, $\Omega_m$, and the feedback parameters; a natural next step, not taken here, is a joint FRB plus lensing plus kinematic/thermal Sunyaev-Zel'dovich analysis that could separate cosmological from feedback effects.
- The authors note that roughly 10% of the variance comes from scales larger than their simulation box; re-running the calibration on a larger-volume suite would likely tighten the large-scale suppression constraints and test whether the reported percent-level numbers are optimistic.
Signed reviews
Editorial analysis
A structured set of objections, weighed in public.
Referee Report
Summary. The paper presents a simulation-based formalism for connecting the FRB dispersion-measure–redshift relation to baryonic feedback and the suppression of the matter power spectrum. The authors parameterize p(DMcosmic|z) as a log-normal whose mean is computed from the cosmological mean electron density (Eq. 5) and whose variance is computed from the electron power spectrum Pee(k,z) via Eq. (11). They calibrate Pee(k,z) and the matter-power-spectrum suppression Phydro/Pgravity-only to the CAMELS IllustrisTNG Latin-hypercube suite as functions of four feedback parameters and two cosmological parameters, using nearest-neighbor interpolation. They compare the log-normal form against the Macquart F-parameterization, argue that the F-parameter misestimates the DM variance and introduces biases in Pmm, and then perform MCMC forecasts with mock FRB samples drawn from the model itself. They report that 10^4 FRBs can constrain Phydro/Pgravity-only to percent-level precision at large scales and about 10% precision at k ~ 10 h/Mpc, with a prior-to-posterior width ratio of about 20. They also apply the IllustrisTNG-calibrated model to Astrid and SIMBA fiducial runs and claim that it recovers the true Pmm suppression. The paper includes a detailed caveats section covering large-scale variance, parameter degeneracies, sparse interpolation, selection effects, and the lack of a rigorous derivation of log-normality.
Significance. If the central claims hold, this is a valuable contribution: it provides a physically interpretable replacement for the ad hoc F-parameter, exploits the redshift-dependent DM variance that is automatically built into simulations, and links FRB observables to baryonic feedback at scales k ~ 10 h/Mpc, which are relevant for upcoming weak-lensing surveys. The analytic moment formalism in Eqs. (5) and (11) is standard and is applied in a novel way, and the use of the CAMELS suite to span diverse feedback scenarios is appropriate. The paper also gives a clear and honest caveats section, and it demonstrates concrete gains over the Macquart parameterization, which is a useful result in itself. However, as detailed below, the main forecast precision is currently a self-consistency result, and the log-normal shape assumption is not directly validated against simulated sightlines. The significance of the paper will be substantially higher if the authors add a quantitative distributional validation and reframe or robustify the forecast claims.
major comments (3)
- The log-normal shape of p(DMcosmic|z) is load-bearing for the central forecast, but the validation path is circular. In §5.2 and Fig. 9, mock DMcosmic samples are drawn from the analytically constructed log-normal p(DMcosmic|z), and the likelihood in Eqs. (15)–(16) uses exactly the same log-normal form. The MCMC recovery tests in §5.3 and §5.4 therefore verify only that parameters are recovered under the assumed likelihood, not that the log-normal assumption is adequate. The only direct comparison with simulated sightline DM distributions is Fig. 2, which is qualitative, limited to IllustrisTNG, and does not include a quantitative goodness-of-fit or tail comparison; no such check is shown for Astrid or SIMBA. Since the reported Pmm-suppression constraints in Table 1 and Fig. 10 could be biased if the true distribution has heavier tails or different skewness, the paper should add a quantitative distributional validation (e.g., quantile–quantile plots, Kolmogorov–Smirnov or Anderson–Darling tests, or tail-index comparisons) against actual sightline DM in IllustrisTNG, Astrid, and SIMBA at several redshifts, and/or a robustness test with an alternative likelihood form to bound the potential bias.
- [§5.5.1, §5.5.3, Table 1] The forecast precision quoted in the abstract and Table 1 is presented as the expected constraining power with 10^4 FRBs, but it is a self-consistency check that does not include the systematic uncertainties acknowledged in §5.5. The 25 h^-1 Mpc CAMELS box misses about 4–10% of the DM variance from large scales (§5.5.1), and nearest-neighbor interpolation in a 6-dimensional space with 1000 calibration points is sparse (§5.5.3). Because the mock catalogs are generated from the same calibrated model that is fitted, the 68% widths in Table 1 and Fig. 10 do not propagate these errors. The claims such as 'percent-level precision at large scales and ~10% precision at k ≳ 10 h/Mpc' should either be explicitly reframed as conditional on the model and its known limitations, or the identified systematic uncertainties should be propagated into the quoted errors. As written, the forecast overstates the current state of the model.
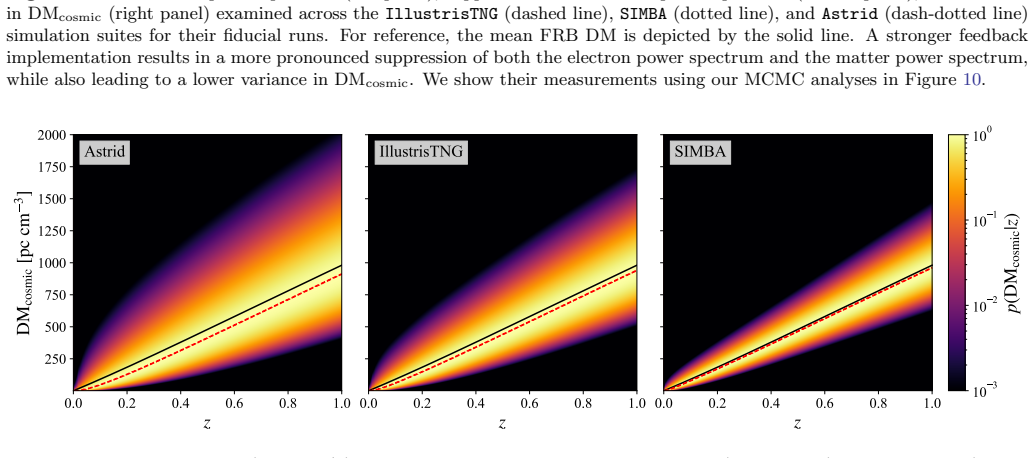
- [§5.4, Fig. 10] The cross-simulation validation for Astrid and SIMBA is a useful transfer test, but it inherits the same log-normal assumption: the mock samples for these simulations are drawn from the analytically constructed p(DMcosmic|z) in Fig. 9, not from actual sightline distributions. The test therefore demonstrates that the IllustrisTNG-calibrated Pee interpolation can reproduce the Pmm suppression of other feedback implementations under the assumed likelihood, but it does not test whether the log-normal shape holds for Astrid or SIMBA. In addition, the reported recovery accuracy for SIMBA at large scales (2.5% at k=0.5 h/Mpc) and Astrid at k=50 h/Mpc (32%) is noticeably worse than the IllustrisTNG values; the attribution of the large-scale discrepancy to the CAMELS box size is plausible but should be quantified, e.g., by comparing against a larger-volume simulation or by estimating the variance contributed by modes larger than the box.
minor comments (5)
- [Abstract] The abstract contains a typo: 'upto' should be 'up to'.
- [Fig. 3 caption] The caption contains a typo: 'feedack strength' should be 'feedback strength'.
- [§3.1.1] The discussion of Zhang et al. (2021) is slightly confusing: the text says 'in contrast to the findings of Zhang et al. (2021), we find that this functional form provides a poor fit', but then says 'we reanalyze their data and provide the updated fits'. Please clarify whether the reanalysis reproduces their data or uses a different fitting procedure, and state the normalization condition explicitly relative to their Table 1 and Figure 2.
- [Table 1] The 68% intervals for SP(k=50) and for logASN2 at N_FRB=10^4 are asymmetric and in some cases the upper or lower error bar is much smaller than the other; a note on how the percentiles are computed (highest posterior density interval versus equal-tailed interval) would aid interpretation.
- [Fig. 10] In the bottom panels of Fig. 10, the legend distinguishes 'Best Fit' from 'Posterior', but the text does not define what 'Best Fit' refers to (maximum a posteriori value?); please define this in the caption or text.
Circularity Check
Validation and forecast mocks are drawn from the same log-normal likelihood being fitted, so the reported constraints and cross-simulation recovery are partly self-consistency results.
-
fitted input called prediction
[§5.2 Mock FRB Samples Generation; §5.3 Likelihood Analysis and Model Validation; Eqs. 15–16; Fig. 9–10; Table 1.]
"The DM cosmic−z relations for the fiducial runs of these simulations, constructed using our methodology of analytically computing the ⟨DMcosmic(z)⟩ and the σ2[DMcosmic(z)] of the p(DMcosmic|z) distribution with log-normal parameterization are shown in Figure 9. ... For our MCMC analysis, we generate mock samples of DM cosmic by sampling from the p(DMcosmic|z) distribution."
The mock 'data' are drawn from the very log-normal p(DMcosmic|z) that the likelihood in Eqs. 15–16 assumes and that is built from the same mean (Eq. 5) and variance (Eq. 11) model being calibrated. The MCMC recovery, Table 1, and Figure 10 therefore verify parameter retrieval under the exact assumed likelihood, not whether the model describes actual simulated sightline DMs. For SIMBA and Astrid the same analytic log-normal construction is used, so the reported 'recovery' of Phydro/Pgravity−only inherits the log-normal shape by construction. Section 5.5.5 concedes 'the absence of a rigorous theoretical derivation' and defers likelihood-free tests to future work, confirming that the shape assumption is load-bearing rather than independently validated.
full rationale
The analytical derivation of the DM moments is self-contained: Eq. 5 follows from the electron-density integral and Eq. 11 from the Limber-approximated angular power spectrum, with neither reducing to the target result. The Pee(k,z) calibration on the CAMELS LH dataset and the transfer of variances to SIMBA/Astrid use genuinely external simulation power spectra, and Fig. 2 provides an out-of-sample comparison of the log-normal shape against actual IllustrisTNG sightline DMs from Zhang et al. (2021). The circular component is the validation/forecast pipeline: mocks in §5.2 are sampled from the analytically constructed log-normal p(DMcosmic|z), and the likelihood in Eqs. 15–16 uses the same log-normal form. Consequently, the reported constraints and the cross-simulation recovery demonstrate self-consistency of the assumed likelihood rather than an independent test against simulated sightline distributions. The paper's own §5.5.5 admits that log-normality has no rigorous derivation, making the shape assumption load-bearing for the Pmm-suppression forecasts; if the true distribution has heavier tails or different skewness, the quoted precision could be biased. The partial independence provided by Fig. 2 and the use of real simulation power spectra for Pee prevent this from being a fully circular derivation, but the central validation claims are substantially self-referential.
Assumptions & free parameters
free parameters (7)
- A_SN1 =
0 (fiducial), prior [-0.6, 0.6]
- A_SN2 =
0 (fiducial), prior [-0.3, 0.3]
- A_AGN1 =
0 (fiducial), prior [-0.6, 0.6]
- A_AGN2 =
0 (fiducial), prior [-0.3, 0.3]
- f_d =
0.9 (fixed by hand)
- mu_host =
5 (fiducial), prior [4, 6]
- sigma_host =
0.5 (fiducial), prior [0.2, 1]
assumptions (5)
- domain assumption p(DMcosmic|z) is log-normal with moments given by Equations 5 and 11.
- domain assumption The electron power spectrum P_ee(k,z) from the CAMELS IllustrisTNG LH simulations spans the real range of baryonic feedback.
- domain assumption FRB sightlines are statistically independent and covariance induced by large-scale structure is negligible.
- domain assumption Diffuse baryon fraction f_d is fixed to 0.9 for mock generation and analysis.
- domain assumption Host galaxy DM follows a log-normal distribution with mu_host=5 and sigma_host=0.5.
Cite this review
Pith. "Pith review of A hydrodynamical simulations-based model that connects the FRB DM--redshift relation to suppression of the matter power spectrum via feedback." pith.science (2026). https://pith.science/paper/SEXA3E3E
@misc{pith2026250418745,
  author       = {Pith},
  title        = {Pith review of: A hydrodynamical simulations-based model that connects the FRB DM--redshift relation to suppression of the matter power spectrum via feedback},
  year         = {2026},
  howpublished = {\url{https://pith.science/paper/SEXA3E3E}},
  note         = {Machine review of arXiv:2504.18745}
}
abstract
Understanding the impact of baryonic feedback on the small-scale ($k \gtrsim 1\,h\,$Mpc$^{-1}$) matter power spectrum is a key astrophysical challenge, and essential for interpreting data from upcoming weak-lensing surveys, which require percent-level accuracy to fully harness their potential. Astrophysical probes, such as the kinematic and thermal Sunyaev-Zel'dovich effects, have been used to constrain feedback at large scales ($k \lesssim 5\,h\,$Mpc$^{-1}$). The sightline-to-sightline variance in the fast radio bursts (FRBs) dispersion measure (DM) correlates with the strength of baryonic feedback and offers unique sensitivity at scales upto $k \sim 10\,h\,$Mpc$^{-1}$. We develop a new simulation-based formalism in which we parameterize the distribution of DM at a given redshift, $p(\mathrm{DM}|z)$, as a log-normal with its first two moments computed analytically in terms of cosmological parameters and the feedback-dependent electron power spectrum $P_\mathrm{ee}(k, z)$. We find that the log-normal parameterization provides an improved description of the $p(\mathrm{DM}|z)$ distribution observed in hydrodynamical simulations as compared to the standard $F$-parameterization. Our model robustly captures the baryonic feedback effects across a wide range of baryonic feedback prescriptions in hydrodynamical simulations, including IllustrisTNG, SIMBA and Astrid. Leveraging simulations incorporates the redshift evolution of the DM variance by construction and facilitates the translation of constrained feedback parameters to the suppression of matter power spectrum relative to gravity-only simulations. We show that with $10^4$ FRBs, the suppression can be constrained to percent-level precision at large scales and $\sim 10$\% precision at scales $k \gtrsim 10\,h\,$Mpc$^{-1}$ with prior-to-posterior $1\sigma$ constraint width ratio $\gtrsim 20$.
Figures


Figures from the paper (10 more)





Forward citations
Cited by 7 Pith papers
-
Ray-tracing Fast Radio Bursts Through IllustrisTNG: Cosmological Dispersion Measures from Redshift 0 to 5.5
A new continuous ray-tracing method through IllustrisTNG's Voronoi mesh yields accurate FRB dispersion measure catalogs from redshift 0 to 5.5 and a functional fit that beats the log-normal.
-
A new measurement of the FRB DM-galaxy cross correlation and a first joint analysis with the kinematic SZ effect
The FRB DM-galaxy cross-correlation is detected at 6.5 sigma and disfavors a no-feedback baryon distribution at about 9 sigma.
-
Probing baryonic feedback and cosmology with 3$\times$2-point statistic of FRBs and galaxies
A Fisher forecast shows that combining FRB dispersion-measure correlations with galaxy clustering can constrain baryonic feedback to about 3% and cosmological parameters to 10-18% with 10^4 FRBs.
-
Time-Dependent Cosmic Ray Halos from Bursty Star Formation and Active Galactic Nuclei: Semi-Analytic Formalism and Galaxy Formation Implications
Time-dependent injection from bursty star formation or episodic black hole accretion substantially modifies cosmic ray pressure profiles in massive galaxy halos, flattening them at large radii relative to steady-state...
-
Stellar Mass-Dispersion Measure Correlations Constrain Baryonic Feedback in Fast Radio Burst Host Galaxies
Using 20 low-redshift fast radio burst hosts, the authors find host dispersion measure decreases with stellar mass, a trend that conflicts with the weak-feedback CAMELS-Astrid simulation.
-
Measurement of the Dispersion$\unicode{x2013}$Galaxy Cross-Power Spectrum with the Second CHIME/FRB Catalog
FRB dispersion and foreground galaxy density are spatially correlated at 5.1 sigma, with a fitted plasma clustering cutoff near 0.9 Mpc, measured from 2,873 CHIME FRBs and about 6 million DESI galaxies.
-
The FRB--Galaxy Overdensity Cross-Correlation Statistic in Dispersion Space
A dispersion-binned FRB–galaxy cross-correlation contains the DM–galaxy cross-correlation as a moment, giving strictly more information and forecasted SNR gains for CHIME and CHORD.
Reference graph
Works this paper leans on
-
[1]
G., Aguilar, J., Ahlen, S., et al
Adame, A. G., Aguilar, J., Ahlen, S., et al. 2025, JCAP, 2025, 021, doi: 10.1088/1475-7516/2025/02/021
-
[2]
2017, MNRAS, 470, 2617, doi: 10.1093/mnras/stx721
Alam, S., Ata, M., Bailey, S., et al. 2017, MNRAS, 470, 2617, doi: 10.1093/mnras/stx721
-
[3]
Amon, A., Gruen, D., Troxel, M. A., et al. 2022, PhRvD, 105, 023514, doi: 10.1103/PhysRevD.105.023514
-
[4]
2024, The Open Journal of Astrophysics, 7, 108, doi: 10.33232/001c.126788 Aric` o, G., Angulo, R
Anbajagane, D., Pandey, S., & Chang, C. 2024, The Open Journal of Astrophysics, 7, 108, doi: 10.33232/001c.126788 Aric` o, G., Angulo, R. E., Contreras, S., et al. 2021, MNRAS, 506, 4070, doi: 10.1093/mnras/stab1911 Aric` o, G., Angulo, R. E., Hern´ andez-Monteagudo, C., et al. 2020, MNRAS, 495, 4800, doi: 10.1093/mnras/staa1478 22 Sharma et al
-
[5]
Bannister, K. W., Deller, A. T., Phillips, C., et al. 2019, Science, 365, 565, doi: 10.1126/science.aaw5903
-
[6]
Baptista, J., Prochaska, J. X., Mannings, A. G., et al. 2024, ApJ, 965, 57, doi: 10.3847/1538-4357/ad2705
-
[7]
A., Irsic, V., Amon, A., & Sijacki, D
Bigwood, L., Bourne, M. A., Irsic, V., Amon, A., & Sijacki, D. 2025, arXiv e-prints, arXiv:2501.16983, doi: 10.48550/arXiv.2501.16983
-
[8]
2024, MNRAS, 534, 655, doi: 10.1093/mnras/stae2100
Bigwood, L., Amon, A., Schneider, A., et al. 2024, MNRAS, 534, 655, doi: 10.1093/mnras/stae2100
Show all 111 references
-
[9]
2022, MNRAS, 512, 3703, doi: 10.1093/mnras/stac648
Bird, S., Ni, Y., Di Matteo, T., et al. 2022, MNRAS, 512, 3703, doi: 10.1093/mnras/stac648
2022 doi
-
[10]
E., Klein, M., Abbot, T
Bleem, L. E., Klein, M., Abbot, T. M. C., et al. 2024, The Open Journal of Astrophysics, 7, 13, doi: 10.21105/astro.2311.07512
2024 arXiv
-
[11]
Bocquet, S., Saro, A., Dolag, K., & Mohr, J. J. 2016, MNRAS, 456, 2361, doi: 10.1093/mnras/stv2657
2016 doi
-
[12]
E., et al
Bocquet, S., Grandis, S., Bleem, L. E., et al. 2024, PhRvD, 110, 083510, doi: 10.1103/PhysRevD.110.083510 B¨ ohm, V., Hilbert, S., Greiner, M., & Enßlin, T. A. 2017, PhRvD, 96, 123510, doi: 10.1103/PhysRevD.96.123510
2024 doi
-
[13]
A., Vavagiakis, E
Calafut, V., Gallardo, P. A., Vavagiakis, E. M., et al. 2021, PhRvD, 104, 043502, doi: 10.1103/PhysRevD.104.043502
2021 doi
-
[14]
J., Wharton, R
Chatterjee, S., Law, C. J., Wharton, R. S., et al. 2017, Nature, 541, 58, doi: 10.1038/nature20797
2017 doi
-
[15]
E., Mead, A
Chisari, N. E., Mead, A. J., Joudaki, S., et al. 2019, The Open Journal of Astrophysics, 2, 4, doi: 10.21105/astro.1905.06082
2019 arXiv
-
[16]
2017, MNRAS, 466, 1444, doi: 10.1093/mnras/stw2106
Clerkin, L., Kirk, D., Manera, M., et al. 2017, MNRAS, 466, 1444, doi: 10.1093/mnras/stw2106
2017 doi
- [17]
-
[18]
J., Pettini, M., Nollett, K
Cooke, R. J., Pettini, M., Nollett, K. M., & Jorgenson, R. 2016, ApJ, 830, 148, doi: 10.3847/0004-637X/830/2/148
2016 doi
-
[19]
J., Pettini, M., & Steidel, C
Cooke, R. J., Pettini, M., & Steidel, C. C. 2018, ApJ, 855, 102, doi: 10.3847/1538-4357/aaab53
2018 doi
- [20]
-
[21]
2023, PhRvD, 108, 123519, doi: 10.1103/PhysRevD.108.123519 Dark Energy Survey and Kilo-Degree Survey Collaboration,
Dalal, R., Li, X., Nicola, A., et al. 2023, PhRvD, 108, 123519, doi: 10.1103/PhysRevD.108.123519 Dark Energy Survey and Kilo-Degree Survey Collaboration,
2023 doi
-
[22]
Abbott, T. M. C., Aguena, M., et al. 2023, The Open Journal of Astrophysics, 6, 36, doi: 10.21105/astro.2305.17173 Dav´ e, R., Angl´ es-Alc´ azar, D., Narayanan, D., et al. 2019, MNRAS, 486, 2827, doi: 10.1093/mnras/stz937
2023 arXiv
-
[23]
2023, JCAP, 2023, 054, doi: 10.1088/1475-7516/2023/07/054 DESI Collaboration, Adame, A
DeRose, J., Kokron, N., Banerjee, A., et al. 2023, JCAP, 2023, 054, doi: 10.1088/1475-7516/2023/07/054 DESI Collaboration, Adame, A. G., Aguilar, J., et al. 2024, arXiv e-prints, arXiv:2411.12022, doi: 10.48550/arXiv.2411.12022 Di Valentino, E., Levi Said, J., Riess, A., et al...
-
[24]
M., et al
Dolag, K., Remus, R.-S., Valenzuela, L. M., et al. 2025, arXiv e-prints, arXiv:2504.01061, doi: 10.48550/arXiv.2504.01061
2025 doi
-
[25]
2023, A&A, 675, A189, doi: 10.1051/0004-6361/202245158
Dvornik, A., Heymans, C., Asgari, M., et al. 2023, A&A, 675, A189, doi: 10.1051/0004-6361/202245158
2023 doi
-
[26]
2015, MNRAS, 454, 2451, doi: 10.1093/mnras/stv2000
Eifler, T., Krause, E., Dodelson, S., et al. 2015, MNRAS, 454, 2451, doi: 10.1093/mnras/stv2000
2015 doi
-
[27]
Ferreira, T., Alonso, D., Garcia-Garcia, C., & Chisari, N. E. 2024, PhRvL, 133, 051001, doi: 10.1103/PhysRevLett.133.051001
2024 doi
- [28]
- [29]
-
[30]
2024, A&A, 689, A298, doi: 10.1051/0004-6361/202348852
Ghirardini, V., Bulbul, E., Artis, E., et al. 2024, A&A, 689, A298, doi: 10.1051/0004-6361/202348852
2024 doi
-
[31]
K., & Schneider, A
Giri, S. K., & Schneider, A. 2021, JCAP, 2021, 046, doi: 10.1088/1475-7516/2021/12/046
2021 doi
-
[32]
2024, MNRAS, 528, 4379, doi: 10.1093/mnras/stae259
Grandis, S., Aric` o, G., Schneider, A., & Linke, L. 2024, MNRAS, 528, 4379, doi: 10.1093/mnras/stae259
2024 doi
- [33]
-
[34]
2022, MNRAS, 511, 662, doi: 10.1093/mnras/stac077
Hagstotz, S., Reischke, R., & Lilow, R. 2022, MNRAS, 511, 662, doi: 10.1093/mnras/stac077
2022 doi
- [35]
-
[36]
P., Zentner, A
Hearin, A. P., Zentner, A. R., & Ma, Z. 2012, JCAP, 2012, 034, doi: 10.1088/1475-7516/2012/04/034
2012 doi
-
[37]
2011, A&A, 536, A85, doi: 10.1051/0004-6361/201117294
Hilbert, S., Hartlap, J., & Schneider, P. 2011, A&A, 536, A85, doi: 10.1051/0004-6361/201117294
2011 doi
-
[38]
2014, MNRAS, 442, 2304, doi: 10.1093/mnras/stu1023
Hirschmann, M., Dolag, K., Saro, A., et al. 2014, MNRAS, 442, 2304, doi: 10.1093/mnras/stu1023
2014 doi
-
[39]
F., Wetzel, A., Kereˇ s, D., et al
Hopkins, P. F., Wetzel, A., Kereˇ s, D., et al. 2018, MNRAS, 480, 800, doi: 10.1093/mnras/sty1690
2018 doi
-
[40]
2012, JCAP, 2012, 027, doi: 10.1088/1475-7516/2012/04/027 Ivezi´ c,ˇZ., Kahn, S
Howlett, C., Lewis, A., Hall, A., & Challinor, A. 2012, JCAP, 2012, 027, doi: 10.1088/1475-7516/2012/04/027 Ivezi´ c,ˇZ., Kahn, S. M., Tyson, J. A., et al. 2019, ApJ, 873, 111, doi: 10.3847/1538-4357/ab042c
2012 doi
-
[41]
W., Prochaska, J
James, C. W., Prochaska, J. X., Macquart, J. P., et al. 2022a, MNRAS, 509, 4775, doi: 10.1093/mnras/stab3051 Connecting the FRB DM–redshift relation to Suppression of the Matter Power Spectrum 23
-
[42]
W., Ghosh, E
James, C. W., Ghosh, E. M., Prochaska, J. X., et al. 2022b, MNRAS, 516, 4862, doi: 10.1093/mnras/stac2524
-
[43]
S., Pearce, F
Jenkins, A., Frenk, C. S., Pearce, F. R., et al. 1998, ApJ, 499, 20, doi: 10.1086/305615
1998 doi
- [44]
-
[45]
2001, MNRAS, 327, 1353, doi: 10.1046/j.1365-8711.2001.04838.x
Komatsu, E., & Seljak, U. 2001, MNRAS, 327, 1353, doi: 10.1046/j.1365-8711.2001.04838.x
2001
-
[46]
2024, arXiv e-prints, arXiv:2410.07084, doi: 10.48550/arXiv.2410.07084 La Posta, A., Alonso, D., Chisari, N
Hildebrandt, H. 2024, arXiv e-prints, arXiv:2410.07084, doi: 10.48550/arXiv.2410.07084 La Posta, A., Alonso, D., Chisari, N. E., Ferreira, T., & Garc´ ıa-Garc´ ıa, C. 2024, arXiv e-prints, arXiv:2412.12081, doi: 10.48550/arXiv.2412.12081
-
[47]
2025, ApJ, 983, 8, doi: 10.3847/1538-4357/adba5b
Shirasaki, M. 2025, ApJ, 983, 8, doi: 10.3847/1538-4357/adba5b
2025 doi
- [48]
-
[49]
S., et al
Lee, K.-G., Ata, M., Khrykin, I. S., et al. 2022, ApJ, 928, 9, doi: 10.3847/1538-4357/ac4f62
2022 doi
-
[50]
2002, PhRvD, 66, 103511, doi: 10.1103/PhysRevD.66.103511
Lewis, A., & Bridle, S. 2002, PhRvD, 66, 103511, doi: 10.1103/PhysRevD.66.103511
2002 doi
-
[51]
2000, ApJ, 538, 473, doi: 10.1086/309179
Lewis, A., Challinor, A., & Lasenby, A. 2000, ApJ, 538, 473, doi: 10.1086/309179
2000 doi
-
[52]
2020, MNRAS, 495, 2930, doi: 10.1093/mnras/staa1385
Li, Q., Cui, W., Yang, X., et al. 2020, MNRAS, 495, 2930, doi: 10.1093/mnras/staa1385
2020 doi
-
[53]
R., Bailes, M., McLaughlin, M
Lorimer, D. R., Bailes, M., McLaughlin, M. A., Narkevic, D. J., & Crawford, F. 2007, Science, 318, 777, doi: 10.1126/science.1147532
2007 doi
-
[54]
P., Prochaska, J
Macquart, J. P., Prochaska, J. X., McQuinn, M., et al. 2020, Nature, 581, 391, doi: 10.1038/s41586-020-2300-2
2020 doi
-
[55]
G., Bird, S., Schaye, J., et al
McCarthy, I. G., Bird, S., Schaye, J., et al. 2018, MNRAS, 476, 2999, doi: 10.1093/mnras/sty377
2018 doi
-
[56]
G., Schaye, J., Bird, S., & Le Brun, A
McCarthy, I. G., Schaye, J., Bird, S., & Le Brun, A. M. C. 2017, MNRAS, 465, 2936, doi: 10.1093/mnras/stw2792
2017 doi
-
[57]
2014, ApJL, 780, L33, doi: 10.1088/2041-8205/780/2/L33
McQuinn, M. 2014, ApJL, 780, L33, doi: 10.1088/2041-8205/780/2/L33
2014 doi
-
[58]
J., Brieden, S., Tr¨ oster, T., & Heymans, C
Mead, A. J., Brieden, S., Tr¨ oster, T., & Heymans, C. 2021, MNRAS, 502, 1401, doi: 10.1093/mnras/stab082
2021 doi
-
[59]
Heavens, A. F. 2015, MNRAS, 454, 1958, doi: 10.1093/mnras/stv2036
2015 doi
-
[60]
J., Tr¨ oster, T., Heymans, C., Van Waerbeke, L., & McCarthy, I
Mead, A. J., Tr¨ oster, T., Heymans, C., Van Waerbeke, L., & McCarthy, I. G. 2020, A&A, 641, A130, doi: 10.1051/0004-6361/202038308
2020 doi
- [61]
-
[62]
2024, ApJ, 967, 32, doi: 10.3847/1538-4357/ad3070 Miralda-Escud´ e, J., Haehnelt, M., & Rees, M
Medlock, I., Nagai, D., Singh, P., et al. 2024, ApJ, 967, 32, doi: 10.3847/1538-4357/ad3070 Miralda-Escud´ e, J., Haehnelt, M., & Rees, M. J. 2000, ApJ, 530, 1, doi: 10.1086/308330
2024 doi
-
[63]
2023, PhRvD, 108, 123517, doi: 10.1103/PhysRevD.108.123517
Miyatake, H., Sugiyama, S., Takada, M., et al. 2023, PhRvD, 108, 123517, doi: 10.1103/PhysRevD.108.123517
2023 doi
-
[64]
2019, Computational Astrophysics and Cosmology, 6, 2, doi: 10.1186/s40668-019-0028-x
Nelson, D., Springel, V., Pillepich, A., et al. 2019, Computational Astrophysics and Cosmology, 6, 2, doi: 10.1186/s40668-019-0028-x
2019 doi
-
[65]
2023, ApJ, 959, 136, doi: 10.3847/1538-4357/ad022a
Ni, Y., Genel, S., Angl´ es-Alc´ azar, D., et al. 2023, ApJ, 959, 136, doi: 10.3847/1538-4357/ad022a
2023 doi
-
[66]
N., et al
Nicola, A., Villaescusa-Navarro, F., Spergel, D. N., et al. 2022, JCAP, 2022, 046, doi: 10.1088/1475-7516/2022/04/046
2022 doi
-
[67]
Hummels, C. B. 2024, ApJL, 972, L26, doi: 10.3847/2041-8213/ad725b
2024 doi
- [68]
-
[69]
J., et al
Pandey, S., Lehman, K., Baxter, E. J., et al. 2023, MNRAS, 525, 1779, doi: 10.1093/mnras/stad2268
2023 doi
-
[70]
Petroff, E., Hessels, J. W. T., & Lorimer, D. R. 2022, A&A Rv, 30, 2, doi: 10.1007/s00159-022-00139-w
2022 doi
-
[71]
Pierel, J. D. R., & Rodney, S. 2019, ApJ, 876, 107, doi: 10.3847/1538-4357/ab164a Planck Collaboration, Aghanim, N., Akrami, Y., et al. 2020a, A&A, 641, A6, doi: 10.1051/0004-6361/201833910 —. 2020b, A&A, 641, A8, doi: 10.1051/0004-6361/201833886
2019 doi
-
[72]
2023, MNRAS, 525, 5554, doi: 10.1093/mnras/stad2573
Preston, C., Amon, A., & Efstathiou, G. 2023, MNRAS, 525, 5554, doi: 10.1093/mnras/stad2573
2023 doi
-
[73]
X., & Zheng, Y
Prochaska, J. X., & Zheng, Y. 2019, MNRAS, 485, 648, doi: 10.1093/mnras/stz261
2019 doi
-
[74]
2019, Nature, 572, 352, doi: 10.1038/s41586-019-1389-7
Ravi, V., Catha, M., D’Addario, L., et al. 2019, Nature, 572, 352, doi: 10.1038/s41586-019-1389-7
2019 doi
- [75]
-
[76]
2023, MNRAS, 524, 2237, doi: 10.1093/mnras/stad1645
Reischke, R., & Hagstotz, S. 2023, MNRAS, 524, 2237, doi: 10.1093/mnras/stad1645
2023 doi
- [77]
- [78]
-
[79]
G., Yuan, W., Macri, L
Riess, A. G., Yuan, W., Macri, L. M., et al. 2022, ApJL, 934, L7, doi: 10.3847/2041-8213/ac5c5b
2022 doi
- [80]
-
[81]
Font, A. S. 2023, MNRAS, 523, 2247, doi: 10.1093/mnras/stad1474
2023 doi
- [82]
-
[83]
2021, PhRvD, 103, 063513, doi: 10.1103/PhysRevD.103.063513
Schaan, E., Ferraro, S., Amodeo, S., et al. 2021, PhRvD, 103, 063513, doi: 10.1103/PhysRevD.103.063513
2021 doi
-
[84]
2023, MNRAS, 526, 4978, doi: 10.1093/mnras/stad2419
Schaye, J., Kugel, R., Schaller, M., et al. 2023, MNRAS, 526, 4978, doi: 10.1093/mnras/stad2419
2023 doi
-
[85]
K., Amodeo, S., & Refregier, A
Schneider, A., Giri, S. K., Amodeo, S., & Refregier, A. 2022, MNRAS, 514, 3802, doi: 10.1093/mnras/stac1493
2022 doi
-
[86]
2015, JCAP, 2015, 049, doi: 10.1088/1475-7516/2015/12/049
Schneider, A., & Teyssier, R. 2015, JCAP, 2015, 049, doi: 10.1088/1475-7516/2015/12/049
2015 doi
-
[87]
2019, JCAP, 2019, 020, doi: 10.1088/1475-7516/2019/03/020
Schneider, A., Teyssier, R., Stadel, J., et al. 2019, JCAP, 2019, 020, doi: 10.1088/1475-7516/2019/03/020
2019 doi
-
[88]
F., Samuroff, S., Krause, E., et al
Secco, L. F., Samuroff, S., Krause, E., et al. 2022, PhRvD, 105, 023515, doi: 10.1103/PhysRevD.105.023515
2022 doi
-
[89]
Speagle, J. S. 2020, Monthly Notices of the Royal Astronomical Society, 493, 3132–3158, doi: 10.1093/mnras/staa278
2020 doi
- [90]
-
[91]
2018, MNRAS, 475, 676, doi: 10.1093/mnras/stx3304 Spurio Mancini, A., Piras, D., Alsing, J., Joachimi, B., &
Springel, V., Pakmor, R., Pillepich, A., et al. 2018, MNRAS, 475, 676, doi: 10.1093/mnras/stx3304 Spurio Mancini, A., Piras, D., Alsing, J., Joachimi, B., &
2018 doi
-
[92]
Hobson, M. P. 2022, MNRAS, 511, 1771, doi: 10.1093/mnras/stac064
2022 doi
-
[93]
L., Kitching, T
Taylor, P. L., Kitching, T. D., & McEwen, J. D. 2018, PhRvD, 98, 043532, doi: 10.1103/PhysRevD.98.043532
2018 doi
-
[94]
2023, The Open Journal of Astrophysics, 6, 11, doi: 10.21105/astro.2302.01942
Wietersheim-Kramsta, M., & Jeffrey, N. 2023, The Open Journal of Astrophysics, 6, 11, doi: 10.21105/astro.2302.01942
2023 arXiv
- [95]
-
[96]
2013, Science, 341, 53, doi: 10.1126/science.1236789
Thornton, D., Stappers, B., Bailes, M., et al. 2013, Science, 341, 53, doi: 10.1126/science.1236789
2013 doi
-
[97]
2024, JCAP, 2024, 037, doi: 10.1088/1475-7516/2024/07/037 Tr¨ oster, T., Mead, A
To, C.-H., Pandey, S., Krause, E., et al. 2024, JCAP, 2024, 037, doi: 10.1088/1475-7516/2024/07/037 Tr¨ oster, T., Mead, A. J., Heymans, C., et al. 2022, A&A, 660, A27, doi: 10.1051/0004-6361/202142197
2024 doi
-
[98]
A., MacCrann, N., Zuntz, J., et al
Troxel, M. A., MacCrann, N., Zuntz, J., et al. 2018, PhRvD, 98, 043528, doi: 10.1103/PhysRevD.98.043528
2018 doi
-
[99]
2019, in Canadian Long Range Plan for Astronomy and Astrophysics White Papers, Vol
Vanderlinde, K., Liu, A., Gaensler, B., et al. 2019, in Canadian Long Range Plan for Astronomy and Astrophysics White Papers, Vol. 2020, 28, doi: 10.5281/zenodo.3765414
2019 doi
-
[100]
2018, Pylians: Python libraries for the analysis of numerical simulations, Astrophysics Source Code Library, record ascl:1811.008
Villaescusa-Navarro, F. 2018, Pylians: Python libraries for the analysis of numerical simulations, Astrophysics Source Code Library, record ascl:1811.008. http://ascl.net/1811.008
2018
-
[101]
2023, ApJS, 265, 54, doi: 10.3847/1538-4365/acbf47
Villaescusa-Navarro, F., Genel, S., Angl´ es-Alc´ azar, D., et al. 2023, ApJS, 265, 54, doi: 10.3847/1538-4365/acbf47
2023 doi
-
[102]
2014, MNRAS, 444, 1518, doi: 10.1093/mnras/stu1536
Vogelsberger, M., Genel, S., Springel, V., et al. 2014, MNRAS, 444, 1518, doi: 10.1093/mnras/stu1536
2014 doi
-
[103]
Walker, C. R. H., Spitler, L. G., Ma, Y.-Z., et al. 2024, A&A, 683, A71, doi: 10.1051/0004-6361/202347139
2024 doi
-
[104]
2023, ApJ, 944, 50, doi: 10.3847/1538-4357/acb2c8
Wang, B., & Wei, J.-J. 2023, ApJ, 944, 50, doi: 10.3847/1538-4357/acb2c8
2023 doi
-
[105]
M., Khan, A., & McQuinn, M
Williams, I. M., Khan, A., & McQuinn, M. 2023, MNRAS, 520, 3626, doi: 10.1093/mnras/stad293
2023 doi
-
[106]
C., Suyu, S
Wong, K. C., Suyu, S. H., Chen, G. C. F., et al. 2020, MNRAS, 498, 1420, doi: 10.1093/mnras/stz3094
2020 doi
- [107]
-
[108]
S., Abdalla, F
Xavier, H. S., Abdalla, F. B., & Joachimi, B. 2016, MNRAS, 459, 3693, doi: 10.1093/mnras/stw874
2016 doi
-
[109]
Q., Yu, H., He, J
Zhang, G. Q., Yu, H., He, J. H., & Wang, F. Y. 2020, ApJ, 900, 170, doi: 10.3847/1538-4357/abaa4a
2020 doi
-
[110]
Zhang, P., & Sheth, R. K. 2007, ApJ, 671, 14, doi: 10.1086/522913
2007 doi
-
[111]
J., Yan, K., Li, C
Zhang, Z. J., Yan, K., Li, C. M., Zhang, G. Q., & Wang, F. Y. 2021, ApJ, 906, 49, doi: 10.3847/1538-4357/abceb9
2021 doi
Reviewed August 16, 2026 · model on record in the stance chip above.
Discussion (0). Continue with ORCID to comment.