Non-constant hazard ratios in randomized controlled trials with composite endpoints
Pith reviewed 2026-05-24 16:08 UTC · model grok-4.3
The pith
The hazard ratio for a composite endpoint is often non-constant over time even when each component has a constant hazard ratio.
A machine-rendered reading of the paper's core claim, the machinery that carries it, and where it could break.
Core claim
Under the modeling assumption that the hazard ratio for each component of the composite endpoint is constant over time, the hazard ratio for the composite endpoint itself varies as a function of time, the component-specific baseline hazards, and the degree of association between components. The variation, measured by the difference D between maximum and minimum composite hazard ratios and by the relative sample size measure R, is pronounced when the component hazard ratios are near 1 and when the component baseline hazards differ markedly.
What carries the argument
The time-dependent composite hazard ratio obtained by combining two components each having constant individual hazard ratios, quantified via the range D and the sample-size ratio R.
If this is right
- The average hazard ratio may not serve as a valid summary measure of treatment effect when D is large.
- Common sample-size formulas that assume a constant hazard ratio can be inappropriate for composite endpoints.
- Non-constant composite hazard ratios arise even when treatment effects on the components are similar, provided the baseline hazards differ.
- Interpretation of results from trials using composite endpoints such as progression-free survival may need to account for time variation.
Where Pith is reading between the lines
- Trial designers could simulate the expected path of the composite hazard ratio before finalizing the primary endpoint.
- Alternative measures such as restricted mean survival time that avoid proportionality assumptions might be preferable for composites in some settings.
- The patterns could be checked in settings with more than two components or with mild time variation in the component hazard ratios themselves.
Load-bearing premise
The hazard ratio for each individual component endpoint remains constant over time.
What would settle it
A trial dataset in which the two component hazard ratios are constant, the component baseline hazards differ substantially, yet the observed composite hazard ratio shows no variation over time would falsify the central claim.
Figures
read the original abstract
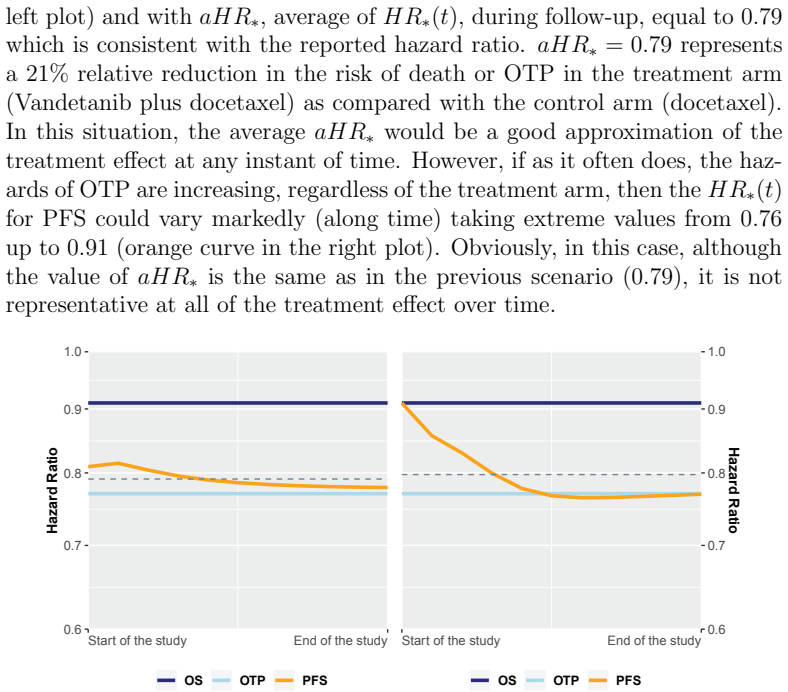
The hazard ratio is routinely used as a summary measure to assess the treatment effect in clinical trials with time-to-event endpoints. It is frequently assumed as constant over time although this assumption often does not hold. When the hazard ratio deviates considerably from being constant, the average of its plausible values is not a valid measure of the treatment effect, can be clinically misleading and common sample size formulas are not appropriate. In this paper, we study the hazard ratio along time of a two-component composite endpoint under the assumption that the hazard ratio for each component is constant. This work considers two measures for quantifying the non-proportionality of the hazard ratio: the difference $D$ between the maximum and minimum values of hazard ratio over time and the relative measure $R$ representing the ratio between the sample sizes for the minimum detectable and the average effects. We illustrate $D$ and $R$ by means of the ZODIAC trial where the primary endpoint was progression-free survival. We have run a simulation study deriving scenarios for different values of the hazard ratios, different event rates and different degrees of association between the components. We illustrate situations that yield non-constant hazard ratios for the composite endpoints and consider the likely impact on sample size. Results show that the distance between the two component hazard ratios plays an important role, especially when they are close to 1. Furthermore, even when the treatment effects for each component are similar, if the two-component hazards are markedly different, hazard ratio of the composite is often non-constant.
Editorial analysis
A structured set of objections, weighed in public.
Referee Report
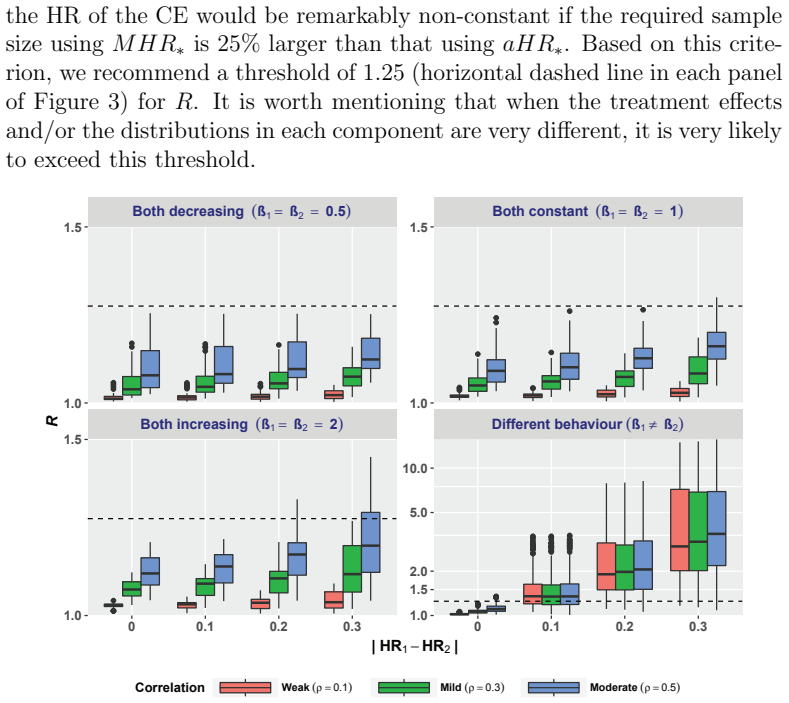
Summary. The manuscript claims that, under the modeling assumption of constant component-specific hazard ratios, the hazard ratio of a two-component composite endpoint is generally time-varying (non-constant) whenever the baseline hazards of the components differ substantially. The authors quantify the degree of non-proportionality via two measures, D (difference between maximum and minimum composite HR over time) and R (ratio of sample sizes needed to detect the minimum versus average effect), map the regions where D and R become large through simulation (varying component HRs, event rates, and association strength), and illustrate the phenomenon with the ZODIAC trial's progression-free survival endpoint.
Significance. If the central derivation holds, the result is significant for the analysis of randomized trials with composite time-to-event endpoints: it shows that a single summary HR can be misleading and that standard sample-size formulas may be inappropriate even when each component obeys proportional hazards. Credit is due for the explicit forward simulation design that isolates the effect of differing baselines and for the concrete ZODIAC illustration that demonstrates practical impact.
minor comments (3)
- [Simulation study] The abstract states that 'the distance between the two component hazard ratios plays an important role, especially when they are close to 1,' yet the simulation section should explicitly tabulate the grid of component HR values (e.g., 0.6–1.4) and baseline hazard ratios used to generate the reported D and R surfaces.
- [Methods] The definition and computation of the relative measure R (sample-size ratio) is central to the practical message; the manuscript should supply the exact formula or algorithm used to obtain the 'minimum detectable' and 'average' effects so that readers can replicate the reported values.
- [ZODIAC illustration] In the ZODIAC illustration, the estimated component-specific baseline hazards and HRs should be reported numerically (with confidence intervals) so that the resulting D and R can be verified directly from the published Kaplan–Meier or Cox output.
Simulated Author's Rebuttal
We thank the referee for the supportive summary of our work and for recommending minor revision. The assessment correctly captures the core finding that composite HRs can be time-varying even under constant component HRs, and we appreciate the credit given to the simulation design and ZODIAC illustration.
Circularity Check
Derivation is self-contained; no circularity detected
full rationale
The paper assumes constant component-specific HRs (explicit modeling premise) and shows via direct definition that the composite HR equals a time-dependent weighted average of the component hazards. This follows immediately from the first-event hazard being the sum of component hazards; the weights evolve unless baselines are proportional in a specific way. Simulations vary HR values, event rates, and association to map regions where D and R are large, without fitting parameters to observed data or reducing any result to a prior fitted quantity. No self-citation is load-bearing, no uniqueness theorem is invoked, and no ansatz is smuggled. The central claim is therefore a straightforward mathematical consequence of the stated assumptions rather than a re-expression of inputs.
Axiom & Free-Parameter Ledger
axioms (1)
- domain assumption Hazard ratio for each component endpoint is constant over time
Lean theorems connected to this paper
-
IndisputableMonolith/Cost/FunctionalEquation.leanwashburn_uniqueness_aczel unclear?
unclearRelation between the paper passage and the cited Recognition theorem.
even when the treatment effects for each component are similar, if the two-component hazards are markedly different, hazard ratio of the composite is often non-constant
-
IndisputableMonolith/Foundation/RealityFromDistinction.leanreality_from_one_distinction unclear?
unclearRelation between the paper passage and the cited Recognition theorem.
the hazard ratio for each individual component endpoint remains constant over time
What do these tags mean?
- matches
- The paper's claim is directly supported by a theorem in the formal canon.
- supports
- The theorem supports part of the paper's argument, but the paper may add assumptions or extra steps.
- extends
- The paper goes beyond the formal theorem; the theorem is a base layer rather than the whole result.
- uses
- The paper appears to rely on the theorem as machinery.
- contradicts
- The paper's claim conflicts with a theorem or certificate in the canon.
- unclear
- Pith found a possible connection, but the passage is too broad, indirect, or ambiguous to say the theorem truly supports the claim.
Reference graph
Works this paper leans on
-
[1]
Stanley K. (2007). Design of randomized controlled trials. Circulation, 115, 1164–1169
work page 2007
-
[2]
Saad E. D. & Katz A. (2009). Progression-free survival and time to progression as primary end points in advanced breast cancer: often used, sometimes loosely defined. Annals of Oncology , 20 (3), 460–464
work page 2009
- [3]
-
[4]
Hern´ an M. A. (2010). The hazards of hazard ratios. Epidemiology, 21, 13–15
work page 2010
-
[5]
Schemper M., Wakounig S. & Heinze G. (2009). The estimation of av- erage hazard ratios by weighted Cox regression. Statistics in Medicine , 28 (19), 2473-2489
work page 2009
-
[6]
Halperin M., Rogot E., Gurian J. & Ederer F. (1968). Sample sizes for medical trials with special reference to long-term therapy. Journal of Chronic Disease, 21 (1), 13-24
work page 1968
-
[7]
Royston P. & Parmar M. K. (2014). An approach to trial design and analysis in the era of non-proportional hazards of the treatment effect. Trials, 15, 314
work page 2014
-
[8]
Kleist P. (2006). Composite endpoints: proceed with caution. Applied Clinical Trials Online . Retrieved from http://www.appliedclinicaltrialsonline.com/composite-endpoints- proceed-caution
work page 2006
-
[9]
G´ omez G. (2011). Some theoretical thoughts when using a composite endpoint to prove the efficacy of a treatment. Proceedings of the 26th International Workshop on Statistical Modelling , 14–21
work page 2011
-
[10]
Trivedi P. K. & Zimmer D. M. (2005). Copulas and Dependence. Copula modeling: an introduction for practitioners (pp. 7–32). Hanover: now Publishers Inc. 16
work page 2005
-
[11]
G´ omez G. & Lagakos S. W. (2013). Statistical considerations when us- ing a composite endpoint for comparing treatment groups. Statistics in Medicine, 32, 719–738
work page 2013
-
[12]
Kalbfleisch J. D. & Prentice R. L. (1981). Estimation of the average hazard ratio. Biometrika, 68 (1), 105–112
work page 1981
-
[13]
Schoenfeld D. (1981). The asymptotic properties of nonparametric tests for comparing survival distributions. Biometrika, 68 (1), 316–319
work page 1981
-
[14]
Machin D., Campbell M. J., Fayers P. M. & Pinol A. P. Y. (1997). Comparing Survival Curves. Sample size tables for clinical studies (pp. 84–101). Oxford: Blackwell Science Ltd
work page 1997
-
[15]
Herbst R. S., Sun Y., Eberhardt W. E. E., Germonpr´ e P., Saijo N., Zhou C., Johnson B. E et al. (2010). Vandetanib plus docetaxel versus docetaxel as second-line treatment for patients with advanced non-small- cell lung cancer (ZODIAC): a double-blind, randomised, phase 3 trial. The Lancet Oncology, 11 (7), 619–626
work page 2010
-
[16]
Uno H., Wittes J., Fu H., Solomon S. D., Claggett B., Tian L., . . . Wei L. J. (2015). Alternatives to hazard ratios for comparing the efficacy or safety of therapies in noninferiority studies.Annals of Internal Medicine , 163, 127–134
work page 2015
-
[17]
Tsiatis A. (1975). A nonidentifiability aspect of the problem of compet- ing risks. Proceedings of the National Academy of Sciences of the United States of America , 72, 20–22 17
work page 1975
discussion (0)
Sign in with ORCID, Apple, or X to comment. Anyone can read and Pith papers without signing in.