REVIEW 3 major objections 6 minor 43 references
Co-evolution of Nuclear Rings, Bars and the Central Intensity Ratio of their Host Galaxies
T0 review · 3 major / 6 minor · reviewed 2026-08-14 · deepseek-v4-flash
Pith's one-line read This paper claims that the central intensity ratio (CIR)—the fraction of a galaxy's central light concentrated in its innermost few hundred parsecs—tracks the coupled evolution of nuclear rings and bars in early-type spirals, based on…
desk verdict New correlations between CIR and ring/bar properties, but a factor-of-seven aperture-scale confound means they are not yet established. read the letter →
The pith
A machine-rendered reading of the paper's core claim, the machinery that carries it, and where it could break.
The reading
What carries the argument
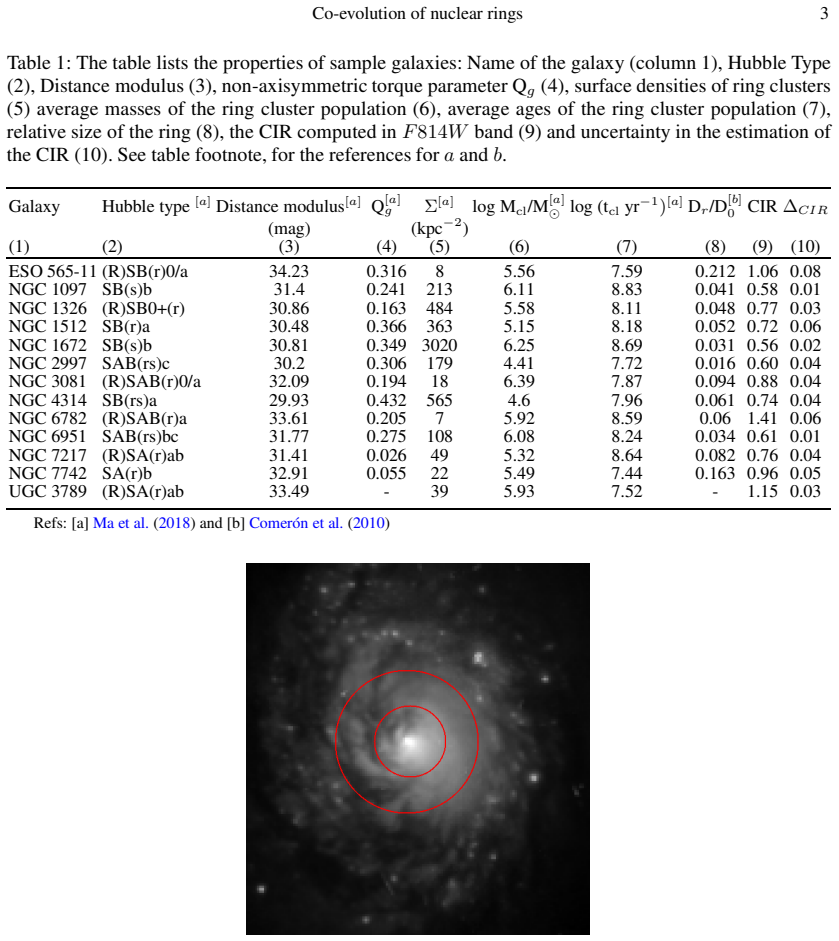
The central object is the CIR, defined as $CIR = I_1/(I_2-I_1)$, where $I_1$ and $I_2$ are the intensities in concentric apertures of radii $r_1$ and $r_2 = 2r_1$. This ratio removes any assumed form for the central intensity profile and amplifies changes in the central light. In this paper $r_1 = 1.5$ arcsec and $r_2 = 3$ arcsec on archival HST F814W images, corresponding to 0.23 and 0.46 kpc at the sample's mean distance of 31.8 Mpc. The argument runs through the correlations of CIR with the non-axisymmetric torque parameter $Q_g$ (bar strength), the relative ring size $D_r/D_0$, and the surface density, age, and mass of the ring clusters.
What would settle it
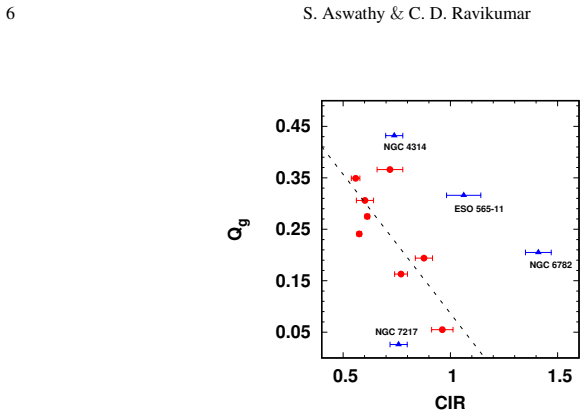
Recompute the CIR for these same HST images with aperture radii scaled to each galaxy's distance so that the inner aperture always covers a fixed physical radius (for example 0.23 kpc); if the reported correlations with $D_r/D_0$ (r=0.94) and $Q_g$ (r=-0.85) weaken substantially or disappear, the results are an artefact of fixed angular apertures rather than a genuine ring–bar-CIR connection.
Extended reading notes
Core claim
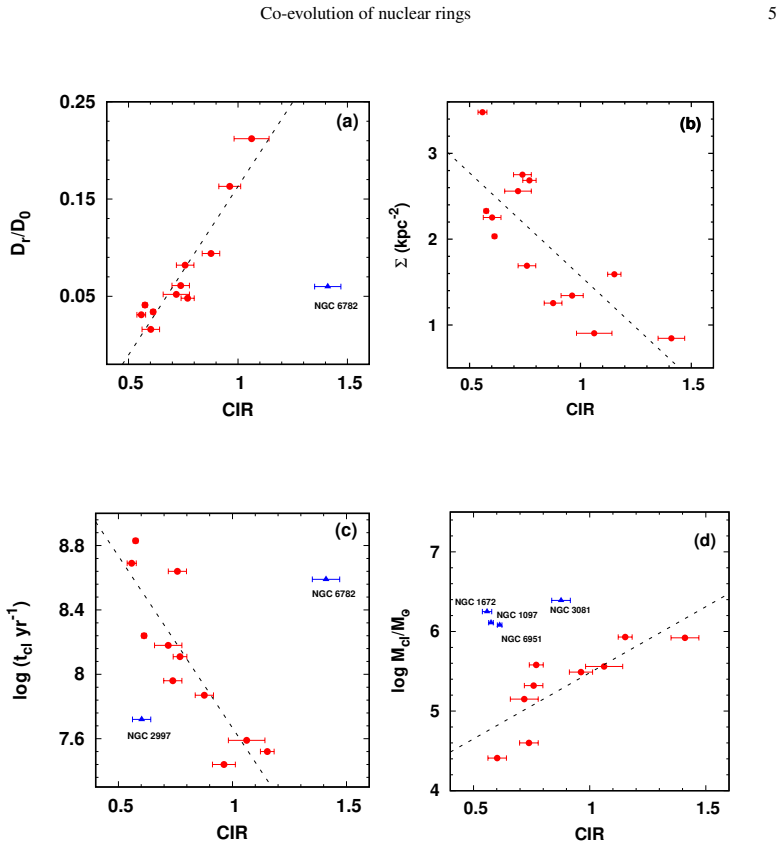
The central claim is that the CIR is intimately connected with both ring and bar properties and therefore can serve as a parameter for unfolding their coupled evolution. In the sample, CIR increases with the ring-to-galaxy size ratio $D_r/D_0$ and with ring cluster mass, and decreases with ring cluster surface density, mean cluster age, and bar torque $Q_g$. The authors interpret this pattern as an evolutionary sequence: a young bar funnels gas inward, producing a bright central starburst and a high CIR; as the bar strengthens, the gas is consumed or pushed out, central star formation declines, the ring shrinks and its clusters age, and the CIR drops. They also note that low CIR values were already linked to massive central black holes, suggesting the same parameter may join ring/bar evolution to AGN and black-hole growth.
Load-bearing premise
Every CIR uses the same 1.5 and 3 arcsec apertures while the sample galaxies lie at very different distances (distance moduli 29.93–34.23), so the physical radius sampled by the inner aperture varies by roughly a factor of seven across the sample; if that scale variation, rather than ring or bar physics, drives the correlations, the central claim fails.
Editorial extensions
If this is right
- The CIR, measurable from a single high-resolution image, could be used as a quick photometric indicator of a galaxy's nuclear-ring stage and bar strength, bypassing spectroscopic population synthesis.
- Low-CIR galaxies should be the later-stage systems: small, dense rings, older and less massive clusters, and strong bars, while high-CIR galaxies are the younger starburst phase.
- These correlations support the picture in which strong bars suppress central star formation after an early inflow-driven burst, rather than continuously feeding it.
- The previously established anti-correlation between CIR and SMBH mass, combined with these results, ties the bar–ring evolutionary sequence to the growth of central black holes.
Reading between the lines
- If the aperture-scale issue is resolved and the correlations hold, the CIR could serve as a statistical proxy for bar strength and ring evolution in large imaging surveys that lack the dynamical maps needed for Qg, an application the paper does not develop.
- The paper uses only the F814W band; comparing CIR across UV and optical bands would test whether the correlations are driven by young clusters rather than by the old stellar light concentration.
- The proposed sequence implies a monotonic decrease of CIR with bar age; a sample with independent bar-age estimates could confirm whether the CIR is truly an evolutionary clock.
Signed reviews
Editorial analysis
A structured set of objections, weighed in public.
Referee Report
Summary. This paper computes the central intensity ratio (CIR), defined in Eq. (1) as I1/(I2−I1) inside fixed angular apertures of 1.5 and 3 arcsec, for 13 early-type spiral galaxies hosting nuclear rings. Using archival HST F814W images, the authors report strong Pearson correlations between the CIR and ring properties (relative ring size Dr/D0, ring cluster surface density Σ, mean cluster age tcl, and mean cluster mass Mcl) and with the bar-strength parameter Qg, as summarized in Table 2. They interpret these correlations as evidence that the CIR traces the coupled secular evolution of nuclear rings, bars, and central star formation, and propose the CIR as a useful diagnostic parameter for such studies.
Significance. If the reported correlations are robust, the CIR would be a simple, cheaply measurable photometric diagnostic linking central light concentration to nuclear ring and bar evolution, which would be a genuinely useful addition to the field. The paper has concrete strengths: the CIR definition avoids assuming a particular form for the central surface-brightness profile, the analysis uses archival HST data that are publicly checkable, and all CIR values with uncertainties are tabulated in Table 1. However, the central claim rests on correlations with only 8–13 galaxies, and the CIR measurement itself is made with apertures that are fixed in angle rather than in physical size, an issue that affects every entry in Table 2. The significance of the claimed correlations is therefore not yet established at the level required for the paper's central conclusion.
major comments (3)
- [§2, Table 1] The CIR is computed with fixed angular apertures r1=1.5 arcsec and r2=3 arcsec, which the text says correspond to 0.23 and 0.46 kpc at the mean sample distance of 31.8 Mpc, but the distance moduli in Table 1 range from 29.93 (NGC 4314) to 34.23 (ESO 565-11). The physical radius of the inner aperture therefore varies by roughly a factor of seven across the sample (from about 0.07 kpc to about 0.51 kpc), so the same angular aperture samples a near-nuclear, PSF-dominated scale in the nearest galaxies and a scale covering much of the ring/bar region in the farthest ones. Because the CIR is a light-concentration measure, its value depends on where the aperture sits relative to the central profile; without rescaling apertures to a fixed physical radius or explicitly testing for a distance dependence of CIR, the Table 2 correlations, especially Dr/D0 versus CIR (r=0.94, N=11) and Qg versus CIR (r=-0.85, N=9), could be partly or wholly induced by this aperture-scale mismatch. This issue sits at the base of every CIR measurement and needs to be addressed with fixed-physical-radius apertures or an explicit control test.
- [Table 2, §3] The reported Pearson r and significance p values are computed without propagating the tabulated ΔCIR values into the fits and without including uncertainties on the adopted literature quantities (Qg, Σ, Mcl, tcl, Dr/D0). With sample sizes of only N=8–13, the significance levels are sensitive to a small number of points, and the galaxy samples differ between correlations (e.g., Dr/D0 has N=11 while Qg has N=9). A bootstrap or Monte Carlo test that includes measurement errors and that is run on a common galaxy sample is needed to establish that the correlations are not driven by a few points or by varying sample membership.
- [§2, sample selection] The exclusion of NGC 7469 because its ring radius lies within the 3 arcsec aperture is directly coupled to the quantity used in the main correlation: if small rings are preferentially excluded because their light contaminates the fixed apertures, the sample becomes biased against small Dr/D0 values, and the Dr/D0–CIR correlation in Figure 2(a) may be artificially strengthened. Please either include a galaxy with small rings using a different aperture choice, or demonstrate explicitly that the correlation is insensitive to this selection criterion.
minor comments (6)
- [§2] The sentence explaining that the inner radius is chosen to contain the effects of the PSF is vague; for HST/WFPC2 in F814W the PSF FWHM is much smaller than 1.5 arcsec, so please state the actual PSF size and the reason for this particular choice.
- [Table 2] Please specify the exact form of the significance test (for example, the t-distribution for Pearson r) and whether the quoted p is one- or two-tailed; the column header 'p' with values like 99.66 is ambiguous.
- [Figure 2 caption] There is a typographical repetition in the caption of Figure 2(b), which reads '(b) (b) (b)'.
- [§4] The statement that orientation effects can be neglected because i < 70 degrees is not obviously safe for a light-concentration ratio; many galaxies in the sample have moderate inclinations, and inclination-dependent dust extinction within 1.5 arcsec could modulate CIR. Please quantify or at least discuss this dependence.
- [§3.1, Figure 2(d)] The text notes that all galaxies with cluster masses above 10^6 M_sun deviate from the fitted Mcl–CIR relation, which means the reported r=0.81 for Mcl is driven partly by the low-mass end; please report the correlation restricted to the supposedly linear regime or discuss the nonlinearity.
- [§2] The Monte Carlo stability claim in §2 is not supported by any description of the simulations; please provide details or cite a published account.
Circularity Check
No circularity: the CIR correlations are empirical fits against independent ring/bar measurements, not consequences of the CIR definition or prior work.
full rationale
The paper's central content is a set of empirical correlations in Table 2 between CIR, computed from HST aperture photometry via Eq. (1), and nuclear-ring/bar properties (Dr/D0, Sigma, Mcl, tcl, Qg) taken from Comeron et al. (2010) and Ma et al. (2018). None of these ring/bar quantities is defined in terms of I1 or I2, and no equation in the paper reduces a ring/bar property to the CIR definition; the linear fits x = alpha*CIR + beta are descriptive regressions of independently measured quantities. The self-citation to Aswathy & Ravikumar (2018) supplies the CIR definition and contextual claims about CIR versus SMBH mass and star formation, but those prior results are not used as fitting inputs or as constraints from which the new correlations are derived; they are interpretive background. The fixed angular apertures (1.5 and 3 arcsec) applied at different distances may introduce a physical-scale systematic, but that is a measurement-comparability concern, not a circularity. The derivation chain is therefore self-contained with respect to the correlations reported, and no circular step can be exhibited.
Assumptions & free parameters
free parameters (1)
- CIR aperture radii r1=1.5 arcsec, r2=3 arcsec =
1.5 arcsec / 3 arcsec (chosen, not fit)
assumptions (5)
- domain assumption The CIR, as defined in Aswathy & Ravikumar (2018), is a reliable tracer of central star formation and correlates with SMBH mass.
- domain assumption The ring cluster ages, masses, surface densities, bar strengths Qg, and relative ring sizes taken from Ma et al. (2018) and Comerón et al. (2010) are accurate.
- domain assumption Fixed angular apertures of 1.5 and 3 arcsec sample comparable physical regions across the sample.
- domain assumption Dust and inclination effects are negligible for these face-on early-type spirals.
- standard math Pearson p-values computed by the Press et al. (1992) recipe are valid for N=8-13.
Cite this review
Pith. "Pith review of Co-evolution of Nuclear Rings, Bars and the Central Intensity Ratio of their Host Galaxies." pith.science (2026). https://pith.science/paper/SVEFY5SL
@misc{pith2026190804513,
  author       = {Pith},
  title        = {Pith review of: Co-evolution of Nuclear Rings, Bars and the Central Intensity Ratio of their Host Galaxies},
  year         = {2026},
  howpublished = {\url{https://pith.science/paper/SVEFY5SL}},
  note         = {Machine review of arXiv:1908.04513}
}
read the original abstract
Using a sample of 13 early-type spiral galaxies hosting nuclear rings, we report remarkable correlations between the properties of the nuclear rings and the central intensity ratio (CIR) of their host galaxies. The CIR, a function of intensity of light within the central 1.5 and 3 arcsec region, is found to be a vital parameter in galaxy evolution, as it shares strong correlations with many structural and dynamical properties of early-type galaxies, including mass of the central supermassive black hole (SMBH). We use archival HST images for aperture photometry at the centre of the galaxy image to compute the CIR. We observe that the relative sizes of nuclear rings and ring cluster surface densities strongly correlate with the CIR. These correlations suggest reduced star formation in the centres of galaxies hosting small and dense nuclear rings. This scenario appears to be a consequence of strong bars as advocated by the significant connection observed between the CIR and bar strengths. In addition, we observe that the CIR is closely related with the integrated properties of the stellar population in the nuclear rings associating the rings hosting older and less massive star clusters with low values of CIR. Thus, the CIR can serve as a crucial parameter in unfolding the coupled evolution of bars and rings as it is intimately connected with both their properties.
Figures
Reference graph
Works this paper leans on
- [1]
-
[2]
Aswathy, S., & Ravikumar, C. D. 2018, MNRAS, 477, 2399 2, 6, 7
work page 2018
- [3]
-
[4]
1994, in Mass-Transfer Induced Activity i n Galaxies, ed
Athanassoula, E. 1994, in Mass-Transfer Induced Activity i n Galaxies, ed. I. Shlosman, 143 1 8 S. Aswathy & C. D. Ravikumar
work page 1994
- [5]
-
[6]
Bottinelli, L., Gouguenheim, L., Paturel, G., & Teerikorpi , P . 1995, A&A, 296, 64 4
work page 1995
- [7]
- [8]
Show all 43 references
-
[9]
2001, in Astronomical Society of the Pacific Confe rence Series, V ol
Combes, F. 2001, in Astronomical Society of the Pacific Confe rence Series, V ol. 230, Galaxy Disks and Disk Galaxies, ed. J. G. Funes & E. M. Corsini, 213 1
2001
-
[10]
1985, A&A, 150, 327 1, 2
Combes, F., & Gerin, M. 1985, A&A, 150, 327 1, 2
1985
-
[11]
Combes, F., & Sanders, R. H. 1981, A&A, 96, 164 4 Comer´ on, S., Knapen, J. H., Beckman, J. E., et al. 2010, MNRAS, 402, 2462 2, 3, 4, 5, 6
1981
-
[12]
E., & White, M
Conroy, C., Gunn, J. E., & White, M. 2009, ApJ, 699, 486 4 de Grijs, R., Ma, C., Jia, S., Ho, L. C., & Anders, P . 2017, MNRA S, 465, 2820 2 de Zeeuw, P . T., Bureau, M., Emsellem, E., et al. 2002, MNRAS, 329, 513 2
2009
-
[13]
L., Nair, P ., Patton, D
Ellison, S. L., Nair, P ., Patton, D. R., et al. 2011, MNRAS, 41 6, 2182 6
2011
-
[14]
2015, MNRAS , 454, 3641 6
Fanali, R., Dotti, M., Fiacconi, D., & Haardt, F. 2015, MNRAS , 454, 3641 6
2015
-
[15]
Heckman, T. M. 1980, A&A, 88, 365 6
1980
-
[16]
C., Filippenko, A
Ho, L. C., Filippenko, A. V ., & Sargent, W . L. W . 1997, ApJS, 112, 315 6, 7
1997
-
[17]
K., & Malkan, M
Hunt, L. K., & Malkan, M. A. 1999, ApJ, 516, 660 6, 7
1999
-
[18]
A., & Percival, S
James, P . A., & Percival, S. M. 2018, MNRAS, 474, 3101 7
2018
-
[19]
Kenney, J. D. P ., Carlstrom, J. E., & Y oung, J. S. 1993, ApJ, 418, 687 2
1993
-
[20]
S., Chung, H., et al
Kim, E., Hwang, H. S., Chung, H., et al. 2017, ApJ, 845, 93 2
2017
-
[21]
2014, in IAU Symposium, V ol.303, The Galactic Center: Feeding and Feedback in a Normal Galactic Nucleus, ed
Kim, W .-T., Seo, W .-Y ., & Kim, Y . 2014, in IAU Symposium, V ol.303, The Galactic Center: Feeding and Feedback in a Normal Galactic Nucleus, ed. L. O. Sjouwerm an, C. C. Lang, & J. Ott, 43 7
2014
-
[22]
Knapen, J. H. 2005, A&A, 429, 141 1, 7
2005
-
[23]
Knapen, J. H. 2015, Highlights of Astronomy, 16, 326 1
2015
-
[24]
H., Laine, S., & Rela˜ no, M
Knapen, J. H., Laine, S., & Rela˜ no, M. 1999, Ap&SS, 269, 605 1
1999
-
[25]
H., Shlosman, I., & Peletier, R
Knapen, J. H., Shlosman, I., & Peletier, R. F. 2000, ApJ, 529, 93 7
2000
-
[26]
Kormendy, J., & Kennicutt, Jr., R. C. 2004, ARA&A, 42, 603 1
2004
-
[27]
2001, MNRAS, 322, 231 4
Kroupa, P . 2001, MNRAS, 322, 231 4
2001
-
[28]
H., & Peletier, R
Laine, S., Shlosman, I., Knapen, J. H., & Peletier, R. F. 2002 , ApJ, 567, 97 7
2002
-
[29]
2004, MNR AS, 355, 1251 1
Laurikainen, E., Salo, H., Buta, R., & V asylyev, S. 2004, MNR AS, 355, 1251 1
2004
-
[30]
2015, ApJ, 806, 150 2
Li, Z., Shen, J., & Kim, W .-T. 2015, ApJ, 806, 150 2
2015
-
[31]
Ma, C., de Grijs, R., & Ho, L. C. 2018, ApJ, 857, 116 2, 3, 4, 5, 6, 7
2018
-
[32]
J., Ho, L
Maoz, D., Barth, A. J., Ho, L. C., Sternberg, A., & Filippenko , A. V . 2001, AJ, 121, 3048 2
2001
-
[33]
1995, Fund
Martinet, L. 1995, Fund. Cosmic Phys., 15, 341 1
1995
-
[34]
M., Knapen, J
Mazzuca, L. M., Knapen, J. H., V eilleux, S., & Regan, M. W . 2008, ApJS, 174, 337 1, 4, 5
2008
-
[35]
G., Stone, J
Piner, B. G., Stone, J. M., & Teuben, P . J. 1995, ApJ, 449, 508 2
1995
-
[36]
H., Teukolsky, S
Press, W . H., Teukolsky, S. A., V etterling, W . T., & Flannery , B. P . 1992, Numerical recipes in FORTRAN. The art of scientific computing 4
1992
-
[37]
Robichaud, F., Williamson, D., Martel, H., Kawata, D., & Ell ison, S. L. 2017, MNRAS, 469, 3722 7
2017
-
[38]
H., & Huntley, J
Sanders, R. H., & Huntley, J. M. 1976, ApJ, 209, 53 6
1976
-
[39]
L., Knapen, J
Sarzi, M., Allard, E. L., Knapen, J. H., & Mazzuca, L. M. 2007, MNRAS, 380, 949 4
2007
-
[40]
1990, in NASA Conference Publication, V ol
Shlosman, I. 1990, in NASA Conference Publication, V ol. 309 8, NASA Conference Publication, ed. J. W . Sulentic, W . C. Keel, & C. M. Telesco 1
1990
-
[41]
C., & Frank, J
Shlosman, I., Begelman, M. C., & Frank, J. 1990, Nature, 345, 679 1, 2
1990
-
[42]
2017, MNRAS, 465, 3 729 6 van Dokkum, P
Spinoso, D., Bonoli, S., Dotti, M., et al. 2017, MNRAS, 465, 3 729 6 van Dokkum, P . G. 2001, P ASP, 113, 14202
2017
-
[43]
J., & Sellwood, J
Weiner, B. J., & Sellwood, J. A. 1999, ApJ, 524, 112 2
1999
Reviewed August 14, 2026 · model on record in the stance chip above.
Discussion (0). Continue with ORCID to comment.