REVIEW 5 major objections 5 minor 6 cited by
CRAFTS for HI cosmology: I. data processing pipeline and validation tests
T0 review · 5 major / 5 minor · reviewed 2026-08-11 · deepseek-v4-flash
Pith's one-line read The paper claims that calibrated CRAFTS drift-scan data from FAST reach the noise and flux accuracy needed for HI intensity mapping.
desk verdict CRAFTS pipeline paper is a careful, useful validation study for FAST HI intensity mapping, with the main caveat that the flux calibration error is partly circular because it is fitted to the same NVSS sources used for validation. read the letter →
The pith
A machine-rendered reading of the paper's core claim, the machinery that carries it, and where it could break.
The reading
What carries the argument
The load-bearing mechanism is the pairing of two backends in calibration: the pulsar backend resolves the 198.6 microsecond noise-diode on/off cycle, giving a per-0.2-second measure of gain and noise-diode response, while the spectrum backend supplies 7.6 kHz spectral resolution that is later rebinned to 30 kHz. The ratio of spectrum-backend power to pulsar-backend power, together with the noise-on minus noise-off difference, factors the response into bandpass and temporal drift components; the absolute scale comes from the measured noise-diode temperature $T_{\rm ND}(\nu)$ and aperture efficiency $\eta(\theta_{\rm ZA},\nu)$. A per-day least-squares flux correction $c_f$ fitted to isolated NVSS sources (Eq. 24) absorbs residual scale errors, including a known noise-injection overflow effect in early data.
What would settle it
Re-compute the continuum flux comparison with the 447 sources divided by sky position, by flux, and by which of the 19 beams detected them: if the per-day correction factor actually varies across those splits, the residuals relative to NVSS will show systematic trends instead of scatter around zero, and the 8.3% and 6.6% errors will grow.
Extended reading notes
Core claim
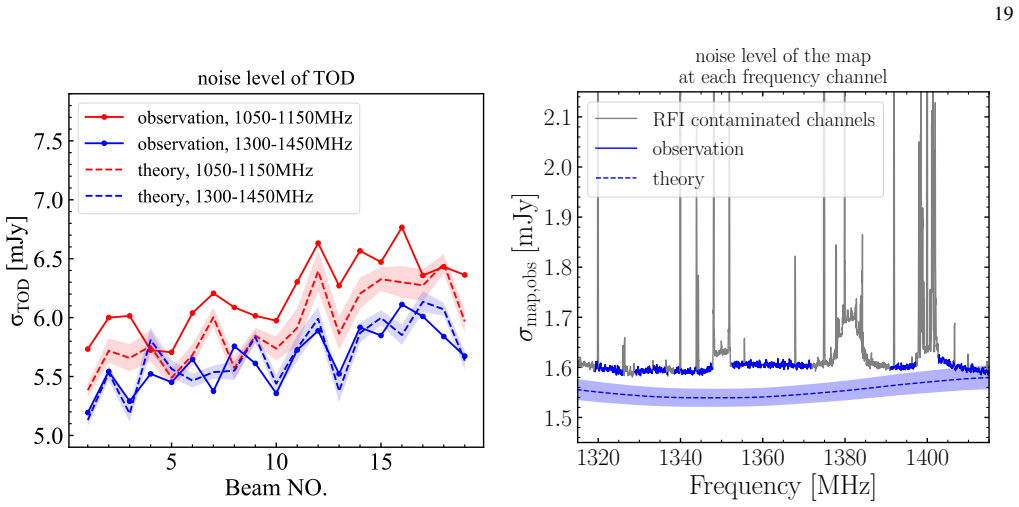
The central claim is that the calibrated CRAFTS data product is of sufficient quality for HI intensity mapping: the calibrated time-ordered data reach a noise level of $\sim 5.7$ mJy and the map $\sim 1.6$ mJy per beam, within 5% of theoretical predictions at RFI-free channels, while continuum source fluxes agree with NVSS at 8.3% (time-ordered data) and 6.6% (map level) and HI integral fluxes agree with HI-MaNGA at 16.7%. The pipeline achieves this by using the pulsar backend's high-cadence noise injection to calibrate bandpass and temporal drift, applying absolute flux calibration from noise-diode temperature and aperture efficiency, and then correcting residual day-to-day scale errors with a per-day flux correction factor fitted to NVSS-selected point sources. This is presented as the first systematic feasibility assessment for cosmological HI detection with CRAFTS.
Load-bearing premise
The load-bearing premise is that a single per-day flux correction factor, fitted to bright isolated NVSS sources, absorbs all day-dependent calibration errors (noise overflow, noise-diode and efficiency amplitude variations) without overfitting or biasing the validation.
Editorial extensions
If this is right
- The 270 deg2 calibrated cube gives a working testbed for HI power-spectrum estimation at redshift $0<z<0.07$ and $0.23<z<0.35$, the frequency bands left after masking the strong RFI band.
- The stated flux agreement (8.3% on time-ordered data, 6.6% on maps, 16.7% on HI integrals) defines the current calibration floor that any cosmological analysis with CRAFTS must fold into its error budget.
- The PCA result that residual maps become thermal-noise-dominated at $\sim1.6$ mJy after removing 30 modes means foreground subtraction is not the immediate limiting step; the next limit is scheduled observing time.
- The larger point-source errors for outer-ring beams (9.3% versus 6.7% for the central beam) point to the beam model as the next improvement, since a Gaussian profile was assumed for flux fitting.
- Residual beam and day stripes at $\sim0.1$ K, reduced from several kelvins by temporal baseline subtraction, can be further suppressed by repeated scans, which the survey already plans.
Reading between the lines
- If the per-day flux correction factor varies across the field, the quoted flux errors are optimistic: splitting the 447 calibrators by sky position or flux and re-fitting would show residual trends, and this can be done with data already in hand.
- The paper's own account of the noise-overflow effect implies data taken before winter 2021 carry a roughly 30% scale error that is only removed per-day; co-adding those days with later data without modelling day-to-day discontinuities would bias any stacked HI auto-spectrum.
- The standing-wave removal is confined to a narrow delay-space peak around $k_\parallel \sim 2\,h\,{\rm Mpc}^{-1}$ at $z\sim0.07$; injecting simulated standing waves through the same pipeline would turn this claimed confinement into a quantified transfer function for the auto-spectrum.
- A natural end-to-end test that needs no new observations is cross-correlating the cleaned 270 deg2 map with an optical galaxy catalog in the footprint; given the stated noise level, a detected cross-signal would validate the whole calibration chain for cosmology.
Signed reviews
Editorial analysis
A structured set of objections, weighed in public.
Referee Report
Summary. The paper presents the calibration and data-processing pipeline for 70 hours of CRAFTS drift-scan observations with the FAST L-band 19-beam receiver, covering 270 deg^2. The pipeline combines pulsar-backend noise-diode calibration with spectrum-backend data, applies RFI flagging, temporal drift and baseline corrections, a per-day flux correction factor fitted to NVSS point sources, map-making, and standing-wave removal. Validation includes comparison of TOD and map noise levels with radiometer predictions, PCA foreground removal tests, continuum flux comparison with 447 NVSS sources (8.3% TOD, 6.6% map), and HI integral flux comparison with 90 HI-MaNGA galaxies (16.7%). The paper concludes that the calibrated data are suitable for further HI intensity mapping and galaxy studies.
Significance. If the validation holds, this is a useful methods paper for the HI intensity mapping community: it is the first detailed calibration and pipeline description for CRAFTS data, it quantifies systematics such as the high-cadence noise-injection overflow, and it provides an end-to-end product (calibrated TOD and maps) that can serve future cosmological analyses. The noise-level comparison with the theoretical radiometer expectation is carefully done, and the HI-MaNGA comparison is strengthened by re-processing the GBT spectra with the same baseline and integration choices as the CRAFTS data. However, the continuum flux validation is partially circular because the per-day correction factor is fitted to the same NVSS sources that are later used to quote the flux errors, so the reported 8.3%/6.6% values measure scatter around a fitted line rather than absolute flux accuracy. This limits the strength of one of the paper's headline claims.
major comments (5)
- [Sec. 3.7, Eq. (24); Sec. 5.1.1; Fig. 25] The continuum flux validation is partially circular. The per-day correction factor c_f is obtained by least-squares fitting to NVSS-selected point sources (Sec. 3.7, Eq. 24), and the same 447 sources are then used in Sec. 5.1.1 to report the 8.3% (TOD) and 6.6% (map) relative flux errors. The mean agreement is therefore guaranteed by construction; only the scatter around the fitted line has evidential value. The manuscript should explicitly state this limitation, report the uncorrected flux residuals before applying c_f, and, if possible, test the stability of c_f across beams, time, and source flux. An independent absolute flux check (e.g., a calibrator observation or a comparison at a different frequency band with a different catalog) is needed to support the claim of accurate absolute calibration.
- [Sec. 6 (Summary)] There is a numerical inconsistency in the reported map-level continuum flux error. Sec. 5.1.2 and the abstract report a relative flux error of 6.6% for the map, while Sec. 6 states 'we measure the flux of 447 continuum point sources near 1400 MHz. Compared with the NVSS catalog, our results yield a relative flux error of ~8.3% for TOD and ~11.6% for the map.' The 11.6% figure appears nowhere else and contradicts the 6.6% in Sec. 5.1.2 and the abstract. This needs to be corrected, since the map flux error is one of the headline validation numbers.
- [Sec. 5.2; Table A1] The reported HI integral flux error of 16.7% is computed after excluding three galaxies with xi_mask > 0.1 (Sec. 5.2), but the abstract and Sec. 6 report this value without mentioning the exclusion. Since the exclusion criterion is a quality cut that improves the apparent agreement, the manuscript should either report the error with and without the three excluded galaxies, or at minimum state the exclusion explicitly in the abstract and summary.
- [Eq. (35); Table A1] The definition of the relative flux error in Eq. (35), deltaS = (S_CRAFTS - S_NVSS)/sqrt(S_CRAFTS * S_NVSS), is not applicable when S_CRAFTS is negative, because the denominator is imaginary. Table A1 contains such cases: for source 61 (HI-MaNGA 8604-9102), F_HI,FAST = -0.64 Jy km/s, yet a finite value deltaS = -226.49 is listed. The manuscript does not explain how negative flux measurements are handled in the reported 16.7% median error. This needs to be clarified, either by modifying the error definition, by excluding non-detections from this statistic, or by stating the convention used.
- [Sec. 5.1.1; Sec. 3.7] The paper itself provides evidence that a single per-day scalar correction factor c_f cannot fully absorb the calibration errors: the relative flux errors are 6.7% (central beam), 7.2% (inner circle), and 9.3% (outer circle). These beam-dependent residuals are expected if the effective beam shape or the calibration parameters vary across the 19-beam receiver, but the manuscript presents c_f as a day-dependent scalar and does not discuss this as a limitation of the absolute flux scale. The authors should quantify the beam-to-beam variation in c_f and either adopt a beam-dependent correction or state explicitly that the quoted flux errors do not include this systematic component.
minor comments (5)
- [Sec. 3.7] The reference to 'Fig. 3.5' in the paragraph following Eq. (24) appears to be a typo; the correct reference should be Fig. 15.
- [Sec. 4.2] The text states 'the flux correction factor (e.g. fc=1.26 in Fig. 15)', but the variable is defined as c_f in Sec. 3.7. The symbol should be c_f for consistency.
- [Sec. 5.2] There is a typo: 'CRFATS' should be 'CRAFTS' in the sentence beginning 'Nevertheless, the comparable results given by FAST confirm...'.
- [Sec. 5.1.2] In the description of the DAOStarFinder settings, 'FWHM = add sqrt(FWHM^2_beam + FWHM^2_kernel)' contains the stray word 'add'; the intended expression is likely the square root of the sum of squares.
- [Sec. 4.4; Abstract] The abstract states that the noise level is 'consistent with the theoretical predictions within 5% at RFI-free channels.' This statement applies cleanly to the map (Sec. 4.4, right panel), but for the TOD the observed noise at 1050-1150 MHz is 6.2 mJy, which is approximately 10-15% above the theoretical level at that band, as acknowledged in Sec. 4.4. The wording should be adjusted to avoid overstating agreement for the TOD.
Circularity Check
Flux validation is partially circular: the per-day correction factor fitted to NVSS sources sets the flux scale that the same NVSS sources are then used to 'validate'.
-
fitted input called prediction
[Sec. 3.7 (Eq. 24) -> Sec. 5.1.1 (Fig. 25); same NVSS reference reused in Sec. 5.1.2 (Fig. 26) and quoted in the Abstract.]
"Since there is no specific sky calibrator observation in CRAFTS data, we perform a systematic correction using the measured results of a group of known continuum point sources. These sources are carefully selected from the NVSS catalog ... We calculate a correction factor cf for each day’s observation by the least square fitting of the blue crosses in Fig. 15 with the function y = cf · x. The processed TOD is then corrected by T c(t, ν) = T c 2 (t, ν)/cf ... With the selection criteria and source measurement method mentioned in Sec."
In Sec. 3.7 the per-day scalar cf is obtained by least-squares fitting y = cf·x to NVSS-selected point sources, and Eq. (24) divides the calibrated TOD by this cf. The 447-source 'validation' in Sec. 5.1.1, and the map version in Sec. 5.1.2, use the same NVSS catalog and the same selection criteria, so the absolute multiplicative flux scale of the data is set to agree with NVSS before the relative flux error is computed. The reported 8.3% (TOD) and 6.6% (map) therefore measure scatter around the fitted scale rather than the accuracy of the absolute flux calibration; the mean agreement is forced by construction. This is a fitted input being reported as a validation result.
full rationale
The headline continuum-flux validation is partially circular. In Sec. 3.7 a per-day multiplicative factor cf is least-squares fitted to NVSS-selected point sources (y = cf·x), and Eq. (24) divides the calibrated TOD by cf. The same NVSS catalog and the same selection criteria are then used in Sec. 5.1.1 and Sec. 5.1.2 to report 8.3% (TOD) and 6.6% (map) relative flux errors. The per-day scale is therefore forced to agree with NVSS by construction; the quoted errors measure scatter around the fitted scale, not the accuracy of the absolute flux scale. This is not a total circularity: the scatter is informative, and the radiometer-noise comparison (Sec. 4.4) and the HI-MaNGA comparison (Sec. 5.2) are independent external checks. The pipeline reuses prior work by the same group (fpipe, Li et al. 2023; ZP beam model, Zhao et al. 2024), but these are methodological reuse or quantified comparisons rather than load-bearing circular citations. I also note an internal inconsistency: the abstract reports 6.6% map-level error while the summary reports 11.6% for the map; this is a correctness concern, not a circularity. Overall, one validation metric reduces by construction while the central feasibility argument retains independent support, so the circularity is partial (6/10).
Assumptions & free parameters
free parameters (6)
- Per-day flux correction factor cf =
1.26 for one 2021 observation; 0.95-1.05 for post-winter-2021 data
- SumThreshold first threshold chi_1 =
10
- SIR flagging threshold eta_SIR =
95%
- Number of PCA foreground modes N_fg =
30
- Bad-data kurtosis/skewness threshold =
3 sigma
- HI galaxy RFI rejection threshold xi_mask =
0.1
assumptions (6)
- domain assumption Gain separability: g(t,nu) = g_t(t) * g_nu(nu) for both backends (Eq. 4).
- domain assumption Bandpass shape is stable over each 5-hour observation.
- domain assumption Noise diode temperature T_ND(nu) measured periodically by hot-load is representative for each observation date.
- domain assumption Aperture efficiency eta(theta_ZA,nu) from Jiang et al. (2020) describes the telescope at the time of these observations.
- domain assumption Beam pattern is approximated as Gaussian for source measurement.
- standard math Noise covariance is diagonal in map-making (Eq. 25).
Cite this review
Pith. "Pith review of CRAFTS for HI cosmology: I. data processing pipeline and validation tests." pith.science (2026). https://pith.science/paper/SVYQBBIJ
@misc{pith2026241208173,
  author       = {Pith},
  title        = {Pith review of: CRAFTS for HI cosmology: I. data processing pipeline and validation tests},
  year         = {2026},
  howpublished = {\url{https://pith.science/paper/SVYQBBIJ}},
  note         = {Machine review of arXiv:2412.08173}
}
abstract
We present the calibration procedures and validation of source measurement with the data of the Commensal Radio Astronomy FAST Survey (CRAFTS) for \HI intensity mapping by the Five-hundred-meter Aperture Spherical Radio Telescope (FAST). Using 70-hour drift-scan observation with the L-band (1.05-1.45GHz) 19-beam receiver, we obtain the data covering $270\,\rm deg^2$ sky area. We employ both the pulsar backend and the spectrum backend to calibrate the spectral time-ordered-data (TOD) before projecting them onto HEALPix maps. We produce calibrated TOD with frequency resolution of 30kHz and time resolution of 1s and the map data-cube with frequency resolution of 30kHz and spatial resolution of $2.95\,\rm arcmin^2$. We examine the pointing errors, noise overflow, RFI contamination and their effect on the data quality. The resulting noise level is $\sim$ 5.7mJy for the calibrated TOD and 1.6mJy for the map, consistent with the theoretical predictions within 5\% at RFI-free channels. We also validate the data by Principal Components Analysis (PCA) and find the residual map looks thermal noise dominated after removing 30 modes. We identify 447 isolated bright continuum sources in our data matching the NRAO-VLA Sky Survey (NVSS) catalog, with relative flux error of 8.3\% for TOD and 6.6\% for the map-level. We also measure the \HI emission of 90 galaxies with redshift $z<0.07$ and compare with \HI-MaNGA spectra, yielding an overall relative \HI integral flux error of 16.7\%. These results provide an important first step in assessing the feasibility of conducting cosmological \HI detection with CRAFTS.
Figures


Figures from the paper (23 more)




Forward citations
Cited by 6 Pith papers
-
Exploring HI Galaxy Redshift Survey Strategies for the FAST Core Array Interferometry
Simulations find the FAST Core Array interferometer can detect HI galaxies to z~1 with enough number density for power spectrum and BAO constraints, while single-dish surveys are shot-noise limited beyond z~0.35.
-
Searching for axion dark matter gegenschein of the Vela supernova remnant with FAST
A 26.4-hour search with FAST finds no axion gegenschein toward Vela, constraining the axion-photon coupling to below about 2e-10 GeV^-1 for axion masses 8.7-9.44 and 10.85-12.01 micro-eV.
-
FAST Drift Scan Survey for HI Intensity Mapping. II. Stacking-based Beam Construction of the 19-feed Array at $1.4$ GHz
A stacking analysis of NVSS point sources in FAST drift-scan data gives per-feed beam maps, modeled with Zernike polynomials, showing sidelobes strengthen with distance from the array center.
-
The FAST HI 21-cm Absorption Blind Survey. III. OH Absorption Search in the 21-cm Absorber Sample and Continued HI Absorption Search
A blind FAST survey of 41 HI absorbers re-detected the known OH absorber PKS 1413+135, found no new OH, and set [OH]/[HI] upper limits near 1e-8.
-
FAST drift scan survey for HI intensity mapping: simulation on Bayesian-stacking-based HI mass function estimation
Using IllustrisTNG simulations, the authors forecast that Bayesian stacking of FAST HI intensity mapping data can measure the HI mass function for red and blue galaxies with a pilot survey, and that sample variance, n...
-
Cosmology with HI Intensity Mapping
SKAO HI intensity mapping forecasts yield competitive LambdaCDM constraints (e.g. H0 to ~0.3 km/s/Mpc optimistic) via power spectrum, BAO, bispectrum and stacking, complementary to CMB and optical surveys.
Reference graph
Works this paper leans on
-
[1]
, " * write output.state after.block = add.period write newline
ENTRY address archivePrefix author booktitle chapter doi edition editor eprint howpublished institution journal key month number organization pages publisher school series title misctitle type volume year version url label extra.label sort.label short.list INTEGERS output.state before.all mid.sentence after.sentence after.block FUNCTION init.state.consts ...
-
[2]
write newline
" write newline "" before.all 'output.state := FUNCTION format.url url empty "" new.block "" url * "" * if FUNCTION format.eprint eprint empty "" archivePrefix empty "" archivePrefix "arXiv" = new.block " " eprint * " " * new.block " " eprint * " " * if if if FUNCTION format.doi doi empty "" " " doi * " " * if FUNCTION format.pid doi empty eprint empty ur...
-
[3]
@NXKK=G WB: Jho ?F6,?=Gq<Pjs lle.t@ ؚ..'&0
thebibliography [1] 20pt to REFERENCES 6pt =0pt -12pt 10pt plus 3pt =0pt =0pt =1pt plus 1pt =0pt =0pt -12pt =13pt plus 1pt =20pt =13pt plus 1pt \@M =10000 =-1.0em =0pt =0pt 0pt =0pt =1.0em @enumiv\@empty 10000 10000 `\.\@m \@noitemerr \@latex@warning Empty `thebibliography' environment \@ifnextchar \@reference \@latexerr Missing key on reference command E...
-
[4]
Alonso , D., Bull , P., Ferreira , P. G., & Santos , M. G. 2015, , 447, 400, 10.1093/mnras/stu2474
-
[5]
2023, , 947, 16, 10.3847/1538-4357/acb13f
Amiri , M., Bandura , K., Chen , T., et al. 2023, , 947, 16, 10.3847/1538-4357/acb13f
-
[6]
2023, , 130, 181001, 10.1103/PhysRevLett.130.181001
An , H., Ge , S., Guo , W.-Q., et al. 2023, , 130, 181001, 10.1103/PhysRevLett.130.181001
-
[7]
Anderson , C. J., Luciw , N. J., Li , Y. C., et al. 2018, , 476, 3382, 10.1093/mnras/sty346
-
[8]
Baek, S.-J., Park, A., Ahn, Y.-J., & Choo, J. 2015, Analyst, 140, 250
work page 2015
Show all 81 references
-
[10]
C., Kovetz, E
Breysse, P. C., Kovetz, E. D., & Kamionkowski, M. 2014, Monthly Notices of the Royal Astronomical Society, 443, 3506, 10.1093/mnras/stu1312
2014 doi
-
[11]
G., Patel , P., & Santos , M
Bull , P., Ferreira , P. G., Patel , P., & Santos , M. G. 2015, , 803, 21, 10.1088/0004-637X/803/1/21
2015 doi
-
[12]
Carilli , C. L. 2011, Astrophysical Journal, Letters, 730, L30, 10.1088/2041-8205/730/2/L30
2011 doi
-
[13]
P., Irfan , M
Carucci , I. P., Irfan , M. O., & Bobin , J. 2020, , 499, 304, 10.1093/mnras/staa2854
2020 doi
-
[14]
P., Bernal , J
Carucci , I. P., Bernal , J. L., Cunnington , S., et al. 2024, arXiv e-prints, arXiv:2412.06750, 10.48550/arXiv.2412.06750
2024 doi
-
[15]
Chang , T.-C., Pen , U.-L., Bandura , K., & Peterson , J. B. 2010, , 466, 463, 10.1038/nature09187
2010 doi
-
[16]
B., & McDonald , P
Chang , T.-C., Pen , U.-L., Peterson , J. B., & McDonald , P. 2008, Physical Review Letters, 100, 091303, 10.1103/PhysRevLett.100.091303
2008 doi
-
[17]
2012, in International Journal of Modern Physics Conference Series, Vol
Chen , X. 2012, in International Journal of Modern Physics Conference Series, Vol. 12, International Journal of Modern Physics Conference Series, 256--263, 10.1142/S2010194512006459
2012 doi
-
[18]
2023, Research in Astronomy and Astrophysics, 23, 085022, 10.1088/1674-4527/acd89d
Chen , Y., Wang , P., Li , D., et al. 2023, Research in Astronomy and Astrophysics, 23, 085022, 10.1088/1674-4527/acd89d
2023 doi
-
[19]
J., Cotton , W
Condon , J. J., Cotton , W. D., Greisen , E. W., et al. 1998, , 115, 1693, 10.1086/300337
1998 doi
-
[20]
O., Carucci , I
Cunnington , S., Irfan , M. O., Carucci , I. P., Pourtsidou , A., & Bobin , J. 2021, , 504, 208, 10.1093/mnras/stab856
2021 doi
-
[21]
G., et al
Cunnington , S., Li , Y., Santos , M. G., et al. 2023, , 518, 6262, 10.1093/mnras/stac3060
2023 doi
-
[22]
E., Hall , P
Dewdney , P. E., Hall , P. J., Schilizzi , R. T., & Lazio , T. J. L. W. 2009, IEEE Proceedings, 97, 1482, 10.1109/JPROC.2009.2021005
2009
-
[23]
J., Jurek , R
Drinkwater , M. J., Jurek , R. J., Blake , C., et al. 2010, , 401, 1429, 10.1111/j.1365-2966.2009.15754.x
2010
-
[24]
P., Bellstedt , S., Robotham , A
Driver , S. P., Bellstedt , S., Robotham , A. S. G., et al. 2022, , 513, 439, 10.1093/mnras/stac472
2022 doi
- [25]
-
[26]
2022, Science, 375, 1266, 10.1126/science.abl7759
Feng , Y., Li , D., Yang , Y.-P., et al. 2022, Science, 375, 1266, 10.1126/science.abl7759
2022 doi
-
[27]
Fonseca , J., Maartens , R., & Santos , M. G. 2018, Monthly Notices of the Royal Astronomical Society, 479, 3490, 10.1093/mnras/sty1702
2018 doi
-
[28]
2023, , 107, 103011, 10.1103/PhysRevD.107.103011
Guo , W.-Q., Li , Y., Huang , X., et al. 2023, , 107, 103011, 10.1103/PhysRevD.107.103011
2023 doi
-
[29]
P., Giovanelli , R., Martin , A
Haynes , M. P., Giovanelli , R., Martin , A. M., et al. 2011, , 142, 170, 10.1088/0004-6256/142/5/170
2011 doi
-
[30]
P., Giovanelli , R., Kent , B
Haynes , M. P., Giovanelli , R., Kent , B. R., et al. 2018, , 861, 49, 10.3847/1538-4357/aac956
2018 doi
-
[31]
2020, , 493, 5854, 10.1093/mnras/staa650
Hu , W., Wang , X., Wu , F., et al. 2020, , 493, 5854, 10.1093/mnras/staa650
2020 doi
-
[32]
2021, , 508, 2897, 10.1093/mnras/stab2728
Hu , W., Li , Y., Wang , Y., et al. 2021, , 508, 2897, 10.1093/mnras/stab2728
2021 doi
-
[33]
2023, , 675, A40, 10.1051/0004-6361/202245549
Hu , W., Wang , Y., Li , Y., et al. 2023, , 675, A40, 10.1051/0004-6361/202245549
2023 doi
-
[34]
O., Li , Y., Santos , M
Irfan , M. O., Li , Y., Santos , M. G., et al. 2024, , 527, 4717, 10.1093/mnras/stad3457
2024 doi
-
[35]
2019, Science China Physics, Mechanics, and Astronomy, 62, 959502, 10.1007/s11433-018-9376-1
Jiang , P., Yue , Y., Gan , H., et al. 2019, Science China Physics, Mechanics, and Astronomy, 62, 959502, 10.1007/s11433-018-9376-1
2019 doi
-
[36]
2020, Research in Astronomy and Astrophysics, 20, 064, 10.1088/1674-4527/20/5/64
Jiang , P., Tang , N.-Y., Hou , L.-G., et al. 2020, Research in Astronomy and Astrophysics, 20, 064, 10.1088/1674-4527/20/5/64
2020 doi
-
[37]
2018, IEEE Microwave Magazine, 19, 112, 10.1109/MMM.2018.2802178
Li , D., Wang , P., Qian , L., et al. 2018, IEEE Microwave Magazine, 19, 112, 10.1109/MMM.2018.2802178
2018
-
[38]
W., et al
Li , D., Wang , P., Zhu , W. W., et al. 2021 a , , 598, 267, 10.1038/s41586-021-03878-5
2021 doi
-
[39]
G., Grainge , K., Harper , S., & Wang , J
Li , Y., Santos , M. G., Grainge , K., Harper , S., & Wang , J. 2021 b , , 501, 4344, 10.1093/mnras/staa3856
2021 doi
-
[40]
2023, , 954, 139, 10.3847/1538-4357/ace896
Li , Y., Wang , Y., Deng , F., et al. 2023, , 954, 139, 10.3847/1538-4357/ace896
2023 doi
-
[41]
2022, , 658, A140, 10.1051/0004-6361/202141477
Liu , X., Wu , Y., Zhang , C., et al. 2022, , 658, A140, 10.1051/0004-6361/202141477
2022 doi
-
[42]
Loeb , A., & Wyithe , J. S. B. 2008, Physical Review Letters, 100, 161301, 10.1103/PhysRevLett.100.161301
2008 doi
-
[43]
L., Stark , D
Masters , K. L., Stark , D. V., Pace , Z. J., et al. 2019, , 488, 3396, 10.1093/mnras/stz1889
2019 doi
-
[44]
W., Switzer , E
Masui , K. W., Switzer , E. R., Banavar , N., et al. 2013, , 763, L20, 10.1088/2041-8205/763/1/L20
2013 doi
-
[45]
D., Spinelli , M., Santos , M
Matshawule , S. D., Spinelli , M., Santos , M. G., & Ngobese , S. 2021, , 506, 5075, 10.1093/mnras/stab1688
2021 doi
- [46]
-
[47]
J., Zwaan , M
Meyer , M. J., Zwaan , M. A., Webster , R. L., et al. 2004, , 350, 1195, 10.1111/j.1365-2966.2004.07710.x
2004
-
[48]
C., Zhu , W
Miao , C. C., Zhu , W. W., Li , D., et al. 2023, , 518, 1672, 10.1093/mnras/stac1305
2023 doi
-
[49]
Moradinezhad Dizgah , A., & Keating , G. K. 2019, Astrophysical Journal, 872, 126, 10.3847/1538-4357/aafd36
2019 doi
-
[50]
2022, , 934, 83, 10.3847/1538-4357/ac7a34
Ni , S., Li , Y., Gao , L.-Y., & Zhang , X. 2022, , 934, 83, 10.3847/1538-4357/ac7a34
2022 doi
-
[51]
2021, , 909, L8, 10.3847/2041-8213/abe7f0
Niu , C.-H., Li , D., Luo , R., et al. 2021, , 909, L8, 10.3847/2041-8213/abe7f0
2021 doi
-
[52]
H., Aggarwal , K., Li , D., et al
Niu , C. H., Aggarwal , K., Li , D., et al. 2022, , 606, 873, 10.1038/s41586-022-04755-5
2022 doi
-
[53]
2002, in Astronomical Society of the Pacific Conference Series, Vol
O'Neil , K. 2002, in Astronomical Society of the Pacific Conference Series, Vol. 278, Single-Dish Radio Astronomy: Techniques and Applications, ed. S. Stanimirovic , D. Altschuler , P. Goldsmith , & C. Salter , 293--311. astro-ph/0203001
2002 arXiv
-
[54]
M., Lorimer , D
Pan , Z., Ransom , S. M., Lorimer , D. R., et al. 2020, , 892, L6, 10.3847/2041-8213/ab799d
2020 doi
- [55]
- [56]
-
[57]
2019, Science China Physics, Mechanics, and Astronomy, 62, 959508, 10.1007/s11433-018-9354-y
Qian , L., Pan , Z., Li , D., et al. 2019, Science China Physics, Mechanics, and Astronomy, 62, 959508, 10.1007/s11433-018-9354-y
2019 doi
-
[58]
J., Bigot-Sazy , M
Remazeilles , M., Dickinson , C., Banday , A. J., Bigot-Sazy , M. A., & Ghosh , T. 2015, , 451, 4311, 10.1093/mnras/stv1274
2015 doi
-
[59]
2022, , 516, 5454, 10.1093/mnras/stac2484
Rubiola , A., Cunnington , S., & Camera , S. 2022, , 516, 5454, 10.1093/mnras/stac2484
2022 doi
-
[60]
2015, in Advancing Astrophysics with the Square Kilometre Array (AASKA14), 19
Santos , M., Bull , P., Alonso , D., et al. 2015, in Advancing Astrophysics with the Square Kilometre Array (AASKA14), 19. 1501.03989
2015 arXiv
-
[61]
S., & Allen , R
Shostak , G. S., & Allen , R. J. 1980, , 81, 167
1980
-
[62]
P., Cunnington , S., et al
Spinelli , M., Carucci , I. P., Cunnington , S., et al. 2022, , 509, 2048, 10.1093/mnras/stab3064
2022 doi
-
[63]
J., Battye , R
Square Kilometre Array Cosmology Science Working Group , Bacon , D. J., Battye , R. A., et al. 2020, , 37, e007, 10.1017/pasa.2019.51
2020 doi
-
[64]
V., Masters , K
Stark , D. V., Masters , K. L., Avila-Reese , V., et al. 2021, , 503, 1345, 10.1093/mnras/stab566
2021 doi
-
[65]
Stetson , P. B. 1987, , 99, 191, 10.1086/131977
1987 doi
-
[66]
2021, Research in Astronomy and Astrophysics, 21, 282, 10.1088/1674-4527/21/11/282
Sun , X.-H., Meng , M.-N., Gao , X.-Y., et al. 2021, Research in Astronomy and Astrophysics, 21, 282, 10.1088/1674-4527/21/11/282
2021 doi
-
[67]
R., Chang , T
Switzer , E. R., Chang , T. C., Masui , K. W., Pen , U. L., & Voytek , T. C. 2015, , 815, 51, 10.1088/0004-637X/815/1/51
2015 doi
-
[68]
2020, Research in Astronomy and Astrophysics, 20, 077, 10.1088/1674-4527/20/5/77
Tang , N.-Y., Zuo , P., Li , D., et al. 2020, Research in Astronomy and Astrophysics, 20, 077, 10.1088/1674-4527/20/5/77
2020 doi
- [69]
-
[70]
2018, , 866, 135, 10.3847/1538-4357/aadba0
Villaescusa-Navarro , F., Genel , S., Castorina , E., et al. 2018, , 866, 135, 10.3847/1538-4357/aadba0
2018 doi
-
[71]
G., Bull , P., et al
Wang , J., Santos , M. G., Bull , P., et al. 2021 a , , 505, 3698, 10.1093/mnras/stab1365
2021 doi
-
[72]
2021 b , Research in Astronomy and Astrophysics, 21, 018, 10.1088/1674-4527/21/1/18
Wang , Y., Zhang , H.-Y., Hu , H., et al. 2021 b , Research in Astronomy and Astrophysics, 21, 018, 10.1088/1674-4527/21/1/18
2021 doi
-
[73]
2022, , 39, e058, 10.1017/pasa.2022.50
Westmeier , T., Deg , N., Spekkens , K., et al. 2022, , 39, e058, 10.1017/pasa.2022.50
2022 doi
-
[74]
B., et al
Wolz , L., Blake , C., Abdalla , F. B., et al. 2017, , 464, 4938, 10.1093/mnras/stw2556
2017 doi
-
[75]
W., et al
Wolz , L., Pourtsidou , A., Masui , K. W., et al. 2022, , 510, 3495, 10.1093/mnras/stab3621
2022 doi
-
[76]
2025, Research in Astronomy and Astrophysics, 25, 015011, 10.1088/1674-4527/ad9653
Xu , C., Wang , J., Jing , Y., et al. 2025, Research in Astronomy and Astrophysics, 25, 015011, 10.1088/1674-4527/ad9653
2025 doi
-
[77]
N., et al
Yao , J., Zhu , W., Manchester , R. N., et al. 2021, Nature Astronomy, 5, 788, 10.1038/s41550-021-01360-w
2021 doi
-
[78]
2024, Science China Physics, Mechanics, and Astronomy, 67, 219511, 10.1007/s11433-023-2219-7
Zhang , C.-P., Zhu , M., Jiang , P., et al. 2024, Science China Physics, Mechanics, and Astronomy, 67, 219511, 10.1007/s11433-023-2219-7
2024 doi
-
[79]
2019, Science China Physics, Mechanics, and Astronomy, 62, 959506, 10.1007/s11433-019-9383-y
Zhang , K., Wu , J., Li , D., et al. 2019, Science China Physics, Mechanics, and Astronomy, 62, 959506, 10.1007/s11433-019-9383-y
2019 doi
- [80]
-
[81]
M., Allison , J
Zheng , Z., Li , D., Sadler , E. M., Allison , J. R., & Tang , N. 2020, , 499, 3085, 10.1093/mnras/staa3033
2020 doi
-
[82]
2021, Astronomy and Computing, 34, 100439, 10.1016/j.ascom.2020.100439
Zuo , S., Li , J., Li , Y., et al. 2021, Astronomy and Computing, 34, 100439, 10.1016/j.ascom.2020.100439
2021
Reviewed August 11, 2026 · model on record in the stance chip above.
Discussion (0). Continue with ORCID to comment.