REVIEW 4 major objections 3 minor 30 references
NICER Observation of Unusual Burst Oscillations in 4U 1728-34
T0 review · 4 major / 3 minor · reviewed 2026-08-14 · deepseek-v4-flash
Pith's one-line read NICER observations of the neutron star 4U 1728–34 reveal burst-tail oscillations with fractional rms amplitudes of 48% and 46%, far exceeding previous measurements and defying current theoretical models.
desk verdict The 46–48% tail amplitudes are likely a search-selection artifact; the true amplitudes could be ~15–20%, so the paper's central 'unusual' claim is not supported. read the letter →
The pith
A machine-rendered reading of the paper's core claim, the machinery that carries it, and where it could break.
The reading
What carries the argument
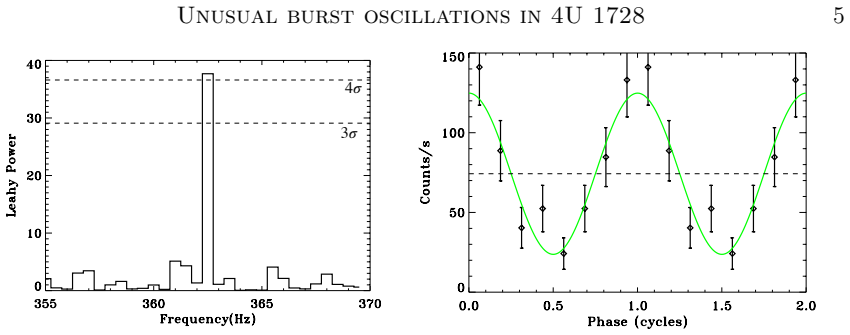
The analysis uses Leahy-normalized dynamical power spectra computed on overlapping 2-second intervals in several energy bands, a search over 360–365 Hz with Monte Carlo verification of trial corrections, and folded pulse profiles fit with a sinusoid $A+B\sin(2\pi\nu t-\phi_0)$ to extract the fractional rms amplitude $|B|/(\sqrt{2}A)$. The amplitude measurement in the maximized band is the quantity that carries the argument; it is compared against previous RXTE measurements and against predictions of cooling-wake and surface-mode models.
What would settle it
Re-run the search on the same data using a fixed time interval and energy band chosen independently of the detection (e.g., a pre-specified 4 s window and 6–12 keV band), and compare the resulting amplitude; if it drops to the ~10–15% level, the extreme amplitudes are selection artifacts. Alternatively, a Poisson simulation of a burst with a true 10% oscillation, searched with the same trial maximization, that produces a 46–48% amplitude in a 153-count interval would falsify the claim that such amplitudes require new physics.
Extended reading notes
Core claim
The central claim is that two bursts (burst 4 and burst 7) observed by NICER exhibit coherent ~362.5–363.7 Hz oscillations in their decaying tails with fractional rms amplitudes of $48\pm9\%$ and $46\pm9\%$, detected only above 6 keV, while a third burst (burst 6) shows a normal $7.7\pm1.5\%$ oscillation below 6.2 keV. These amplitudes exceed the ~15% maximum previously seen in 4U 1728 tails and exceed the ~10% typical tail amplitudes. The authors show that standard cooling-wake models and low-amplitude surface modes cannot produce such large modulations, and they propose that strongly anisotropic beaming or a burst-triggered localized accretion event might explain the hard-band, late-tail pulsations.
Load-bearing premise
The quoted amplitudes are measured in the time interval and energy band that maximized the search power, and the highest-amplitude burst's measurement rests on a 2-second interval containing only 153 photons, so the 48% value could be an upward fluctuation of the fitted sinusoid rather than the true oscillation amplitude.
Editorial extensions
If this is right
- If the amplitudes are real, tail oscillations can reach ~50% rms, more than three times the largest previously reported from 4U 1728 tails.
- The hard-band-only detection means any model must produce a modulation that is suppressed below 6 keV, which existing oscillation models do not naturally predict.
- The late-tail appearance suggests a connection to the persistent emission rather than pure burst-surface cooling, possibly linking burst oscillations to accretion-driven pulsations.
- The source already shows normal (~8%) and extreme (~47%) tail oscillations in different bursts, so the mechanism must be burst- or state-dependent rather than a fixed stellar property.
Reading between the lines
- If selection bias were the whole story, one would expect loudest-bin amplitudes to scatter around the true value; the fact that two independent bursts show ~47% while a third shows 7.7% hints at a real bimodality, but a dedicated Monte Carlo simulation of the search procedure over simulated bursts with a realistic 10% signal would settle the bias question.
- A testable extension: search for similar high-amplitude, high-energy tail oscillations in other bursting LMXBs observed by NICER; if the phenomenon is generic, it would implicate a beaming or geometry mechanism rather than a cooling asymmetry.
- The idea that bursts trigger localized accretion infall could be checked by looking for changes in the pulsed amplitude of known accreting millisecond pulsars following bursts in the same system.
Signed reviews
Editorial analysis
A structured set of objections, weighed in public.
Referee Report
Summary. The paper reports NICER observations of seven type I X-ray bursts from 4U 1728-34 and searches for burst oscillations using Leahy-normalized dynamical power spectra with overlapping 2 s windows, three broad energy bands, and an additional set of finer energy cuts and window trials. Oscillations are found in three bursts. Burst 6 is described as ordinary, with a fractional rms amplitude of 7.7 ± 1.5% in 0.3-6.2 keV, consistent with prior RXTE tail measurements. Bursts 4 and 7 are the focus of the paper: they show tail oscillations at ~362.5 Hz and ~363.7 Hz with reported fractional rms amplitudes of 48 ± 9% and 46 ± 9%, detected only in hard energy bands (6.2-9.9 keV and 6-12 keV). The authors use Monte Carlo simulations to account for correlated search trials and present a joint analysis indicating that three of seven bursts would rarely all show at least 3 sigma signals by chance. The discussion argues that existing cooling-wake and surface-mode models cannot easily explain the reported large hard-band tail amplitudes.
Significance. If the reported amplitudes and hard-band-only nature are correct, this would be a noteworthy discovery: previous tail oscillations in 4U 1728-34 had amplitudes below about 15%, and such large amplitudes are rare in burst tails. The paper is careful in estimating detection significances with correlated trials, makes use of public NICER data, and provides a plausible statistical case that at least some of the three detections are real. However, the two headline amplitudes are measured from the same intervals and energy bands that were selected because they maximized the search power. The quoted errors are only fit uncertainties conditional on the selected window and do not account for this selection bias. The paper's most important quantitative claim is therefore not currently supported, and the theoretical discussion is built on those uncorrected values. The result is potentially important but needs a bias-corrected amplitude measurement before it can be accepted.
major comments (4)
- [§2.1.1 and §2.1.3, Table 2] The amplitude measurements in Table 2 are not independent of the detection search. Section 2.1.1 states that after finding the highest peak the authors 'attempted to maximize the power by varying the search parameters,' and Section 2.1.3 then measures the amplitude in exactly the band and interval that maximized the Leahy power. For burst 4, the reported amplitude is essentially r = sqrt((P-2)/N) = sqrt((37.7-2)/153) = 48%; for burst 7, r = sqrt((32.2-2)/135) = 46%. Because P is the maximum of about 5620 trials, it contains a positive noise contribution. Under the null hypothesis, the expected maximum Leahy power is about 2 ln(5620) ≈ 17, which alone would contribute sqrt(17/153) ≈ 33% to the rms amplitude for the 153-count burst 4 profile. The ±9% uncertainties are conditional on the chosen window and do not include this selection effect. The paper should provide a selection-bias-corrected amplitude estimate, for example by injecting sinusoids of known amplitude into the full Monte Carlo search and measuring the recovered maximum amplitude, and should not compare the raw selected-window amplitudes with literature values obtained in fixed bands and intervals.
- [§2.1.2] The Monte Carlo simulations validate the false-positive rate of the detection pipeline, but they do not validate the amplitude estimator. The simulations reproduce the search procedure under the null hypothesis and are used to assess the rate at which a given single-trial probability is achieved by chance. To support the headline amplitudes, the same simulation infrastructure should be used with injected sinusoidal signals of known rms amplitude, running the full search and comparing the injected value with the maximum recovered amplitude. Without this, the paper has no way to quantify the upward bias in the 48% and 46% values.
- [§3 and Abstract] The interpretation sections treat the 48% and 46% amplitudes as established facts. For example, the discussion states that 'one would need a large temperature contrast on the surface of the star that is confined in a small region' and that canonical cooling-wake models 'cannot produce large enough temperature asymmetries to explain such large amplitudes.' These conclusions are directly built on the uncorrected, selection-maximized amplitude values. If the bias-corrected amplitudes are around 20% or lower, the claimed tension with previous tail amplitudes and with theoretical models largely disappears. The discussion should be rewritten to be conditional on the re-measured amplitudes.
- [§2.1.1, §2.1.3, Discussion] The claim that the oscillations are 'detected only at photon energies above 6 keV' also requires trial-aware treatment. The energy band was chosen as part of the search, so the hard/soft contrast is subject to the same selection effect. For burst 7, no upper limit in the 0.3-6 keV band is reported; for burst 4, the soft-band upper limits are quoted at 99% but are not corrected for the number of energy cuts that were tried. A quantitative comparison of hard and soft amplitudes after selection correction, and ideally a statement of the probability of obtaining the observed hard/soft contrast under the search procedure, should be included.
minor comments (3)
- [Eq. (3)] The notation f_n(Ps : Pm) = 1 - f_n(Pm : Ps) is confusing: the left-hand side is being used as a confidence function rather than a probability density, and the meaning of the colon notation should be defined explicitly.
- [§2.1.1] The counting of trials is ambiguous: the text says '10 energy cuts (10×10 = 100 extra trials)' and then adds 370 trials to reach 5620. The logic of the multiplication and the decomposition of the 370 extra trials should be spelled out.
- [Table 1] The column header 'Chance Probability (Single Trial)' should be clarified, since the text distinguishes single-trial and all-trial significances; also the text gives all-trial significances only for the three detected bursts, so presenting both in the table would help the reader.
Circularity Check
No circularity: the amplitudes are direct observational measurements, and the selection-bias concern is a statistical validity issue, not a self-referential derivation.
full rationale
This is an observational paper, not a derivation from a model. The burst oscillation amplitudes are obtained by fitting a sinusoid to phase-folded NICER light curves in selected time intervals and energy bands, and the reported fractional rms values are measured from those fits. Nothing is presented as a prediction that is equivalent to an input by construction. The statistical concern raised by the skeptic, that the time and energy intervals were chosen to maximize the search power and therefore the reported amplitudes may be upward-biased, is a real measurement-validity issue but is not circularity under the definitions used here: the paper does not rename a fitted parameter as an independent prediction, and no equation reduces to an input. The paper is transparent about the procedure, noting that 'we attempted to maximize the power by varying the search parameters' and that 'there are only 153 counts in the 6.2-9.9 keV band in that 2 s interval.' The only author self-citation, Mahmoodifar & Strohmayer (2016), appears in the discussion as a model that is said to be unable to explain the large amplitudes, and the paper explicitly states that this model 'lacks a first-principle explanation of how such an asymmetry might arise.' That citation is context for interpreting the measured amplitudes, not a load-bearing step in producing them, and it is not invoked to forbid alternatives or to justify uniqueness. The Monte Carlo study in Section 2.1.2 validates detection significance rather than the amplitude estimator, but this is a limitation of the statistical analysis, not a circular argument. No step in the paper's derivation chain is observed to reduce, by the paper's own equations or by an unverified self-citation, to its own inputs. Accordingly, no significant circularity is found.
Assumptions & free parameters
assumptions (4)
- domain assumption Leahy-normalized power spectra and Poisson statistics describe noise in the NICER event data.
- domain assumption Burst oscillations in 4U 1728 appear only in the 360-365 Hz range.
- domain assumption The phase-folded profile is adequately described by A + B sin(2*pi*nu*t - phi0).
- standard math Equation (1), the distribution of measured power given true signal power in n summed bins, is the correct noise model.
Cite this review
Pith. "Pith review of NICER Observation of Unusual Burst Oscillations in 4U 1728-34." pith.science (2026). https://pith.science/paper/SWAZQ6BS
@misc{pith2026190801206,
  author       = {Pith},
  title        = {Pith review of: NICER Observation of Unusual Burst Oscillations in 4U 1728-34},
  year         = {2026},
  howpublished = {\url{https://pith.science/paper/SWAZQ6BS}},
  note         = {Machine review of arXiv:1908.01206}
}
abstract
The Neutron Star Interior Composition Explorer (NICER) has observed seven thermonuclear X-ray bursts from the Low Mass X-ray Binary (LMXB) neutron star 4U 1728-34 from the start of the mission's operations until February of 2019. Three of these bursts show oscillations in their decaying tail with frequencies that are within 1 Hz of the previously detected burst oscillations from this source. Two of these burst oscillations have unusual properties: They have large fractional rms amplitudes of $ 48 \pm 9 \%$ and $ 46 \pm 9 \%$, and they are detected only at photon energies above 6 keV. By contrast, the third detected burst oscillation is compatible with previous observations of this source, with a fractional rms amplitude of $7.7 \pm 1.5\%$ rms in the 0.3 to 6.2 keV energy band. We discuss the implications of these large-amplitude burst oscillations, finding they are difficult to explain with the current theoretical models for X-ray burst tail oscillations.
Figures


Figures from the paper (3 more)


Reference graph
Works this paper leans on
- [1]
-
[2]
Marshall, F. J. 1984, ApJ, 281, 337
work page 1984
- [3]
- [4]
- [5]
-
[6]
Chakrabarty, D., Morgan, E. H., Muno, M. P., et al. 2003, Nature, 424, 42
work page 2003
-
[7]
2000, ApJ, 544, 453
Cumming, A., & Bildsten, L. 2000, ApJ, 544, 453
2000
-
[8]
Franco, L. M. 2001, ApJ, 554, 340
work page 2001
Show all 30 references
- [9]
-
[10]
K., Morgan, E
Galloway, D. K., Morgan, E. H., Krauss, M. I., Kaaret, P., & Chakrabarty, D. 2007, ApJL, 654, L73
2007
-
[11]
K., Muno, M
Galloway, D. K., Muno, M. P., Hartman, J. M., Psaltis, D., & Chakrabarty, D. 2008, ApJS, 179, 360
2008
-
[12]
C., et al
Gendreau, K. C., et al. 2016, in Proc. SPIE, Vol. 9905, Space Telescopes and Instrumentation 2016: Ultraviolet to Gamma Ray, 99051H
2016
-
[13]
Groth, E. J. 1975, ApJS, 29, 285
1975
-
[14]
1989, A&A, 225, 79
Hasinger, G., & van der Klis, M. 1989, A&A, 225, 79
1989
-
[15]
Heyl, J. S. 2004, ApJ, 600, 939
2004
-
[16]
A., Darbro, W., Elsner, R
Leahy, D. A., Darbro, W., Elsner, R. F., et al. 1983, ApJ, 266, 160
1983
-
[17]
Lewin, W. H. G., Clark, G., & Doty, J. 1976, IAUC, 2922
1976
-
[18]
2016, ApJ, 818, 93
Mahmoodifar, S., & Strohmayer, T. 2016, ApJ, 818, 93
2016
-
[19]
P., Chakrabarty, D., Galloway, D
Muno, M. P., Chakrabarty, D., Galloway, D. K., & Psaltis, D. 2002, ApJ, 580, 1048 14 Mahmoodifar et al
2002
-
[20]
S., et al
Tsygankov, S. S., et al. 2018, MNRAS, 474, 5425
2018
-
[21]
Patruno, A., Altamirano, D., Hessels, J. W. T., et al. 2009, Astrophys. J., 690, 1856
2009
-
[22]
2002, ApJ, 566, 1018
Spitkovsky, A., Levin, Y., & Ushomirsky, G. 2002, ApJ, 566, 1018
2002
-
[23]
E., Zhang, W., Swank, J
Strohmayer, T. E., Zhang, W., Swank, J. H., et al. 1996, ApJL, 469, L9
1996
-
[24]
E., Zhang, W., Swank, J
Strohmayer, T. E., Zhang, W., Swank, J. H., White, N. E., & Lapidus, I. 1998, ApJL, 498, L135
1998
-
[25]
2002, ApJL, 576, L49 van Straaten, S., van der Klis, M.,
Titarchuk, L., Cui, W., & Wood, K. 2002, ApJL, 576, L49 van Straaten, S., van der Klis, M.,
2002
-
[26]
2001, ApJ, 551, 907
Kuulkers, E., & M´ endez, M. 2001, ApJ, 551, 907
2001
-
[27]
A., van der Klis, M., Wood, K
Vaughan, B. A., van der Klis, M., Wood, K. S., et al. 1994, ApJ, 435, 362
1994
-
[28]
Watts, A. L. 2012, ARA&A, 50, 609
2012
-
[29]
Markwardt, C. B. 2005, ApJ, 634, 547
2005
-
[30]
1998, Nature, 394, 344
Wijnands, R., & van der Klis, M. 1998, Nature, 394, 344
1998
Reviewed August 14, 2026 · model on record in the stance chip above.
Discussion (0). Continue with ORCID to comment.