REVIEW 3 major objections 5 minor 55 references
Cosmic-Ray Feedback from Supernovae in a Parker-Unstable Medium
T0 review · 3 major / 5 minor · reviewed 2026-08-11 · deepseek-v4-flash
Pith's one-line read Putting 10% of supernova energy into cosmic rays, instead of all into heat and motion, drives a faster, hotter, and more massive outflow from a galactic disk.
desk verdict Solid, honest simulation comparison, but the headline CR-vs-thermal outflow contrast rests on one run per setup, so the numbers are plausible, not proven. read the letter →
The pith
A machine-rendered reading of the paper's core claim, the machinery that carries it, and where it could break.
The reading
What carries the argument
The load-bearing setup is a galactic-patch magnetohydrodynamic simulation with a separate cosmic-ray fluid that diffuses and streams along the resolved magnetic field. The central physical object is the Parker instability, the magnetic buoyancy instability of a stratified, magnetized atmosphere, which converts the initial horizontal field into vertical loops, plumes, and cold valleys. The argument is carried by the cosmic-ray pressure gradient: after the instability reorients the field, cosmic rays stream outward at the Alfvén speed, and their pressure gradient becomes the dominant vertical force at $|z| \gtrsim 1$ kpc, accelerating gas out of the disk.
What would settle it
A repetition of the setup with vertical boundaries that admit galactic-halo inflow would settle the central claim: if the long-lived cosmic-ray-driven outflow disappears or reverses when gas falls back in, the headline result fails.
Extended reading notes
Core claim
The central claim is that depositing 10% of each supernova's energy into a cosmic-ray fluid, rather than into thermal and kinetic energy alone, changes the long-term behavior of the interstellar medium. In two otherwise identical simulations of a stratified galactic patch, the run with cosmic-ray injection develops a steady outflow that begins at $|z| \simeq 0.5$ kpc, is faster and hotter, and is still present at late times, while the run without injection shows a weaker, fluctuating flow. In the steady state the cosmic-ray pressure gradient dominates vertical acceleration at $|z| \gtrsim 1$ kpc. This happens because the Parker instability overturns the gas and makes the magnetic field predominantly vertical outside the midplane; cosmic rays stream along those field lines, heat the diffuse gas, and push it outward. The same geometry lets cosmic rays escape before they collide with gas, lowering the calorimetric fraction, provided the magnetic field is resolved well enough to avoid numerical reconnection.
Load-bearing premise
The vertical boundaries let gas leave the simulated patch but never fall back in, so any real inflow from the halo that would oppose or dilute the wind is excluded.
Editorial extensions
If this is right
- A cosmic-ray energy share as small as 10% cannot be dropped from models of the disk-halo interface; simulations that inject only thermal and kinetic energy will understate the speed and mass loss of outflows.
- Resolved vertical magnetic field connecting the midplane to the halo acts as an escape route for cosmic rays, so galaxy-scale simulations may overpredict gamma-ray luminosity unless they resolve the magnetic structure of diffuse gas.
- The Parker instability can produce a two-component vertical structure and cold clouds containing more than half the gas mass, with mass-loading factors above $10^3$ even at a low supernova rate.
- A cosmic-ray-driven outflow can persist for more than 100 million years and reach down to $|z| \simeq 0.5$ kpc, forming the base of a large-scale galactic wind.
- Where streaming dominates, cosmic-ray transport behaves like advection rather than diffusion, which steepens pressure gradients and changes the effective polytropic index of the cosmic-ray fluid.
Reading between the lines
- If vertical field lines are the main escape highways, then a galaxy's gamma-ray and wind properties may be controlled by magnetic topology rather than by the cosmic-ray diffusion coefficient; this could be tested by relating observed gamma-ray luminosity to radio-polarization maps of halo fields.
- The diode boundary condition likely makes the sustained outflow an upper limit; allowing halo gas to fall back in could weaken or shorten the cosmic-ray-driven phase.
- The resolution dependence suggests coarser galaxy simulations need a subgrid prescription for field-aligned cosmic-ray escape, not just an increased diffusion coefficient.
- Because the Parker instability puts cold clouds in low cosmic-ray-pressure valleys, star-forming gas may be shielded from cosmic-ray pressure; this predicts a spatial anti-correlation between dense gas and cosmic-ray pressure that synchrotron and gamma-ray observations could check.
Signed reviews
Editorial analysis
A structured set of objections, weighed in public.
Referee Report
Summary. The paper presents two Athena++ MHD+CR simulations of a stratified galactic patch (1 kpc × 1 kpc × 4.8 kpc, 5 pc resolution) that are identical except for the partitioning of supernova energy: in CRInj, 10% of each SN's energy is injected as cosmic-ray energy, while in CRBkg all injected energy is thermal and kinetic. The authors report that cosmic-ray injections produce a faster, hotter, and more massive outflow that persists for over 100 Myr after the initial transients, with cosmic-ray pressure gradients dominating the vertical acceleration at |z| ≳ 1 kpc during the steady state. They also analyze the Parker instability, cold-cloud formation, the decorrelation of cosmic-ray pressure from gas density, and the resulting reduction in the hadronic calorimetric fraction, which they compare to the starburst estimates of Lacki et al. (2011). The central claim is comparative: the two simulations differ only in the injection prescription, and the late-time outflow contrast is attributed to cosmic-ray pressure gradients.
Significance. If the result holds, it is an important contribution to the debate on cosmic-ray feedback in the multiphase ISM. The study's design is strong: identical initial conditions and injection rates, standard transport coefficients (diffusion coefficient from the B/C ratio, streaming at the Alfvén speed), a linear-theory check of the Parker instability growth rate, and an external observational benchmark for the calorimetric fraction. The 5 pc resolution and the inclusion of both diffusion and streaming are notable strengths. The main weaknesses are statistical power (one realization per setup), a likely typographical error in the printed cooling function, and an unacknowledged boundary-condition effect on the persistence of the outflow.
major comments (3)
- [§3.3, Figs. 10–13; §2.3] The headline comparative claim—that cosmic-ray injections drive a faster, hotter, and more massive outflow long after injection—rests on a single realization of each setup. The supernova injection schedule is Poisson-random (Section 2.3), and Figure 4 shows a quasi-periodic fountain cycle with a ~30 Myr period, so the t = 260–400 Myr steady state contains only about four to five independent cycles. Figures 10 and 13 show substantial time variation within this window, yet no estimate of realization-to-realization variance is provided. If the two runs use the same random seed, the comparison is still not a controlled pairing after the first supernova, because the local gas state into which each SN injects differs between the runs. The reported factor-of-three acceleration enhancement and the ≥95% cosmic-ray-gradient dominance could therefore be altered by a different seed. The authors should add either multiple realizations with different seeds or a quantitative bootstrap over independent time windows to demonstrate that the CR-vs-thermal contrast is not noise.
- [§2.2, Eq. (18)] As printed, the cooling function Λ(T) has prefactors 7.3×10^21 and 7.9×10^27 erg cm^3 s^-1. Substituting these into Equation (17) gives equilibrium densities many orders of magnitude below the range shown in Figure 2; for example, at T = 10^4 K the second term alone is ~10^28 erg cm^3 s^-1, which is physically impossible for the ISM. The standard Inoue et al. (2006) form uses negative exponents (10^-21 and 10^-27). This appears to be a sign typo, but it is load-bearing because the printed equation is inconsistent with the equilibrium curve in Figure 2 and would prevent reproduction of the simulations. The authors must correct the coefficients and confirm that the simulations used the correct form.
- [§2.1, §4.3, §5 conclusion item 4] The z-boundary 'diode' condition allows outflow but no inflow, so the simulation cannot represent gas falling back from the halo or cosmological accretion. Since one of the key conclusions is that the cosmic-ray-driven outflow survives for more than 100 Myr, the absence of any return flow may artificially enhance both the persistence and the mass of the wind. The paper should state this limitation explicitly and discuss how realistic inflows could alter the result; at minimum, the caveat belongs in Section 4.3 alongside the other acknowledged simplifications.
minor comments (5)
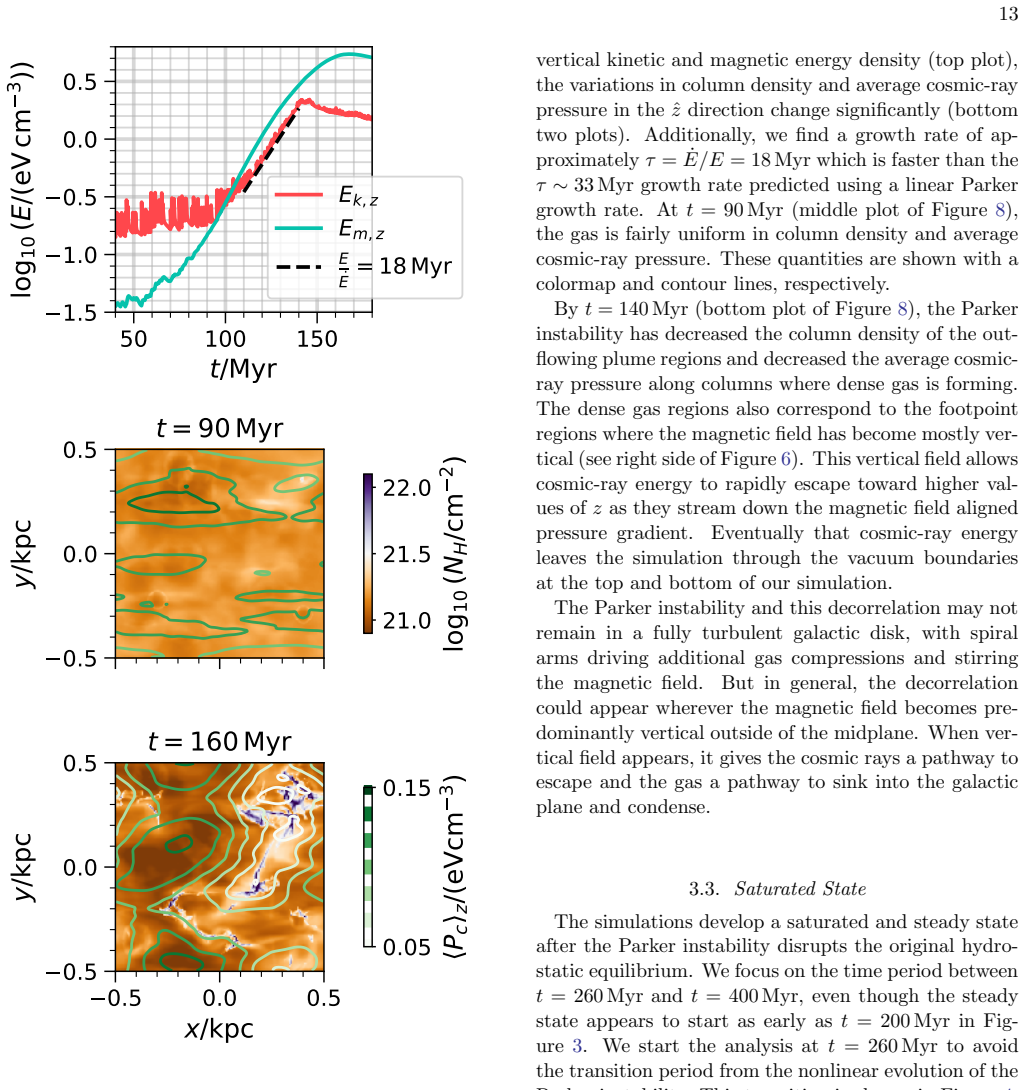
- [§3.2, Fig. 8] The measured exponential growth rate of vertical kinetic and magnetic energy (τ ≈ 18 Myr) is compared directly with the linear-theory Parker growth rate (τ ≈ 32 Myr), but the measured quantity includes ongoing supernova driving and nonlinear effects; the comparison should be phrased more cautiously or the fitting interval and decomposition should be justified.
- [§3.3, Figs. 11–13] The acceleration decomposition omits magnetic tension, with the text noting that the xy-plane averaged tension is predominantly zero. It would be helpful to state the magnitude of the tension variation (about ±0.2 km s^-1 Myr^-1) in the figure captions or in the main text where the decomposition is introduced.
- [Table 1 and Fig. 3] The units in Table 1 are inconsistent: Pc is listed in eV cm^-3, while Figure 3 plots pressures in units of 10^4 K cm^-3. Please unify the pressure units across the paper.
- [§4.1, Fig. 19] The resolution comparison for the calorimetric fraction compares only 5 pc and 10 pc runs; the text concludes that resolution is 'the reason' earlier work overpredicted γ-ray luminosity, but a two-point comparison cannot establish convergence. A more cautious statement, or an additional intermediate resolution, would be appropriate.
- [Various] There are several typographical errors: 'exgtended' in the Figure 1 caption, 'T able 1' in the Table 1 caption, 'simuation' in the Figure 13 caption, and 'Fcall' in Section 3.4. These should be corrected.
Circularity Check
No circularity: the CRInj/CRBkg comparison is a controlled numerical experiment, transport coefficients and benchmarks are external, and the self-citations are non-load-bearing.
full rationale
The paper's derivation chain is a controlled numerical experiment: two otherwise identical MHD+CR simulations differ only in whether 10% of each supernova's energy is injected as cosmic-ray energy (CRInj) or all as thermal energy (CRBkg). The headline result—faster, hotter, and more massive outflow with cosmic-ray pressure gradients dominating at |z| ≥ 1 kpc—is measured from simulation outputs (Figures 10-13), not recovered from a fitted parameter or from a definition. The transport coefficients (κ∥ = 3×10^28 cm^2/s, negligible κ⊥, Alfvén-speed streaming) are taken from external literature (Jones et al. 2001; Jiang & Oh 2018) and are not tuned to force the target result. The Parker-instability check uses the analytic criterion and dispersion relations of Heintz & Zweibel (2018); although Zweibel is a co-author, this is an independently published linear-theory result, and the paper explicitly compares its measured growth rate (18-25 Myr) against the predicted value (~33 Myr) rather than imposing it. The F_cal comparison uses the external observational benchmark of Lacki et al. (2011), with the net calorimetric fraction obtained by background subtraction, not by fitting. Self-citations (Habegger et al. 2023 for setup provenance and V_m convergence; Habegger et al. 2024 for diffusion-coefficient discussion) are supporting references and are not load-bearing for the central comparison. The paper's own caveats (diode boundary, constant heating rate, incomplete star-formation feedback loop, numerical reconnection) concern external validity and robustness, not circularity; no equation in the paper reduces by construction to its own inputs, and no fitted parameter is renamed as a prediction.
Assumptions & free parameters
free parameters (4)
- f_CR =
0.1
- T_floor =
30 K
- supernova_rate =
1 Myr^-1
- V_m =
0.1c
assumptions (6)
- domain assumption Cosmic-ray transport is modeled with anisotropic diffusion along the local magnetic field at kappa_parallel = 3e28 cm^2/s plus streaming at the Alfven speed (Eqs. 5 through 11).
- domain assumption The initial atmosphere is linearly unstable to the Parker instability, using the criterion of Newcomb 1961 and Heintz and Zweibel 2018 (Eq. 21).
- domain assumption The z boundaries are one-way 'diode' boundaries that allow outflow but no inflow (Section 2.1).
- domain assumption Gravity is from an infinite isothermal stellar sheet with Sigma_star = 50 Msun/pc^2 and H_star = 100 pc (Eq. 12), neglecting dark matter and finite disk effects.
- domain assumption Supernovae are injected at random midplane positions at a constant rate, not tied to gas density or star formation, and the molecular weight is constant mu = 1 (Sections 2.2 and 2.3).
- domain assumption Streaming uses the full gas density instead of ion density in the Alfven speed (Eq. 9).
Cite this review
Pith. "Pith review of Cosmic-Ray Feedback from Supernovae in a Parker-Unstable Medium." pith.science (2026). https://pith.science/paper/T3KVXI5Y
@misc{pith2026241212249,
  author       = {Pith},
  title        = {Pith review of: Cosmic-Ray Feedback from Supernovae in a Parker-Unstable Medium},
  year         = {2026},
  howpublished = {\url{https://pith.science/paper/T3KVXI5Y}},
  note         = {Machine review of arXiv:2412.12249}
}
abstract
Supernova energy drives interstellar medium (ISM) turbulence and can help launch galactic winds. What difference does it make if $10\%$ of the energy is initially deposited into cosmic rays? To answer this question and study cosmic-ray feedback, we perform galactic patch simulations of a stratified ISM. We compare two magnetohydrodynamic and cosmic ray (MHD+CR) simulations, which are identical except for how each supernova's energy is injected. In one, $10\%$ of the energy is injected as cosmic-ray energy. In the other case, energy injection is strictly thermal and kinetic. We find that cosmic-ray injections drive a faster, hotter, and more massive outflow long after the injections occur. Both simulations show the formation of cold clouds (with a total mass fraction $>50\%$) through the Parker instability and thermal instability. The Parker instability simultaneously produces high mass loading factors $\eta > 10^3$ as it requires few supernovae. We also show how the Parker instability naturally leads to a decorrelation of cosmic-ray pressure and gas density. This decorrelation leads to a significant decrease in the calorimetric fraction for injected cosmic rays, but it depends on having a highly resolved magnetic field.
Figures


Figures from the paper (16 more)




Reference graph
Works this paper leans on
-
[1]
Armillotta, L., Ostriker, E. C., & Jiang, Y.-F. 2021, ApJ, 922, 11, doi: 10.3847/1538-4357/ac1db2
-
[2]
Armillotta, L., Ostriker, E. C., Kim, C.-G., & Jiang, Y.-F. 2024, ApJ, 964, 99, doi: 10.3847/1538-4357/ad1e5c Astropy Collaboration, Robitaille, T. P., Tollerud, E. J., et al. 2013, A&A, 558, A33, doi: 10.1051/0004-6361/201322068 Astropy Collaboration, Price-Whelan, A. M., Sip˝ ocz, B. M., et al. 2018, AJ, 156, 123, doi: 10.3847/1538-3881/aabc4f
-
[3]
1934, Physical Review, 46, 76, doi: 10.1103/PhysRev.46.76.2
Baade, W., & Zwicky, F. 1934, Physical Review, 46, 76, doi: 10.1103/PhysRev.46.76.2
-
[4]
Blandford, R. D., & Ostriker, J. P. 1978, ApJL, 221, L29, doi: 10.1086/182658
doi:10.1086/182658 1978
- [5]
-
[6]
Bustard, C., & Zweibel, E. G. 2021, ApJ, 913, 106, doi: 10.3847/1538-4357/abf64c
-
[7]
2014, ApJ, 783, 91, doi: 10.1088/0004-637X/783/2/91
Caprioli, D., & Spitkovsky, A. 2014, ApJ, 783, 91, doi: 10.1088/0004-637X/783/2/91
-
[8]
Chan, T. K., Kereˇ s, D., Gurvich, A. B., et al. 2022, MNRAS, 517, 597, doi: 10.1093/mnras/stac2236
Show all 55 references
-
[9]
K., Kereˇ s, D., Hopkins, P
Chan, T. K., Kereˇ s, D., Hopkins, P. F., et al. 2019, MNRAS, 488, 3716, doi: 10.1093/mnras/stz1895
2019 doi
-
[10]
Desiati, P., & Zweibel, E. G. 2014, ApJ, 791, 51, doi: 10.1088/0004-637X/791/1/51
2014 doi
-
[11]
2018, PhRvL, 121, 091101, doi: 10.1103/PhysRevLett.121.091101 26
Diesing, R., & Caprioli, D. 2018, PhRvL, 121, 091101, doi: 10.1103/PhysRevLett.121.091101 26
2018 doi
-
[12]
Draine, B. T. 2011, Physics of the Interstellar and Intergalactic Medium
2011
-
[13]
2022, ApJ, 941, 162, doi: 10.3847/1538-4357/aca27d
Elia, D., Molinari, S., Schisano, E., et al. 2022, ApJ, 941, 162, doi: 10.3847/1538-4357/aca27d
2022 doi
-
[14]
2019, PhRvD, 99, 103023, doi: 10.1103/PhysRevD.99.103023
Evoli, C., Aloisio, R., & Blasi, P. 2019, PhRvD, 99, 103023, doi: 10.1103/PhysRevD.99.103023
2019 doi
-
[15]
2020, PhRvD, 101, 023013, doi: 10.1103/PhysRevD.101.023013
Evoli, C., Morlino, G., Blasi, P., & Aloisio, R. 2020, PhRvD, 101, 023013, doi: 10.1103/PhysRevD.101.023013
2020 doi
-
[16]
Farber, R., Ruszkowski, M., Yang, H. Y. K., & Zweibel, E. G. 2018, ApJ, 856, 112, doi: 10.3847/1538-4357/aab26d Ferri` ere, K. M. 2001, Reviews of Modern Physics, 73, 1031, doi: 10.1103/RevModPhys.73.1031
2018 doi
- [17]
-
[18]
Guo, F., & Oh, S. P. 2008, MNRAS, 384, 251, doi: 10.1111/j.1365-2966.2007.12692.x
2008
-
[19]
W., Yuen, K
Habegger, R., Ho, K. W., Yuen, K. H., & Zweibel, E. G. 2024, ApJ, 974, 17, doi: 10.3847/1538-4357/ad67da
2024 doi
-
[20]
G., & Wong, S
Habegger, R., Zweibel, E. G., & Wong, S. 2023, ApJ, 951, 99, doi: 10.3847/1538-4357/accf8e
2023 doi
-
[21]
R., Millman, K
Harris, C. R., Millman, K. J., van der Walt, S. J., et al. 2020, Nature, 585, 357, doi: 10.1038/s41586-020-2649-2
2020 doi
-
[22]
Heintz, E., Bustard, C., & Zweibel, E. G. 2020, ApJ, 891, 157, doi: 10.3847/1538-4357/ab7453
2020 doi
-
[23]
Heintz, E., & Zweibel, E. G. 2018, ApJ, 860, 97, doi: 10.3847/1538-4357/aac208
2018 doi
- [24]
- [25]
-
[26]
Hunter, J. D. 2007, Computing in Science and Engineering, 9, 90, doi: 10.1109/MCSE.2007.55
2007 doi
-
[27]
2006, ApJ, 652, 1331, doi: 10.1086/508334
Inoue, T., Inutsuka, S.-i., & Koyama, H. 2006, ApJ, 652, 1331, doi: 10.1086/508334
2006 doi
-
[28]
Jiang, Y.-F., & Oh, S. P. 2018, ApJ, 854, 5, doi: 10.3847/1538-4357/aaa6ce
2018 doi
-
[29]
C., Lukasiak, A., Ptuskin, V., & Webber, W
Jones, F. C., Lukasiak, A., Ptuskin, V., & Webber, W. 2001, ApJ, 547, 264, doi: 10.1086/318358
2001 doi
-
[30]
Kim, C.-G., Kim, J.-G., Gong, M., & Ostriker, E. C. 2023, ApJ, 946, 3, doi: 10.3847/1538-4357/acbd3a
2023 doi
-
[31]
Kim, C.-G., & Ostriker, E. C. 2015, ApJ, 802, 99, doi: 10.1088/0004-637X/802/2/99
2015 doi
-
[32]
2011, ApJ, 734, 107, doi: 10.1088/0004-637X/734/2/107
Waxman, E. 2011, ApJ, 734, 107, doi: 10.1088/0004-637X/734/2/107
2011 doi
- [33]
-
[34]
M., Stanimirovi´ c, S., & Rybarczyk, D
McClure-Griffiths, N. M., Stanimirovi´ c, S., & Rybarczyk, D. R. 2023, ARA&A, 61, 19, doi: 10.1146/annurev-astro-052920-104851
2023 doi
-
[35]
F., & Voelk, H
McKenzie, J. F., & Voelk, H. J. 1982, A&A, 116, 191
1982
-
[36]
Newcomb, W. A. 1961, Physics of Fluids, 4, 391, doi: 10.1063/1.1706342 O’Neill, T. J., Zucker, C., Goodman, A. A., & Edenhofer, G. 2024, ApJ, 973, 136, doi: 10.3847/1538-4357/ad61de
1961 doi
-
[37]
Mitchell, A. M. W. 2023, Galaxies, 11, 86, doi: 10.3390/galaxies11040086
2023 doi
-
[38]
Parker, E. N. 1966, ApJ, 145, 811, doi: 10.1086/148828
1966 doi
-
[39]
2021, MNRAS, 504, 1039, doi: 10.1093/mnras/stab900
Rathjen, T.-E., Naab, T., Girichidis, P., et al. 2021, MNRAS, 504, 1039, doi: 10.1093/mnras/stab900
2021 doi
-
[40]
Rosen, A., & Bregman, J. N. 1995, ApJ, 440, 634, doi: 10.1086/175303
1995 doi
-
[41]
2023, A&A Rv, 31, 4, doi: 10.1007/s00159-023-00149-2
Ruszkowski, M., & Pfrommer, C. 2023, A&A Rv, 31, 4, doi: 10.1007/s00159-023-00149-2
2023 doi
-
[42]
R., Wenger, T
Rybarczyk, D. R., Wenger, T. V., & Stanimirovi´ c, S. 2024, ApJ, 975, 167, doi: 10.3847/1538-4357/ad79f7
2024 doi
-
[43]
1959, ApJ, 129, 243, doi: 10.1086/146614
Schmidt, M. 1959, ApJ, 129, 243, doi: 10.1086/146614
1959 doi
-
[44]
A., Kravtsov, A
Semenov, V. A., Kravtsov, A. V., & Caprioli, D. 2021, ApJ, 910, 126, doi: 10.3847/1538-4357/abe2a6
2021 doi
-
[45]
2022, ApJ, 926, 8, doi: 10.3847/1538-4357/ac4110
Shimoda, J., & Inutsuka, S.-i. 2022, ApJ, 926, 8, doi: 10.3847/1538-4357/ac4110
2022 doi
-
[46]
M., Tomida, K., White, C
Stone, J. M., Tomida, K., White, C. J., & Felker, K. G. 2020, The Astrophysical Journal Supplement Series, 249, 4, doi: 10.3847/1538-4365/ab929b
2020 doi
-
[47]
A., et al
Tharakkal, D., Shukurov, A., Gent, F. A., et al. 2023, MNRAS, 525, 5597, doi: 10.1093/mnras/stad2610
2023 doi
- [48]
-
[49]
Townsend, R. H. D. 2009, ApJS, 181, 391, doi: 10.1088/0067-0049/181/2/391
2009 doi
-
[50]
Tsung, T. H. N., Oh, S. P., & Bustard, C. 2023, MNRAS, 526, 3301, doi: 10.1093/mnras/stad2720
2023 doi
-
[51]
Tsung, T. H. N., Oh, S. P., & Jiang, Y.-F. 2022, MNRAS, 513, 4464, doi: 10.1093/mnras/stac1123 van der Walt, S., Colbert, S. C., & Varoquaux, G. 2011, Computing in Science and Engineering, 13, 22, doi: 10.1109/MCSE.2011.37
2022 doi
-
[52]
2015, MNRAS, 454, 238, doi: 10.1093/mnras/stv1975
Walch, S., Girichidis, P., Naab, T., et al. 2015, MNRAS, 454, 238, doi: 10.1093/mnras/stv1975
2015 doi
-
[53]
P., & Zweibel, E
Wiener, J., Oh, S. P., & Zweibel, E. G. 2017, MNRAS, 467, 646, doi: 10.1093/mnras/stx109 27
2017 doi
-
[54]
G., & Ruszkowski, M
Wiener, J., Zweibel, E. G., & Ruszkowski, M. 2019, MNRAS, 489, 205, doi: 10.1093/mnras/stz2007 Wolfram Research Inc. 2023, Mathematica, Version 13.3
2019 doi
-
[55]
Zweibel, E. G. 2017, Physics of Plasmas, 24, 055402, doi: 10.1063/1.4984017
2017 doi
Reviewed August 11, 2026 · model on record in the stance chip above.
Discussion (0). Continue with ORCID to comment.