REVIEW 4 major objections 4 minor 112 references
Differences in baryonic and dark matter scaling relations of galaxy clusters: A comparison between IllustrisTNG simulations and observations
T0 review · 4 major / 4 minor · reviewed 2026-08-16 · deepseek-v4-flash
Pith's one-line read The baryon fraction scaling slopes of simulated clusters match the observed SPT-SZ/Chandra slopes within 1-2 sigma, and the missing baryons are predominantly warm gas and intracluster light.
desk verdict The headline 1–2σ slope agreement is a mass-range artifact — over the mass range C18 actually observed, the paper's own BPL fits give a slope near 0.06 versus C18's 0.35 — but the baryonic component budget is a genuinely useful new result. read the letter →
The pith
A machine-rendered reading of the paper's core claim, the machinery that carries it, and where it could break.
The reading
What carries the argument
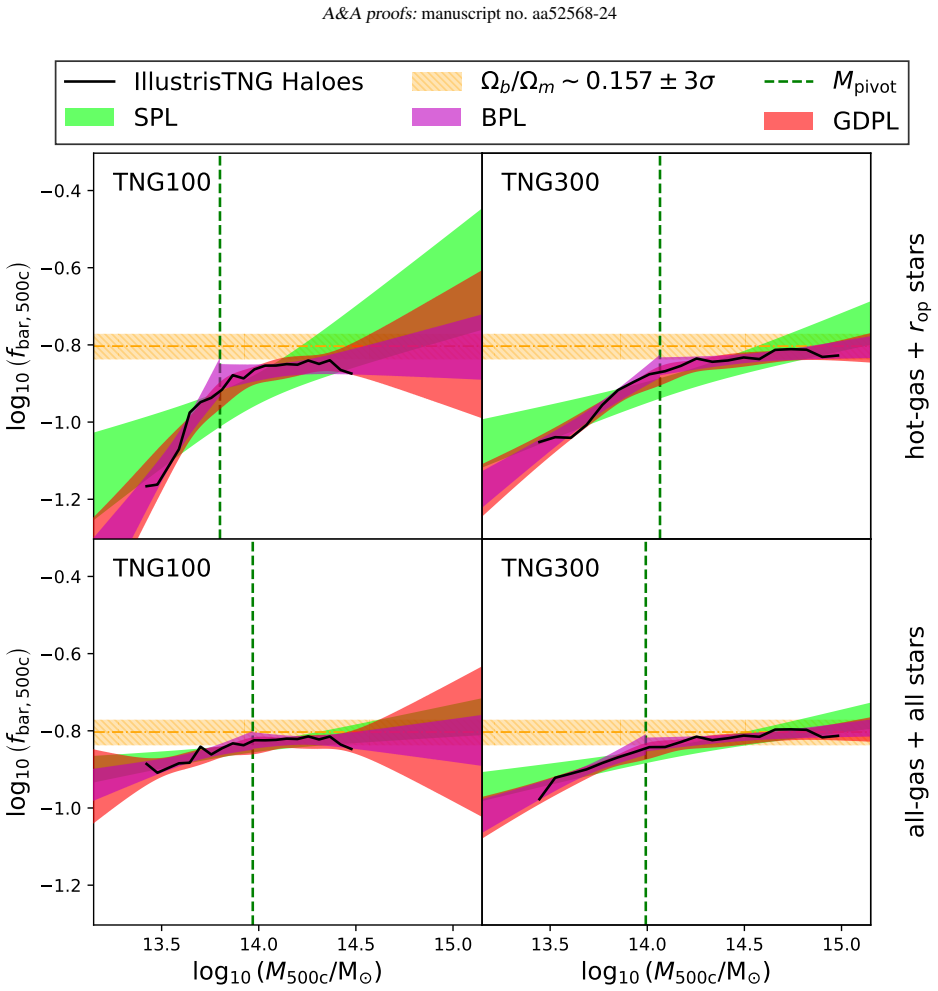
The load-bearing object is the baryon mass fraction $f_{\rm bar,500c}=M_{\rm bar,500c}/M_{500c}$ measured in two ways: an observational proxy (hot gas with $T\ge10^7$ K within $R_{500c}$ plus galaxy stellar mass within $2\times R_{M_\star/2}$, excluding warm gas, cold gas, and intracluster light) and a full baryon budget (all gas and all stars within $R_{500c}$). The argument runs through fits of the self-similar scaling relation $f_{\rm bar}\propto M^{\alpha}$ using a simple power law, a broken power law, and a general double power law with a smoothness parameter $\delta$; the breakpoint $M_{\rm pivot}$ identifies the mass where self-similarity is lost. The mechanism that explains the break is AGN feedback pushing baryons into the cluster outskirts, and the friends-of-friends mass definition is used to test whether the universal baryon fraction is recovered when all gravitationally bound material is counted.
What would settle it
Measure the warm gas ($10^5\lesssim T\lesssim10^7$ K) mass in low-mass clusters ($\log_{10}(M_{500c}/M_\odot)\lesssim14$) using O VII absorption stacking or thermal Sunyaev-Zel'dovich observations and compare with the roughly 10 per cent baryonic fraction predicted here; a detection below about 5 per cent would rule out warm gas as the dominant missing component and contradict the paper's missing-baryon budget.
Extended reading notes
Core claim
The central discovery is that the observed baryon fraction scaling is reproduced by IllustrisTNG once the same measurement cuts are applied: hot gas with $T\geq 10^7$ K inside $R_{500c}$ plus galaxy stellar mass within an aperture of $2\times R_{M_\star/2}$. With this proxy, TNG100 and TNG300 give SPL slopes $\alpha_{\rm SPL}=0.248\pm0.018$ and $0.261\pm0.006$, respectively, consistent at 1-2 $\sigma$ with the slope $\alpha_{\rm Chiu}=0.350\pm0.076$ reported by Chiu et al. (2018) for the SPT-SZ sample. The baryon fraction is consistent with zero redshift evolution (slopes $\sim0.00$-$0.07$), and the missing baryons, defined as cold gas, warm gas, and intracluster light excluded by the observational proxy, amount to approximately 13.8-14.1 per cent of the baryon budget, with warm gas dominating in low-mass haloes (~10.5 per cent) and ICL contributing roughly 5 per cent at all masses. Fitting a broken or general double power law places the self-similarity break at $\log_{10}(M_{\rm pivot}/M_\odot)\sim13.80$-$14.07$, the mass below which AGN feedback redistributes baryons to the outskirts; when halo mass is instead defined by the friends-of-friends algorithm, the slope flattens toward zero, consistent with hierarchical assembly.
Load-bearing premise
The simulated proxy for the observed baryon fraction (hot gas above $10^7$ K within $R_{500c}$ plus galaxy stars in a $2R_{M_\star/2}$ aperture) is taken to be directly comparable to the Chandra/SED measurement, so any systematic mismatch in how stars are assigned to galaxies or gas to the hot phase would shift the fitted slopes and the inferred missing budget.
Editorial extensions
If this is right
- If the slope agreement holds, the IllustrisTNG feedback model can be used to predict the baryon budget of clusters and the exact components an observational survey is missing.
- The missing-baryon deficit in observed low-mass clusters should be recoverable as warm gas ($10^5$-$10^7$ K) and diffuse intracluster light rather than cold gas.
- The breakpoint at $M_{500c}\sim10^{14}M_\odot$ marks a physically distinct regime: above it clusters are self-similar, below it AGN feedback redistributes baryons beyond $R_{500c}$.
- With friends-of-friends masses the baryon fraction slope approaches zero, so high-mass clusters can form from low-mass ones and the apparent contradiction with hierarchical growth is resolved.
- The SZ and X-ray mass biases estimated from mock observations imply real observed baryon fractions could be lower by 14-20 per cent than currently estimated, strengthening the need for the missing warm component.
Reading between the lines
- An extension would be to stack thermal Sunyaev-Zel'dovich or soft X-ray data on low-mass clusters to measure the warm gas component; if the warm gas mass is below roughly 5 per cent of baryons in that mass range, the identification of warm gas as the dominant missing reservoir would be falsified.
- The ICL fraction of about 5 per cent could be tested with deep surface-photometry surveys that separate intracluster light from galaxy light; the paper's proxy choice alone shifts the inferred missing fraction by about 5 per cent, so the definition of a galaxy in future surveys may matter as much as the sensitivity.
- If baryons are truly redistributed to 1.5-2.5 $R_{200c}$ in low-mass haloes, then cluster outskirts become the natural place to search for missing baryons, and cluster mass calibration via SZ or X-ray may require a radius-dependent correction.
- The authors' result that about 21 per cent of baryons are missing even when all bound material is counted suggests the issue is not just where the baryons are, but how efficiently haloes accrete gas versus dark matter; comparing with particle-based gas simulations could settle whether the deficit is physical or numerical.
Signed reviews
Editorial analysis
A structured set of objections, weighed in public.
Referee Report
Summary. The paper compares baryonic-mass-fraction scaling relations of galaxy clusters in the IllustrisTNG simulations (TNG100 and TNG300) with the SPT-SZ/Chandra sample of Chiu et al. (2018, C18). It fits simple power law (SPL), broken power law (BPL), and general double power law (GDPL) models to fbar,500c versus M500c and versus redshift, using two measurement proxies: hot gas (T≥10^7 K) plus galaxy stellar mass within a 2× half-mass-radius aperture, and all gas plus all stars within R500c. The paper reports approximately null redshift slopes, a 1–2σ agreement of SPL slopes with C18, a breakpoint at log10(M500c/Msun)≈14 where self-similarity is lost, and a 'missing' baryon fraction of about 13.8–14.1% dominated by warm gas and intracluster light. It also examines FoF-based scaling relations and the role of mass accretion in the baryon deficit.
Significance. If the claimed slope agreement were robust, it would strengthen confidence in IllustrisTNG's feedback model as a tool for interpreting cluster baryon fractions and the missing-baryon problem. The paper provides a useful component-by-component decomposition of baryons in simulated clusters and a clear measurement of the BPL/GDPL breakpoint, which are of interest to the cluster scaling-relation community. However, the central comparison to C18 is compromised by a mass-range mismatch: the simulation SPL is fitted over a much wider range that includes many low-mass haloes, while C18's slope is measured in a narrow high-mass range. The paper itself reports high-mass BPL slopes of 0.05–0.06, which differ from C18's 0.35 by several sigma. In addition, the paper identifies but does not propagate a 14–20% mass-bias systematic. These issues must be resolved before the main claim can be accepted.
major comments (4)
- [Sec. 4.1, Fig. 3, and Table 5]
- [Sec. 5.1]
- [Abstract and Sec. 4.2, Table 3]
- [Sec. 4.1, Fig. 2, and Abstract]
minor comments (4)
- [Abstract, Sec. 2.1, and Sec. 6]
- [Sec. 6, summary bullet]
- [Sec. 4.1 and Fig. 2]
- [Sec. 4.4 and Table 5]
Circularity Check
The 'missing baryons are mostly warm gas and ICL' conclusion is a bookkeeping identity: the paper sums exactly the components it excludes from the C18-like baryon fraction and then reports that sum as the missing baryons.
-
self definitional
[Section 4.2 and Table 3 (also Abstract)]
"Furthermore, Table 3 shows the average baryonic mass values for components not considered in the C18 observations: cold gas, warm gas, and ICL (rop). We defined the sum of those components as the missing baryons in simulations."
The headline finding—'We identify ∼13.8−14.1 per cent of baryons as missing, primarily in the form of ICL across all halo masses and warm gas in low-mass haloes'—is obtained by adding exactly the components that the paper's observational proxy (hot gas with T ≥ 10^7 K plus rop-aperture galaxy stars) excludes. The 'missing baryon' budget is therefore not inferred from an independent closure relation or from the C18 comparison; it is the complement of the chosen measurement definition restated as a discovery. The only simulation output entering the number is the relative mass of those excluded components, not an independent determination that they are the missing baryons.
full rationale
The central slope comparison is not circular: the TNG slopes (αSPL = 0.248 ± 0.018 for TNG100, 0.261 ± 0.006 for TNG300) are genuine fits to simulation data, and C18's αChiu = 0.350 ± 0.076 is an external observational benchmark. The self-similarity redshift test is likewise an internally consistent fit, not a circular reduction. The paper's P22 and A23 citations are not authored by the present authors, and the BPL/GDPL breakpoint is fitted rather than imported, so no self-citation chain forces the main result. However, the 'missing baryons' claim is self-definitional: the paper explicitly defines missing baryons as the sum of cold gas, warm gas, and ICL(rop), the same components omitted from the C18-like measurement, and then presents that sum as the answer to the missing-baryon problem. That step reduces by construction. The separate concern raised by the paper's own Table 5 that its BPL/GDPL high-mass slopes are ~0.05–0.06 above pivots below the C18 mass range is a mass-range comparison artifact and a correctness risk, not an additional circularity. Similarly, Section 5.1's unpropagated 14–20% mass-bias systematic affects the robustness of the slope comparison but does not make it circular.
Assumptions & free parameters
free parameters (6)
- SPL mass slope (hot gas + rop stars) =
TNG100 0.248, TNG300 0.261
- SPL mass slope (all gas + all stars) =
TNG100 0.071, TNG300 0.120
- SPL redshift slope =
0.006 to 0.071 across cases
- BPL slopes alpha_1 and alpha_2 =
TNG100 0.79 and 0.06; TNG300 0.35 and 0.05 (hot-gas+rop case)
- GDPL slopes alpha_1, alpha_2 and delta =
alpha identical to BPL; delta 0.25
- Mpivot breakpoint =
log10(Mpivot/Msun) = 13.80 to 14.07
assumptions (5)
- domain assumption Hot gas in clusters is in hydrostatic equilibrium (Eqs. 1-2).
- domain assumption The self-similar model (Kaiser 1986) predicts fbar proportional to M^0 with no redshift dependence (Eq. 6).
- domain assumption IllustrisTNG's subgrid feedback model (stellar and AGN) is a faithful representation of baryon redistribution in real clusters.
- domain assumption The simulated 'hot gas + rop stars' measurement is a valid proxy for the C18 observational measurement (Chandra beta-model gas and SED stellar masses).
- domain assumption Gas temperature thresholds (cold T < 1e5 K, warm 1e5 to 1e7 K, hot >= 1e7 K) cleanly separate observable and unobservable gas phases.
Cite this review
Pith. "Pith review of Differences in baryonic and dark matter scaling relations of galaxy clusters: A comparison between IllustrisTNG simulations and observations." pith.science (2026). https://pith.science/paper/T46QXGAH
@misc{pith2026250420159,
  author       = {Pith},
  title        = {Pith review of: Differences in baryonic and dark matter scaling relations of galaxy clusters: A comparison between IllustrisTNG simulations and observations},
  year         = {2026},
  howpublished = {\url{https://pith.science/paper/T46QXGAH}},
  note         = {Machine review of arXiv:2504.20159}
}
abstract
We compare the self-similar baryonic mass fraction scaling relations between galaxy clusters from the South Pole Telescope Sunyaev-Zel'dovich (SPT-SZ) survey and the IllustrisTNG state-of-the-art magnetohydrodynamical cosmological simulations. Using samples of 218 (TNG100) and 1605 (TNG300) friends-of-friends (FoF) haloes within $0.0 \leq z \leq 1.5$ and $M_{200c} \geq 7 \times 10^{13} M_{\odot}$, we fit the scaling relations using Simple Power Law (SPL), Broken Power Law (BPL), and General Double Power Law (GDPL) models through non-linear least squares regression. The SPL model reveals null slopes for the baryonic fraction as a function of redshift, consistent with self-similarity. Observations and simulations agree within $1{-}2\sigma$, suggesting comparable baryonic scaling slopes. We identify $\sim$13.8$-$14.1 per cent of baryons as "missing", primarily in the form of intracluster light (ICL) across all halo masses and warm gas in low-mass haloes. High-mass haloes ($\log_{10}(M_{500c}/M_{\odot}) \geq 14$) adhere to self-similarity, while low-mass haloes exhibit deviations, with the breakpoint occurring at $\log_{10}(M_{500c}/M_{\odot}) \sim 14$, where baryons are redistributed to the outskirts. Our findings suggest that the undetected warm-hot intergalactic medium (WHIM) and baryon redistribution by feedback mechanisms are complementary solutions to the "missing baryon" problem.
Figures


Figures from the paper (2 more)

Reference graph
Works this paper leans on
-
[1]
N., Adshead, P., Ahmed, Z., et al
Abazajian, K. N., Adshead, P., Ahmed, Z., et al. 2016, arXiv e-prints, [arXiv:1610.02743]
arXiv 2016
-
[2]
& Evrard, A
Arnaud, M. & Evrard, A. E. 1999, MNRAS, 305, 631
1999
-
[3]
Arnaud, M., Pointecouteau, E., & Pratt, G. W. 2007, A&A, 474, L37
2007
-
[4]
2023, MNRAS, 524, 5391
Ayromlou, M., Nelson, D., & Pillepich, A. 2023, MNRAS, 524, 5391
2023
-
[5]
2024, A&A, 690, A20
Ayromlou, M., Nelson, D., Pillepich, A., et al. 2024, A&A, 690, A20
2024
-
[6]
M., et al
Ayromlou, M., Nelson, D., Yates, R. M., et al. 2021, MNRAS, 502, 1051
2021
-
[7]
J., V ogelsberger, M., Pearce, F
Barnes, D. J., V ogelsberger, M., Pearce, F. A., et al. 2021, MNRAS, 506, 2533
2021
-
[8]
Barrera, M., Springel, V ., White, S. D. M., et al. 2023, MNRAS, 525, 6312
2023
Show all 112 references
-
[9]
N., Ade, P
Bender, A. N., Ade, P. A. R., Ahmed, Z., et al. 2018, in Proc. SPIE, ed. J. Zmuidz- inas & J.-R. Gao, V ol. 10708, 1070803
2018
-
[10]
A., Ade, P
Benson, B. A., Ade, P. A. R., Ahmed, Z., et al. 2014, in Proc. SPIE, ed. W. S. Holland & J. Zmuidzinas, V ol. 9153, 91531P
2014
-
[11]
E., Stalder, B., de Haan, T., et al
Bleem, L. E., Stalder, B., de Haan, T., et al. 2015, ApJS, 216, 27
2015
-
[12]
J., et al
Bocquet, S., Saro, A., Mohr, J. J., et al. 2015, ApJ, 799, 214
2015
-
[13]
2023, MNRAS, 524, 2579
Bose, S., Hadzhiyska, B., Barrera, M., et al. 2023, MNRAS, 524, 2579
2023
-
[14]
Bryan, G. L. & Norman, M. L. 1998, ApJ, 495, 80
1998
-
[15]
2022, A&A, 661, A10
Bulbul, E., Liu, A., Pasini, T., et al. 2022, A&A, 661, A10
2022
-
[16]
E., Holder, G
Carlstrom, J. E., Holder, G. P., & Reese, E. D. 2002, ARA&A, 40, 643
2002
-
[17]
& Ostriker, J
Cen, R. & Ostriker, J. P. 1999, ApJ, 514, 1
1999
-
[18]
J., McDonald, M., et al
Chiu, I., Mohr, J. J., McDonald, M., et al. 2018, MNRAS, 478, 3072 Collaboration:, D. E. S., Abbott, T., Abdalla, F. B., et al. 2016, MNRAS, 460, 1270
2018
-
[19]
E., Springel, V ., et al
Contreras, S., Angulo, R. E., Springel, V ., et al. 2023, MNRAS, 524, 2489 Dark Energy Survey Collaboration, Abbott, T., Abdalla, F. B., et al. 2016, MN- RAS, 460, 1270
2023
-
[20]
& Djorgovski, S
Davis, M. & Djorgovski, S. 1985, ApJ, 299, 15
1985
-
[21]
S., & White, S
Davis, M., Efstathiou, G., Frenk, C. S., & White, S. D. M. 1985, ApJ, 292, 371
1985
-
[22]
& Peebles, P
Davis, M. & Peebles, P. J. E. 1983, ApJ, 267, 465 de Graaff, A., Cai, Y .-C., Heymans, C., & Peacock, J. A. 2019, A&A, 624, A48 de Haan, T., Benson, B. A., Bleem, L. E., et al. 2016, ApJ, 832, 95
1983
-
[23]
M., Hadzhiyska, B., Bose, S., et al
Delgado, A. M., Hadzhiyska, B., Bose, S., et al. 2023, MNRAS, 523, 5899
2023
-
[24]
2009, MNRAS, 399, 497
Dolag, K., Borgani, S., Murante, G., & Springel, V . 2009, MNRAS, 399, 497
2009
-
[25]
J., Gregg, M
Drinkwater, M. J., Gregg, M. D., & Colless, M. 2001, ApJ, 548, L139
2001
-
[26]
2003, MNRAS, 344, L13
Ettori, S. 2003, MNRAS, 344, L13
2003
-
[27]
Evrard, A. E. 1997, MNRAS, 292, 289
1997
-
[28]
2011, MNRAS, 416, 801
Fabjan, D., Borgani, S., Rasia, E., et al. 2011, MNRAS, 416, 801
2011
-
[29]
G., Hora, J
Fazio, G. G., Hora, J. L., Allen, L. E., et al. 2004, ApJS, 154, 10
2004
-
[30]
T., et al
Ferlito, F., Springel, V ., Davies, C. T., et al. 2023, MNRAS, 524, 5591
2023
-
[31]
2009, ApJ, 703, 982
Giodini, S., Pierini, D., Finoguenov, A., et al. 2009, ApJ, 703, 982
2009
-
[32]
2023, A&A, 680, A94
Gouin, C., Bonamente, M., Galárraga-Espinosa, D., Walker, S., & Mirakhor, M. 2023, A&A, 680, A94
2023
-
[33]
2022, A&A, 664, A198
Gouin, C., Gallo, S., & Aghanim, N. 2022, A&A, 664, A198
2022
-
[34]
2023, MNRAS, 524, 2507
Hadzhiyska, B., Eisenstein, D., Hernquist, L., et al. 2023, MNRAS, 524, 2507
2023
-
[35]
2016, MNRAS, 457, 3024
Haider, M., Steinhauser, D., V ogelsberger, M., et al. 2016, MNRAS, 457, 3024
2016
-
[36]
J., & Holder, G
Haiman, Z., Mohr, J. J., & Holder, G. P. 2001, ApJ, 553, 545
2001
-
[37]
R., Millman, K
Harris, C. R., Millman, K. J., van der Walt, S. J., et al. 2020, Nature, 585, 357
2020
-
[38]
A., Puchwein, E., Shen, S., & Sijacki, D
Henden, N. A., Puchwein, E., Shen, S., & Sijacki, D. 2018, MNRAS, 479, 5385
2018
-
[39]
A., Puchwein, E., & Sijacki, D
Henden, N. A., Puchwein, E., & Sijacki, D. 2019, MNRAS, 489, 2439
2019
-
[40]
W., Allison, R., Austermann, J., et al
Henderson, S. W., Allison, R., Austermann, J., et al. 2016, J. Low Temp. Phys., 184, 772 Hernández-Aguayo, C., Springel, V ., Pakmor, R., et al. 2023, MNRAS, 524, 2556
2016
-
[41]
Holder, G., Haiman, Z., & Mohr, J. J. 2001, ApJ, 560, L111
2001
-
[42]
Hunter, J. D. 2007, Comp. Sci. Eng., 9, 90
2007
-
[43]
S., Pearce, F
Jenkins, A., Frenk, C. S., Pearce, F. R., et al. 1998, ApJ, 499, 20 Jóhannesson, G., Björnsson, G., & Gudmundsson, E. H. 2006, ApJ, 640, L5
1998
-
[44]
D., Mulchaey, J
Johnson, S. D., Mulchaey, J. S., Chen, H.-W., et al. 2019, ApJ, 884, L31
2019
-
[45]
1986, MNRAS, 222, 323
Kaiser, N. 1986, MNRAS, 222, 323
1986
-
[46]
2023, MNRAS, 524, 2594
Kannan, R., Springel, V ., Hernquist, L., et al. 2023, MNRAS, 524, 2594
2023
-
[47]
2023, MNRAS, 526, 6103
Kugel, R., Schaye, J., Schaller, M., et al. 2023, MNRAS, 526, 6103
2023
-
[48]
2011, arXiv e-prints, [arXiv:1110.3193] Le Brun, A
Laureijs, R., Amiaux, J., Arduini, S., et al. 2011, arXiv e-prints, [arXiv:1110.3193] Le Brun, A. M. C., McCarthy, I. G., Schaye, J., & Ponman, T. J. 2016, MNRAS, 466, 4442
2011 arXiv
-
[49]
2024, A&A, 686, A55
Lee, W., Pillepich, A., ZuHone, J., et al. 2024, A&A, 686, A55
2024
-
[50]
2024, A&A, 687, A129
Lehle, K., Nelson, D., Pillepich, A., Truong, N., & Rohr, E. 2024, A&A, 687, A129
2024
-
[51]
H., Barnes, D., V ogelsberger, M., et al
Lim, S. H., Barnes, D., V ogelsberger, M., et al. 2021, MNRAS, 504, 5131
2021
-
[52]
Lotka, A. J. 1926, J. Wash. Acad. Sci., 16, 317
1926
-
[53]
H., & Schellenberger, G
Lovisari, L., Reiprich, T. H., & Schellenberger, G. 2015, A&A, 573, A118 Article number, page 13 of 17 A&A proofs: manuscript no. aa52568-24 LSST Dark Energy Science Collaboration. 2012, arXiv e-prints, [arXiv:1211.0310]
2015 arXiv
-
[54]
B., Allen, S
Mantz, A. B., Allen, S. W., Morris, R. G., et al. 2016, MNRAS, 463, 3582
2016
-
[55]
2018, MNRAS, 480, 5113
Marinacci, F., V ogelsberger, M., Pakmor, R., et al. 2018, MNRAS, 480, 5113
2018
-
[56]
C., et al
Martizzi, D., V ogelsberger, M., Artale, M. C., et al. 2019, MNRAS, 486, 3766
2019
-
[57]
A., Vikhlinin, A., et al
McDonald, M., Benson, B. A., Vikhlinin, A., et al. 2013, ApJ, 774, 23
2013
-
[58]
S., Schombert, J
McGaugh, S. S., Schombert, J. M., de Blok, W. J. G., & Zagursky, M. J. 2010, ApJ, 708, L14
2010
-
[59]
L., Balogh, M
McGee, S. L., Balogh, M. L., Bower, R. G., Font, A. S., & McCarthy, I. G. 2009, MNRAS, 400, 937
2009
-
[60]
2010, in Proc
McKinney, W. 2010, in Proc. 9th Python in Science Conference, ed. S. van der Walt & J. Millman, 56–61
2010
-
[61]
2012, arXiv e-prints, [arXiv:1209.3114]
Merloni, A., Predehl, P., Becker, W., et al. 2012, arXiv e-prints, [arXiv:1209.3114]
2012 arXiv
-
[62]
Mohr, J. J. & Evrard, A. E. 1997, ApJ, 491, 38
1997
-
[63]
J., Mathiesen, B., & Evrard, A
Mohr, J. J., Mathiesen, B., & Evrard, A. E. 1999, ApJ, 517, 627
1999
-
[64]
L., Farahi, A., Evrard, A
Mulroy, S. L., Farahi, A., Evrard, A. E., et al. 2019, MNRAS, 484, 60
2019
-
[65]
V ., & Vikhlinin, A
Nagai, D., Kravtsov, A. V ., & Vikhlinin, A. 2007, ApJ, 668, 1
2007
-
[66]
P., Pillepich, A., Springel, V ., et al
Naiman, J. P., Pillepich, A., Springel, V ., et al. 2018, MNRAS, 477, 1206
2018
-
[67]
2013, arXiv e-prints, [arXiv:1306.2307]
Nandra, K., Barret, D., Barcons, X., et al. 2013, arXiv e-prints, [arXiv:1306.2307]
2013 arXiv
-
[68]
2024, A&A, 686, A157
Nelson, D., Pillepich, A., Ayromlou, M., et al. 2024, A&A, 686, A157
2024
-
[69]
2018, MNRAS, 475, 624
Nelson, D., Pillepich, A., Springel, V ., et al. 2018, MNRAS, 475, 624
2018
-
[70]
2022, arXiv e-prints, [arXiv:2203.15666]
Nicastro, F., Fang, T., & Mathur, S. 2022, arXiv e-prints, [arXiv:2203.15666]
2022 arXiv
-
[71]
2018, Nature, 558, 406 O’Hara, T
Nicastro, F., Kaastra, J., Krongold, Y ., et al. 2018, Nature, 558, 406 O’Hara, T. B., Mohr, J. J., Bialek, J. J., & Evrard, A. E. 2006, ApJ, 639, 64
2018
-
[72]
2011, MNRAS, 418, 1392
Pakmor, R., Bauer, A., & Springel, V . 2011, MNRAS, 418, 1392
2011
-
[73]
& Springel, V
Pakmor, R. & Springel, V . 2013, MNRAS, 432, 176
2013
-
[74]
P., et al
Pakmor, R., Springel, V ., Coles, J. P., et al. 2023, MNRAS, 524, 2539
2023
-
[75]
A., Padilla, N
Pallero, D., Gómez, F. A., Padilla, N. D., et al. 2019, MNRAS, 488, 847
2019
-
[76]
R., Kay, S
Pike, S. R., Kay, S. T., Newton, R. D. A., Thomas, P. A., & Jenkins, A. 2014, MNRAS, 445, 1774
2014
-
[77]
2018, MNRAS, 475, 648
Pillepich, A., Nelson, D., Hernquist, L., et al. 2018, MNRAS, 475, 648
2018
-
[78]
Pillepich, A., Porciani, C., & Reiprich, T. H. 2012, MNRAS, 422, 44
2012
-
[79]
H., Porciani, C., Borm, K., & Merloni, A
Pillepich, A., Reiprich, T. H., Porciani, C., Borm, K., & Merloni, A. 2018, MN- RAS, 481, 613
2018
-
[80]
2018, MNRAS, 473, 4077
Pillepich, A., Springel, V ., Nelson, D., et al. 2018, MNRAS, 473, 4077
2018
-
[81]
2013, MNRAS, 438, 195
Planelles, S., Borgani, S., Fabjan, D., et al. 2013, MNRAS, 438, 195
2013
-
[82]
2022a, MNRAS, submitted [arXiv:2205.11528]
Pop, A.-R., Hernquist, L., Nagai, D., et al. 2022a, MNRAS, submitted [arXiv:2205.11528]
-
[83]
2022b, MNRAS, submitted [arXiv:2205.11537]
Pop, A.-R., Hernquist, L., Nagai, D., et al. 2022b, MNRAS, submitted [arXiv:2205.11537]
-
[84]
W., Croston, J
Pratt, G. W., Croston, J. H., Arnaud, M., & Böhringer, H. 2009, A&A, 498, 361
2009
-
[85]
2021, A&A, 647, A1
Predehl, P., Andritschke, R., Arefiev, V ., et al. 2021, A&A, 647, A1
2021
-
[86]
Press, W. H. & Schechter, P. 1974, ApJ, 187, 425
1974
-
[87]
2008, ApJ, 687, L53
Puchwein, E., Sijacki, D., & Springel, V . 2008, ApJ, 687, L53
2008
-
[88]
Reiprich, T. H. & Böhringer, H. 2002, ApJ, 567, 716
2002
-
[89]
2024, A&A, 686, A86
Rohr, E., Pillepich, A., Nelson, D., Ayromlou, M., & Zinger, E. 2024, A&A, 686, A86
2024
-
[90]
Sanderson, A. J. R., O’Sullivan, E., Ponman, T. J., et al. 2013, MNRAS, 429, 3288
2013
-
[91]
2023, MNRAS, 526, 4978
Schaye, J., Kugel, R., Schaller, M., et al. 2023, MNRAS, 526, 4978
2023
-
[92]
1976, ApJ, 203, 297
Schechter, P. 1976, ApJ, 203, 297
1976
-
[93]
2019, in BAAS, V ol
Sehgal, N., Aiola, S., Akrami, Y ., et al. 2019, in BAAS, V ol. 51, 6
2019
-
[94]
M., Smith, B
Shull, J. M., Smith, B. D., & Danforth, C. W. 2012, ApJ, 759, 23
2012
-
[95]
2010, MNRAS, 401, 791
Springel, V . 2010, MNRAS, 401, 791
2010
-
[96]
2018, MNRAS, 475, 676
Springel, V ., Pakmor, R., Pillepich, A., et al. 2018, MNRAS, 475, 676
2018
-
[97]
Springel, V ., White, S. D. M., Tormen, G., & Kau ffmann, G. 2001, MNRAS, 328, 726
2001
-
[98]
E., Pearce, F., & Gazzola, L
Stanek, R., Rasia, E., Evrard, A. E., Pearce, F., & Gazzola, L. 2010, ApJ, 715, 1508
2010
-
[99]
M., Donahue, M., et al
Sun, M., V oit, G. M., Donahue, M., et al. 2009, ApJ, 693, 1142
2009
-
[100]
Sunyaev, R. A. & Zeldovich, Y . B. 1972, Comments Astrophys. Space Phys., 4, 173
1972
-
[101]
2024, A&A, 686, A200
Truong, N., Pillepich, A., Nelson, D., et al. 2024, A&A, 686, A200
2024
-
[102]
2017, MNRAS, 474, 4089
Truong, N., Rasia, E., Mazzotta, P., et al. 2017, MNRAS, 474, 4089
2017
-
[103]
A., Ebeling, H., et al
Vikhlinin, A., Burenin, R. A., Ebeling, H., et al. 2009, ApJ, 692, 1033
2009
-
[104]
Villumsen, J. V . 1982, MNRAS, 199, 493
1982
-
[105]
E., et al
Virtanen, P., Gommers, R., Oliphant, T. E., et al. 2020, Nat. Methods, 17, 261
2020
-
[106]
2019, Space Sci
Walker, S., Simionescu, A., Nagai, D., et al. 2019, Space Sci. Rev., 215, 7
2019
-
[107]
2017, MNRAS, 465, 3291
Weinberger, R., Springel, V ., Hernquist, L., et al. 2017, MNRAS, 465, 3291
2017
-
[108]
White, S. D. M. 1978, MNRAS, 184, 185
1978
-
[109]
White, S. D. M. & Frenk, C. S. 1991, ApJ, 379, 52
1991
-
[110]
White, S. D. M. & Rees, M. J. 1978, MNRAS, 183, 341
1978
-
[111]
L., Eisenhardt, P
Wright, E. L., Eisenhardt, P. R. M., Mainzer, A. K., et al. 2010, AJ, 140, 1868
2010
-
[112]
missing baryons
Yang, T., Cai, Y .-C., Cui, W., et al. 2022, MNRAS, 516, 4084 Article number, page 14 of 17 Miller et al.: Baryonic scaling relations in IllustrisTNG and observations Appendix A: Calculating baryonic component percentages The baryonic component percentages are calculated by a ...
2022
Reviewed August 16, 2026 · model on record in the stance chip above.
Discussion (0). Continue with ORCID to comment.