REVIEW 2 major objections 2 minor 41 references
Weak Lensing Spectrotomography: A1767 and A2065
T0 review · 2 major / 2 minor · reviewed 2026-06-27 · grok-4.3
Pith's one-line read Spectroscopic redshifts enable tomographic weak lensing detections in clusters A1767 and A2065 at 3.1 and 3.5 sigma.
desk verdict The paper delivers the first HSC-based spectrotomography detections at 3.1-3.5 sigma for A1767 and A2065 that match caustic masses, but leaves the bright-galaxy shear systematics flagged in their A2029 work unquantified. read the letter →
The pith
A machine-rendered reading of the paper's core claim, the machinery that carries it, and where it could break.
The reading
What carries the argument
Spectrotomography, weak lensing tomography that relies exclusively on spectroscopically confirmed background galaxies to separate them from cluster members.
What would settle it
A measurement in which the tomographic shear amplitudes fail to match the caustic dynamical masses or do not increase with source redshift would falsify the detection claim.
Extended reading notes
Core claim
Spectrotomography using only galaxies with spectroscopic redshifts yields detections of tomographic shear signals at 3.1 sigma for A1767 and 3.5 sigma for A2065. The shear amplitudes are consistent with the clusters' dynamical caustic masses and scale appropriately with source redshift. This spectroscopic approach cleanly separates cluster members from the background and reduces potential systematics from photometric redshifts.
Load-bearing premise
Spectroscopic redshifts cleanly separate background galaxies from cluster members with negligible contamination or selection effects, and shear measurements on the bright background galaxies are free from subtle systematics.
Editorial extensions
If this is right
- Shear signal amplitudes match the cluster dynamical caustic masses.
- Signals scale appropriately with source redshift.
- The spectroscopic method suppresses systematics that photometric redshifts can introduce.
- The three detections including A2029 set the stage for broader unbiased cluster mass determinations and a potential geometric cosmological test.
Reading between the lines
- Subtle potential systematics noted in the A2029 comparison could affect applications to larger Subaru, Euclid, and LSST samples.
- The technique opens a path to a geometric cosmological test independent of other probes once more clusters are measured.
- Extension to additional clusters would provide a larger sample of unbiased weak lensing masses.
Signed reviews
Editorial analysis
A structured set of objections, weighed in public.
Referee Report
Summary. The manuscript presents the first application of spectroscopic tomographic weak lensing (spectrotomography) to clusters A1767 and A2065 using archival Subaru/HSC imaging combined with new spectroscopy. It reports tomographic shear detections at 3.1σ (A1767) and 3.5σ (A2065) based exclusively on galaxies with spectroscopic redshifts, claims consistency of shear amplitudes with independent dynamical (caustic) masses, and notes appropriate scaling with source redshift. The work also compares to a prior A2029 detection and flags potential subtle systematics in shear measurements for relatively bright background galaxies.
Significance. If the shear measurements prove robust, the result demonstrates a data-driven method for cluster weak-lensing masses that avoids photometric-redshift contamination and selection biases. The reported consistency with caustic masses and redshift scaling would provide independent validation. With three clusters now measured (including A2029), the technique is positioned for broader use in unbiased mass calibration and potentially for geometric cosmological tests independent of other probes, with direct relevance to Euclid and LSST data.
major comments (2)
- [Abstract] Abstract and final paragraph: the central claim of 3.1σ and 3.5σ detections rests on the assertion that shear amplitudes for the bright spectroscopic background sample are free of the subtle systematics identified in the A2029 DECam comparison. No quantitative test (null test, PSF-model variation, or magnitude-dependent residual analysis) is presented to show that any such bias is smaller than the reported significance; because the sample is restricted to spectroscopically confirmed objects, any measurement bias directly affects both the detection significance and the redshift-scaling test.
- [Methods (spectroscopic selection)] The assumption that spectroscopic redshifts yield negligible cluster-member contamination and no selection-induced bias in the shear sample is load-bearing for the mass-consistency and redshift-scaling statements, yet no explicit contamination fraction, purity estimate, or test against alternative redshift cuts is provided.
minor comments (2)
- [Abstract] The abstract states that signals 'scale appropriately with source redshift' but does not specify the number of tomographic bins or the exact redshift ranges used; adding this detail would clarify the tomographic aspect.
- Figure captions and text should explicitly state the magnitude limit and typical S/N of the spectroscopically selected background galaxies to allow readers to assess the relevance of the A2029 systematics warning.
Simulated Author's Rebuttal
We thank the referee for their careful and constructive review of our manuscript. We address the major comments point by point below and will revise the manuscript to incorporate the suggested improvements.
read point-by-point responses
-
Referee: [Abstract] Abstract and final paragraph: the central claim of 3.1σ and 3.5σ detections rests on the assertion that shear amplitudes for the bright spectroscopic background sample are free of the subtle systematics identified in the A2029 DECam comparison. No quantitative test (null test, PSF-model variation, or magnitude-dependent residual analysis) is presented to show that any such bias is smaller than the reported significance; because the sample is restricted to spectroscopically confirmed objects, any measurement bias directly affects both the detection significance and the redshift-scaling test.
Authors: We agree that the absence of explicit quantitative tests for these clusters leaves the robustness of the 3.1σ and 3.5σ claims open to the concern raised. The manuscript already flags potential subtle systematics from the A2029 comparison, but we did not perform the specific null tests, PSF variations, or magnitude-dependent analyses for A1767 and A2065. We will add these tests in the revised manuscript to the extent permitted by the data, along with a clearer discussion of how any residual bias would impact the significance and scaling results. revision: yes
-
Referee: [Methods (spectroscopic selection)] The assumption that spectroscopic redshifts yield negligible cluster-member contamination and no selection-induced bias in the shear sample is load-bearing for the mass-consistency and redshift-scaling statements, yet no explicit contamination fraction, purity estimate, or test against alternative redshift cuts is provided.
Authors: While the use of spectroscopic redshifts provides a clean separation in principle, we acknowledge that the manuscript lacks the explicit quantitative estimates and sensitivity tests requested. We will revise the methods section to include contamination fraction and purity estimates derived from the spectroscopic catalog, as well as tests of the shear signal under alternative redshift cuts, to better support the mass-consistency and scaling claims. revision: yes
Circularity Check
No circularity: shear detections and redshift scaling are direct measurements compared to independent caustic masses
full rationale
The paper reports tomographic shear signals measured directly from Subaru/HSC imaging restricted to galaxies with new spectroscopic redshifts. Detections at 3.1σ and 3.5σ, amplitude consistency with caustic dynamical masses, and redshift scaling are all data-driven comparisons to external quantities. No equations, fitted parameters renamed as predictions, or self-citation chains reduce these results to the inputs by construction. The A2029 comparison is presented as an external check that flags potential systematics rather than a load-bearing premise. The derivation chain is self-contained against external benchmarks.
Assumptions & free parameters
Cite this review
Pith. "Pith review of Weak Lensing Spectrotomography: A1767 and A2065." pith.science (2026). https://pith.science/paper/T5BLZWC6
@misc{pith2026260612613,
  author       = {Pith},
  title        = {Pith review of: Weak Lensing Spectrotomography: A1767 and A2065},
  year         = {2026},
  howpublished = {\url{https://pith.science/paper/T5BLZWC6}},
  note         = {Machine review of arXiv:2606.12613}
}
abstract
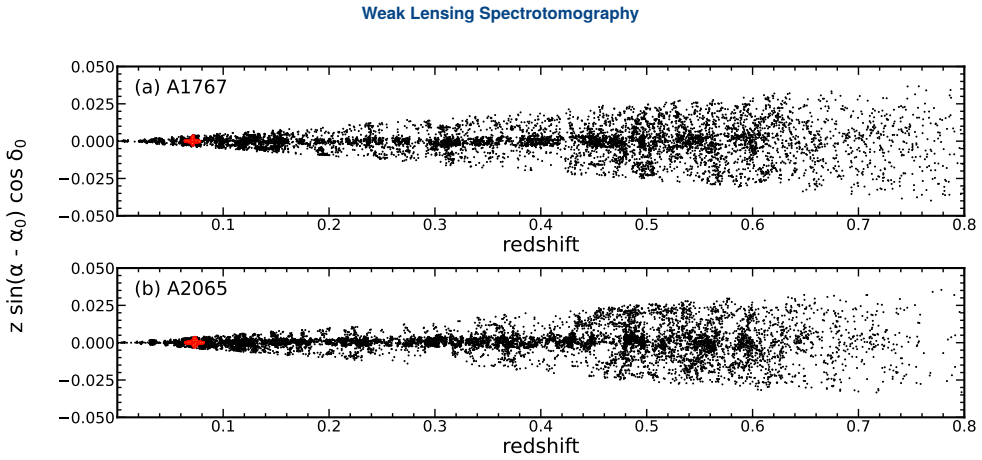
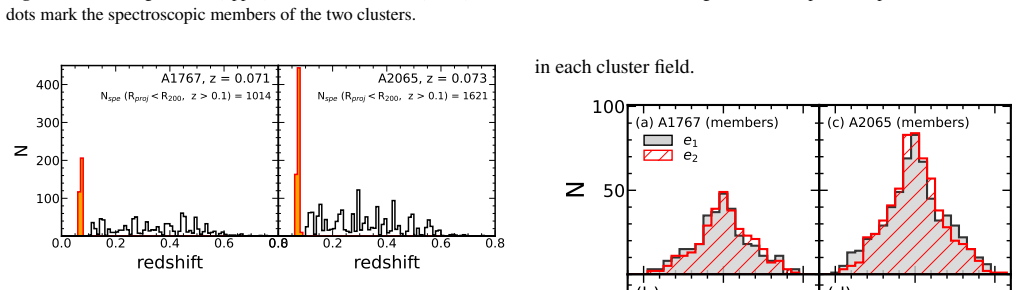
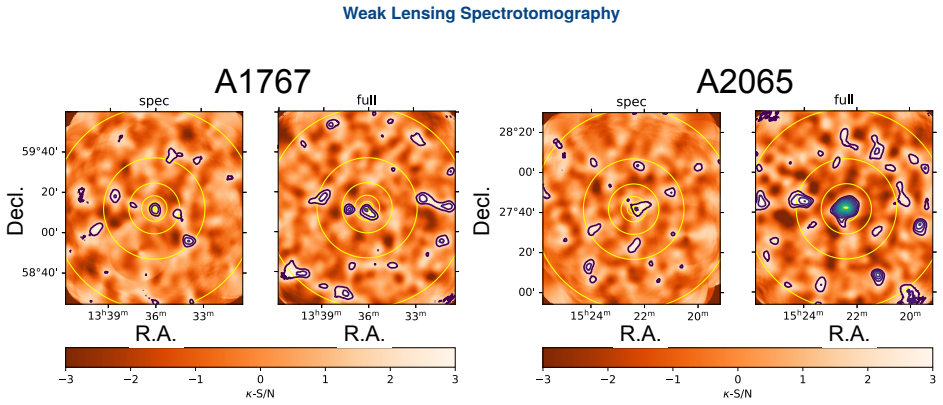
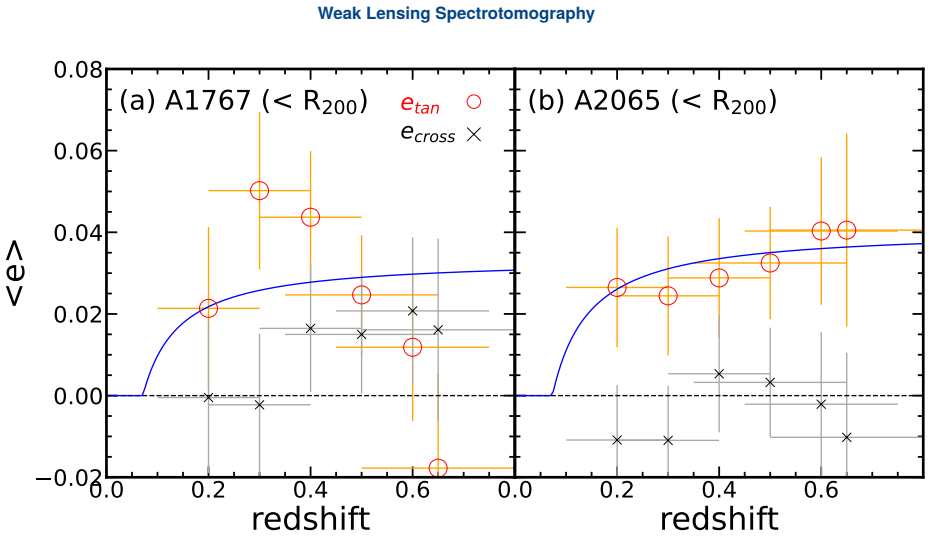
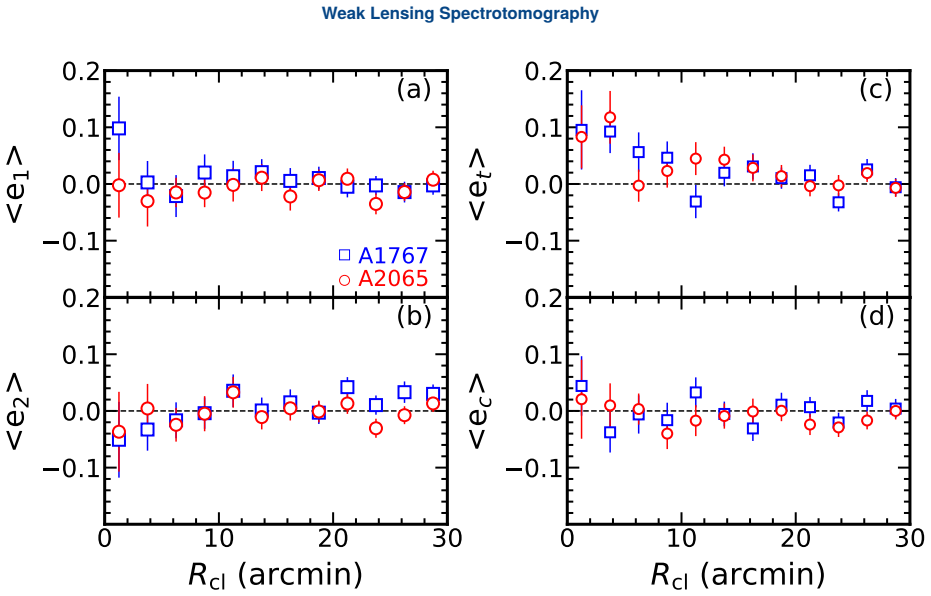
We describe spectroscopic tomographic weak lensing measurements (spectrotomography) for two rich clusters of galaxies, A1767 and A2065, based on extensive spectroscopy and Subaru/Hyper Suprime-Cam (HSC) imaging. These detections represent the first use of spectrotomography based on archival Subaru/HSC imaging. The measurements depend only on galaxies with spectroscopic redshifts reported here. The approach cleanly separates cluster members from the background and suppresses systematics that may be introduced by the use of photometric background redshifts. We detect the tomographic shear signals at $3.1\sigma$ (A1767) and $3.5\sigma$ (A2065). The shear signal amplitudes are consistent with the cluster dynamical (caustic) masses and they scale appropriately with source redshift. However, comparison with the first spectrophotometric detection of A2029 based on DECam imaging reveals some subtle potential systematic issues in deriving the shear signal for the relatively bright background galaxies used in the analysis. These issues may be important for understanding future more extensive applications of spectrotomography based on further Subaru imaging, as well as Euclid and LSST data. The total of three spectrophotometric detections (A1767, A2029, and A2065) sets the stage for broader application of the technique for unbiased cluster weak lensing mass determinations and potentially for a geometric cosmological test that is independent of other methods.
Figures


Figures from the paper (7 more)

Reference graph
Works this paper leans on
-
[1]
2019, PASJ, 71, 114
Aihara, H., AlSayyad, Y., Ando, M., et al. 2019, PASJ, 71, 114
2019
-
[2]
2022, PASJ, 74, 247
Aihara, H., AlSayyad, Y., Ando, M., et al. 2022, PASJ, 74, 247
2022
-
[3]
2014, Journal of Instrumentation, 9, C03048
Antilogus, P., Astier, P., Doherty, P., Guyonnet, A., & Regnault, N. 2014, Journal of Instrumentation, 9, C03048
2014
-
[4]
2013, PSFEx: Point Spread Function Extractor, As- trophysics Source Code Library, record ascl:1301.001.http: //ascl.net/1301.001
Bertin, E. 2013, PSFEx: Point Spread Function Extractor, As- trophysics Source Code Library, record ascl:1301.001.http: //ascl.net/1301.001
2013
-
[5]
2018, PASJ, 70, S5
Bosch, J., Armstrong, R., Bickerton, S., et al. 2018, PASJ, 70, S5
2018
-
[6]
An Overview of the LSST Image Processing Pipelines
Bosch, J., AlSayyad, Y., Armstrong, R., et al. 2019, in Astronomical Society of the Pacific Conference Series, Vol. 523, Astronomical Data Analysis Software and Systems XXVII, ed. P. J. Teuben, M. W. Pound, B. A. Thomas, & E. M. Warner, 521, doi:10. 48550/arXiv.1812.03248
work page Pith review arXiv 2019
-
[7]
Spergel, D. N. 2018, AJ, 155, 258 Dell’Antonio, I., Sohn, J., Geller, M. J., McCleary, J., & von der
2018
-
[8]
Data Release 1 of the Dark Energy Spectroscopic Instrument
Linden, A. 2020, ApJ, 903, 64 DESI Collaboration, Abdul-Karim, M., Adame, A. G., et al. 2025, arXiv e-prints, arXiv:2503.14745
work page Pith review arXiv 2020
Show all 41 references
-
[9]
1999, MNRAS, 309, 610
Diaferio, A. 1999, MNRAS, 309, 610
1999
-
[10]
Diaferio, A., & Geller, M. J. 1997, ApJ, 481, 633 Euclid Collaboration, Ingoglia, L., Sereno, M., et al. 2024a, arXiv e-prints, arXiv:2409.02783 Euclid Collaboration, Mellier, Y., Abdurro’uf, et al. 2024b, arXiv e-prints, arXiv:2405.13491
1997
-
[11]
2005, PASP, 117, 1411
Fabricant, D., Fata, R., Roll, J., et al. 2005, PASP, 117, 1411
2005
-
[12]
2022, ApJ, 933, 84
Fu, S., Dell’Antonio, I., Chary, R.-R., et al. 2022, ApJ, 933, 84
2022
-
[13]
2024, ApJ, 974, 69
Fu, S., Dell’Antonio, I., Escalante, Z., et al. 2024, ApJ, 974, 69
2024
-
[14]
2015, PASJ, 67, 34
Hamana, T., Sakurai, J., Koike, M., & Miller, L. 2015, PASJ, 67, 34
2015
-
[15]
2020, PASJ, 72, 78 Herbonnet,R.,Crawford,A.,Avestruz,C.,etal.2022,MNRAS,513, 2178
Hamana, T., Shirasaki, M., & Lin, Y.-T. 2020, PASJ, 72, 78 Herbonnet,R.,Crawford,A.,Avestruz,C.,etal.2022,MNRAS,513, 2178
2020
-
[16]
2003, MNRAS, 343, 459 Hirata,C.M.,Mandelbaum,R.,Seljak,U.,etal.2004,MNRAS,353, 529
Hirata, C., & Seljak, U. 2003, MNRAS, 343, 459 Hirata,C.M.,Mandelbaum,R.,Seljak,U.,etal.2004,MNRAS,353, 529
2003
-
[17]
2002, Phys
Hu, W. 2002, Phys. Rev. D, 66, 083515
2002
-
[18]
J., Cha, S., & Cho, H
HyeongHan, K., Jee, M. J., Cha, S., & Cho, H. 2024, Nature Astron- omy, 8, 377
2024
-
[19]
J., Lee, W., et al
HyeongHan, K., Jee, M. J., Lee, W., et al. 2025, Nature Astronomy, 9, 925 Ivezić, Ž., Kahn, S. M., Tyson, J. A., et al. 2019a, ApJ, 873, 111 Ivezić, Ž., Kahn, S. M., Tyson, J. A., et al. 2019b, ApJ, 873, 111 Jiménez-Teja, Y., Román, J., HyeongHan, K., et al. 2024, arXiv e- pri...
2025
-
[20]
1993, ApJ, 404, 441
Kaiser, N., & Squires, G. 1993, ApJ, 404, 441
1993
-
[21]
L., von der Linden, A., Applegate, D
Kelly, P. L., von der Linden, A., Applegate, D. E., et al. 2014, MN- RAS, 439, 28
2014
-
[22]
2025a, arXiv e-prints, arXiv:2511.02323
Kim, S., HyeongHan, K., Lee, W., et al. 2025a, arXiv e-prints, arXiv:2511.02323
-
[23]
J., & Mink, D
Kurtz, M. J., & Mink, D. J. 1998, PASP, 110, 934 Mandelbaum,R.,Hirata,C.M.,Seljak,U.,etal.2005,MNRAS,361, 1287 Martinet,N.,Bartlett,J.G.,Kiessling,A.,&Sartoris,B.2015,A&A, 581, A101
1998
-
[24]
2011, MNRAS, 414, 1840
Medezinski, E., Broadhurst, T., Umetsu, K., Benítez, N., & Taylor, A. 2011, MNRAS, 414, 1840
2011
-
[25]
2018, PASJ, 70, S1
Miyazaki, S., Komiyama, Y., Kawanomoto, S., et al. 2018, PASJ, 70, S1
2018
-
[26]
S., & Santucci, G
Montes, M., Brough, S., Owers, M. S., & Santucci, G. 2021, ApJ, 910, 45
2021
-
[27]
2023, Fast- SpecFit: Fast spectral synthesis and emission-line fitting of DESI spectra, Astrophysics Source Code Library, record ascl:2308.005
Moustakas, J., Scholte, D., Dey, B., & Khederlarian, A. 2023, Fast- SpecFit: Fast spectral synthesis and emission-line fitting of DESI spectra, Astrophysics Source Code Library, record ascl:2308.005. http://ascl.net/2308.005
2023
-
[28]
J., Rines, K
Park, J.-I., Sohn, J., Geller, M. J., Rines, K. J., & Diaferio, A. 2026, ApJ, 1001, 185 Planck Collaboration, Ade, P. A. R., Aghanim, N., et al. 2016, A&A, 594, A13
2026
-
[29]
J., Ferraro, S., Aldering, G., et al
Schlegel, D. J., Ferraro, S., Aldering, G., et al. 2022, arXiv e-prints, arXiv:2209.03585
2022
-
[30]
L., & Diaferio, A
Serra, A. L., & Diaferio, A. 2013, ApJ, 768, 116
2013
-
[31]
J., Diaferio, A., & Rines, K
Sohn, J., Geller, M. J., Diaferio, A., & Rines, K. J. 2020, ApJ, 891, 129
2020
-
[32]
J., Hwang, H
Sohn, J., Geller, M. J., Hwang, H. S., et al. 2021, ApJ, 909, 129
2021
-
[33]
J., Walker, S
Sohn, J., Geller, M. J., Walker, S. A., et al. 2019, ApJ, 871, 129
2019
-
[34]
J., Zahid, H
Sohn, J., Geller, M. J., Zahid, H. J., et al. 2017, ApJS, 229, 20
2017
-
[35]
A., Weinberg, D
Strauss, M. A., Weinberg, D. H., Lupton, R. H., et al. 2002, AJ, 124, 1810
2002
-
[36]
S., Chiba, M., et al
Takada, M., Ellis, R. S., Chiba, M., et al. 2014, PASJ, 66, R1
2014
-
[37]
2021, PASJ, 73, 735
Tanaka, M., Ikeda, H., Murata, K., et al. 2021, PASJ, 73, 735
2021
-
[38]
N., Kitching, T
Taylor, A. N., Kitching, T. D., Bacon, D. J., & Heavens, A. F. 2007, MNRAS, 374, 1377 The LSST Dark Energy Science Collaboration, Mandelbaum, R.,
2007
-
[39]
2018, arXiv e-prints, arXiv:1809.01669
Eifler, T., et al. 2018, arXiv e-prints, arXiv:1809.01669
2018
-
[40]
2022, ApJ, 928, 1
Wang, Y., Zhai, Z., Alavi, A., et al. 2022, ApJ, 928, 1
2022
-
[41]
O., & Brainerd, T
Wright, C. O., & Brainerd, T. G. 2000, ApJ, 534, 34
2000
Reviewed June 27, 2026 · model on record in the stance chip above.
Discussion (0). Continue with ORCID to comment.