REVIEW 3 major objections 5 minor 7 references
Helium variations in Galactic and extragalactic Globular Clusters
T0 review · 3 major / 5 minor · reviewed 2026-08-14 · deepseek-v4-flash
Pith's one-line read Globular clusters in the Milky Way and the Small Magellanic Cloud enrich their second stellar generations with the same amount of helium, about 1% by mass.
desk verdict A useful but thin proceedings summary of the authors' own prior results, with an unresolved factor-of-three tension between two helium estimates for NGC 121. read the letter →
The pith
A machine-rendered reading of the paper's core claim, the machinery that carries it, and where it could break.
The reading
What carries the argument
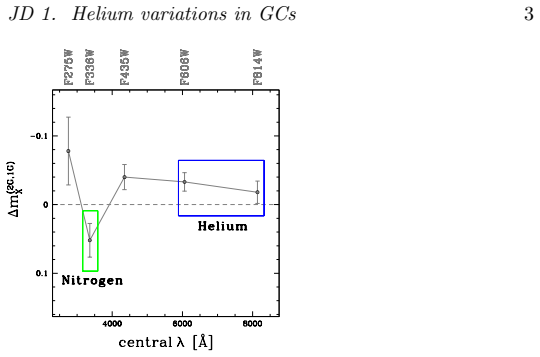
The central object is the red-giant-branch (RGB) bump, a slight pile-up of red-giant stars in the luminosity function at a characteristic magnitude. The paper measures the magnitude offset of this bump between first- and second-generation stars in several Hubble Space Telescope filters; synthetic spectral analysis removes the contribution from carbon, nitrogen, and oxygen abundance variations, and theoretical stellar models convert the residual optical-band magnitude displacement into a difference in helium mass fraction, $\delta Y$. For clusters where the bump is not detectable, the alternative is to measure the color difference between the two populations' RGB fiducial lines at a reference magnitude below the turn-off and apply the same synthetic-spectra plus models pipeline.
What would settle it
Compute $\delta Y$ for a given cluster from the RGB-bump shift in each available HST filter separately: if the resulting values trend with filter wavelength rather than agreeing, the synthetic-spectra separation of helium from C,N,O effects is wrong.
Extended reading notes
Core claim
The paper's central claim is that old globular clusters in the Milky Way and the Small Magellanic Cloud share comparable internal helium enrichment. From the RGB bump luminosity displacement, the mean helium variation between second- and first-generation stars across 18 Galactic clusters is $\delta Y\approx 0.01$, and the SMC cluster NGC 121 gives $\delta Y = 0.026 \pm 0.009$. From the RGB color-spread method, the four SMC clusters all show $\delta Y\approx 0.01$, with NGC 121 at $0.009 \pm 0.006$, consistent with the bump value within $1.5\sigma$. The authors find that helium-rich second-generation stars are also nitrogen-rich and carbon/oxygen-poor in both environments, so the chemical pattern of multiple populations is not unique to the Milky Way.
Load-bearing premise
The entire helium scale rests on synthetic spectral analyses and theoretical models correctly separating the helium contribution from much larger carbon, nitrogen, and oxygen abundance effects in the same stars.
Editorial extensions
If this is right
- The typical helium spread in these clusters is near 1% by mass, so any successful multiple-population model must produce $\delta Y\approx 0.01$ across galaxies.
- Because the same carbon-nitrogen and carbon/oxygen patterns appear in the Small Magellanic Cloud as in the Galaxy, the enrichment source must operate under similar conditions in both environments.
- For NGC 121, the RGB-bump and color-spread methods agree within $1.5\sigma$, supporting the reliability of the inferred helium scale.
- The shared pattern is consistent with multiple-population formation occurring at high redshift, before the clusters were incorporated into their present-day host galaxies.
Reading between the lines
- The authors do not draw this inference, but the same method could be extended with infrared space telescopes to clusters in more distant Local Group galaxies, making $\delta Y$ a probe of early nucleosynthesis across environments.
- If the near-uniform $\delta Y$ holds in a larger sample, it implies that the dilution of processed stellar ejecta with pristine gas is remarkably similar across different host galaxies; a search for trends with cluster mass, metallicity, and age would test this.
- A mean $\delta Y$ of only about 0.01 suggests that very helium-rich second generations are not required to explain the observed spreads, which would redirect attention to other parameters, such as rotation or mass loss, in explaining horizontal-branch morphology.
Signed reviews
Editorial analysis
A structured set of objections, weighed in public.
Referee Report
Summary. This proceedings paper reports helium abundance enhancements (δY) between first-generation (1G) and second-generation (2G) stars in Galactic and Small Magellanic Cloud (SMC) globular clusters. Using HST photometry, the authors measure the RGB-bump luminosity displacement for 18 Galactic clusters and for the SMC cluster NGC 121, and a color-spread/ridgeline method for four SMC clusters (including NGC 121). They find a mean δY ≈ 0.01 for the Galactic clusters and similar δY ~ 0.01 for the SMC clusters, concluding that Galactic and extragalactic GCs share common helium enrichment and thus a possibly universal formation mechanism for multiple populations.
Significance. If the result holds, it provides a quantitative link between multiple-population formation in the Milky Way and in an external galaxy (the SMC), with implications for models of globular cluster formation and early chemical enrichment. The paper builds on homogeneous UV–optical HST data and uses two independent methods for NGC 121, which is a strength, and it explicitly compares extragalactic and Galactic systems. The central quantitative claim, however, is sensitive to an internal discrepancy in the NGC 121 measurements and to the methods by which photometric displacements are converted to helium mass fractions; these issues must be resolved before the universality claim is convincing.
major comments (3)
- [Sections 2 and 3; Figure 3] The two measurements of δY for NGC 121 differ by roughly a factor of three: Section 2 reports δY = 0.026 ± 0.009 from the RGB-bump method, while Section 3 reports δY = 0.009 ± 0.006 from the color-spread method. The text calls these values 'consistent within 1.5σ,' but a 1.5σ agreement is not strong evidence that the two methods measure the same helium enrichment, especially when the central values differ by nearly twice the larger quoted error. The manuscript does not discuss the source of this discrepancy, does not show how each value enters the red histogram in Figure 3, and does not propagate the discrepancy into the quoted mean. Because the SMC clusters are the only extragalactic data and NGC 121 is the only cluster with both methods, this internal tension directly weakens the paper's central claim of universal helium enrichment.
- [Section 2, final paragraph] The paper states that the mean value of δY for the final selection of 18 Galactic GCs is δY ≈ 0.01, but it gives no uncertainty on this mean and does not justify the sample selection steps from 57 clusters to 26 with significant RGB-bump measurements to the final 18 with [Fe/H] < −1.0. Without any measure of the dispersion or standard error of the 18 measurements, and without stating the selection criteria, the reader cannot assess whether the Galactic value is statistically consistent with the SMC values or whether the apparent similarity is within the expected scatter.
- [Sections 2–3, synthetic spectral analysis and theoretical models] The conversion from observed RGB-bump magnitude displacements and color spreads to δY relies on synthetic spectral analysis to remove light-element (C,N,O) contributions and on 'appropriate theoretical models' to map residual photometric shifts to helium mass fraction. The manuscript does not describe the assumed abundance pattern of the 2G stars, the stellar model grid, the treatment of effective temperature and luminosity response, or the resulting systematic uncertainty on δY. Since the entire quantitative output depends on this conversion, the absence of an error budget makes the quoted δY values—and the universality claim—difficult to evaluate or reproduce.
minor comments (5)
- [Section 3, first paragraph] The text refers to 'the four CMDs relative to the cluster NGC 121, in Fig. 2,' but the four-panel CMD display appears to be Figure 4, not Figure 2 (which shows the 47 Tuc filter-dependence plot). Please correct the cross-reference.
- [Section 3, NGC 121 value] There is a missing space in 'we foundδY ∼ 0.009±0.006'; it should read 'we found δY ∼ 0.009 ± 0.006'.
- [Section 3, notation] The notation 'mM ST O F814W' is broken; it should presumably be written as m_{F814W}^{MSTO} or equivalent, with the superscript for the main-sequence turn-off.
- [Figure 3] The histograms in Figure 3 do not show individual cluster values or error bars. Since the paper is about the distribution of δY, providing a small table or markers with uncertainties would considerably clarify how the SMC clusters compare with the Galactic sample.
- [Abstract and Introduction] The abstract says 'We present the most recent estimates' but the paper is a proceedings summary of previously published work (Lagioia et al. 2018, 2019). This is acceptable, but the authors should state explicitly at the outset that this contribution condenses results from those papers and direct readers there for the full methodology.
Circularity Check
No significant circularity: δY values come from external stellar-model calibrations, not from the same data being re-labeled.
full rationale
The paper reports helium abundance variations derived from photometric RGB-bump displacements and RGB color spreads. These observables are not defined in terms of the output δY; instead, the conversion is made with synthetic spectral analysis and 'appropriate theoretical models,' which are external calibrations independent of the measured star colors and magnitudes. No parameter is fitted to a subset of the data and then presented as a prediction of a closely related quantity. The SMC measurements are new estimates compared with previously published Galactic values, and the conclusion that Galactic and extragalactic GCs share similar helium variations is a comparison of independently derived measurements, not a restatement of an input. The paper does rely heavily on the authors' own prior works (Lagioia et al. 2018, 2019) for the underlying analysis, but those works contain the actual methodology and are not invoked as a uniqueness theorem or as an unverified ansatz; the methods are summarized in the text. The internal tension between the two NGC 121 δY estimates (0.026 ± 0.009 from the RGB bump method and 0.009 ± 0.006 from the color-spread method) is a consistency or systematic-error concern, not a circularity. No circular step can be identified from the quoted text.
Assumptions & free parameters
assumptions (3)
- domain assumption Theoretical stellar models accurately predict the response of RGB bump luminosity and RGB colors to helium abundance changes.
- domain assumption Synthetic spectral analysis can correctly separate the photometric contribution of C,N,O variations from that of helium.
- domain assumption The pseudo-CMD combinations (F275W, F336W, F438W and F343N) cleanly separate 1G and 2G stars along the RGB.
Cite this review
Pith. "Pith review of Helium variations in Galactic and extragalactic Globular Clusters." pith.science (2026). https://pith.science/paper/T62UODDT
@misc{pith2026190811702,
  author       = {Pith},
  title        = {Pith review of: Helium variations in Galactic and extragalactic Globular Clusters},
  year         = {2026},
  howpublished = {\url{https://pith.science/paper/T62UODDT}},
  note         = {Machine review of arXiv:1908.11702}
}
read the original abstract
The recent measurements of internal variations of helium in Galactic and extragalactic Globular Clusters (GCs) set binding constraints to the models of formation of Multiple Populations (MPs) in GCs, and gave rise, at the same time, to crucial questions related with the influence of the environment on MP formation as well as with the role played by GCs in the early galactic formation. We present the most recent estimates of helium enrichment in the main populations of a large sample of Galactic and extragalactic GCs.
Figures


Figures from the paper (1 more)

Reference graph
Works this paper leans on
-
[1]
G., Carretta, E., & Bragaglia, A
Gratton, R. G., Carretta, E., & Bragaglia, A. 2012, A&A Review, 20, 50
work page 2012
-
[2]
Lagioia, E. P., Milone, A. P., Marino, A. F., et al. 2018, MNRAS, 475, 4088
work page 2018
-
[3]
Lagioia, E. P., Milone, A. P., Marino, A. F., et al. 2019, ApJ, 871, 140
work page 2019
-
[4]
F., Milone, A
Marino, A. F., Milone, A. P., Renzini, A., et al. 2019, MNRAS, 487, 3815
2019
-
[5]
P., Marino, A
Milone, A. P., Marino, A. F., Piotto, G., et al. 2015, ApJ, 808, 51
2015
-
[6]
P., Marino, A
Milone, A. P., Marino, A. F., Renzini, A., et al. 2018, MNRAS, 481, 5098
2018
-
[7]
P., Bedin, L
Piotto, G., Milone, A. P., Bedin, L. R., et al. 2015, AJ, 149, 91
2015
Reviewed August 14, 2026 · model on record in the stance chip above.
Discussion (0). Continue with ORCID to comment.