A Comparative Multi-Hazard Risk Assessment of the US High-Voltage Transmission Network
Pith reviewed 2026-05-25 04:57 UTC · model grok-4.3
The pith
A consistent multi-hazard framework finds tropical cyclone winds cause the highest direct damage to the US high-voltage transmission network at $137 million per day.
A machine-rendered reading of the paper's core claim, the machinery that carries it, and where it could break.
Core claim
Applying the framework across hazards shows tropical cyclone wind produces the largest expected daily damage at $137 M/day, followed by lightning at $87 M/day. Tornado yields the largest downstream output loss at $4.93 B/day, with flood and earthquake next. A major geomagnetic storm causes $2.07 B/day in losses. The compound freezing rain and wind gust scenario affects 237.4 million people and produces $85.16 B/day in output losses, serving as an upper-bound stress test.
What carries the argument
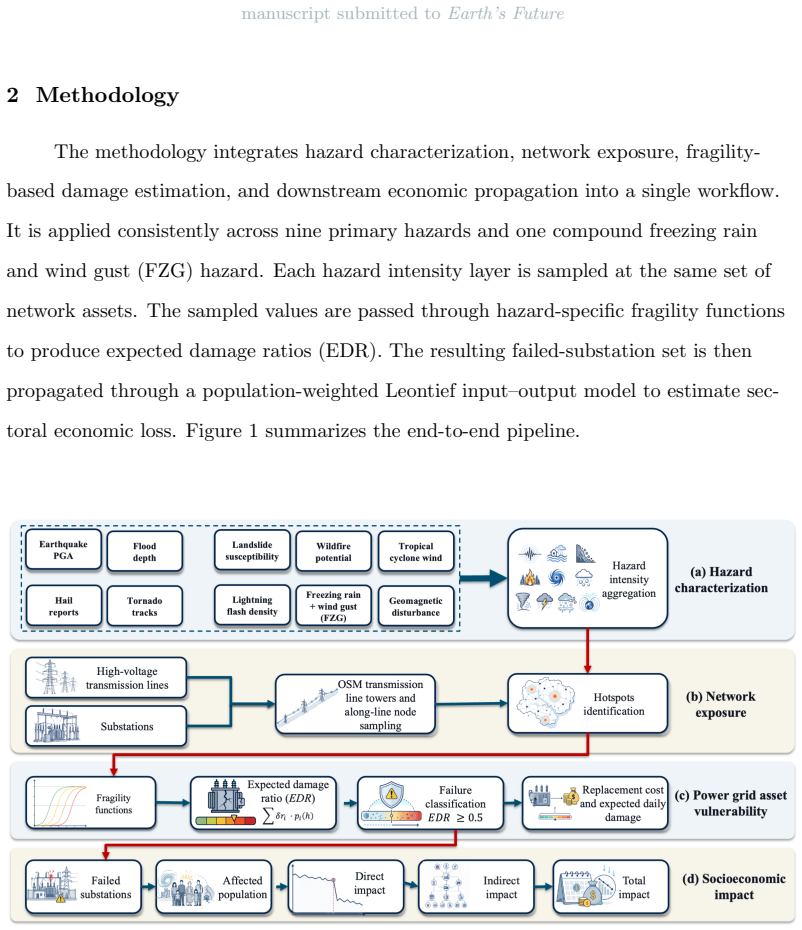
The integrated framework that links hazard characterization, fragility modeling, and macroeconomic impact propagation applied to the national transmission network model.
If this is right
- Tropical cyclone wind is the leading individual hazard for direct infrastructure damage.
- Tornadoes generate the highest downstream economic losses among single hazards.
- Geomagnetic storms produce losses comparable to major earth-based hazards like floods and earthquakes.
- The compound freezing rain and wind scenario causes far larger disruption than any single hazard.
- The results provide a baseline for comparing and prioritizing resilience investments across hazards.
Where Pith is reading between the lines
- If the uniform modeling assumptions hold, the approach could be adapted to evaluate grid risks in other countries with similar data.
- Climate-driven changes in hazard frequency might increase the relative importance of compound events.
- Targeting resilience to multiple hazards simultaneously may yield better returns than single-hazard focus.
- Further validation against historical event data could refine the economic multipliers used.
Load-bearing premise
Fragility curves, damage-to-population mappings, and macroeconomic multipliers apply uniformly without material bias across all hazards using the same national datasets and network model.
What would settle it
If observed damages and economic losses from historical events for several hazards deviate substantially from the model's predictions when using the same parameters, the uniform application would be called into question.
Figures


read the original abstract
Modern economies depend critically on high-voltage power transmission networks. Yet this infrastructure is routinely disrupted by natural hazards ranging from earthquakes and floods to tornadoes and geomagnetic storms. Risk assessments have historically addressed hazards in isolation, leaving no common basis for comparing economic impacts across the full hazard portfolio. This study addresses this gap by developing an integrated framework linking hazard characterization, fragility modeling, and macroeconomic impact propagation. The framework is applied consistently across nine primary hazards and one compound freezing rain and wind gust hazard. Using national hazard datasets and a US high-voltage transmission network of over 13,000 line segments and 10,000 substations, we derive failure probabilities, expected damage, affected population, and downstream economic output losses. Among individual hazards, tropical cyclone wind produces the largest expected daily damage at $137 M/day, followed by lightning at $87 M/day, earthquake at $47 M/day, flood at $46 M/day, tornado at $42 M/day, and landslide at $34 M/day. Downstream economic output losses are largest for tornado at $4.93 B/day, followed by flood at $3.59 B/day and earthquake at $3.02 B/day. A 250-year geomagnetic storm produces $2.07 B/day, placing space weather within the range of major terrestrial hazards. The compound freezing rain and wind gust scenario produces the largest stress-test disruption, affecting 237.4 M people and yielding a modeled downstream output loss of $85.16 B/day. These results should be interpreted as first-order bounding estimates, with the compound scenario representing an upper-bound stress test. Overall, the framework establishes a consistent baseline for prioritizing investments in transmission network resilience.
Editorial analysis
A structured set of objections, weighed in public.
Referee Report
Summary. The paper develops an integrated multi-hazard risk assessment framework that links hazard characterization, fragility modeling, and macroeconomic propagation, then applies it uniformly to nine primary hazards plus one compound freezing-rain/wind-gust scenario on a US high-voltage transmission network model (13k line segments, 10k substations). Using national hazard datasets it reports expected daily damage (tropical cyclone wind highest at $137 M/day), downstream output losses (tornado highest at $4.93 B/day), and stress-test impacts (compound scenario affecting 237.4 M people and $85.16 B/day loss), positioning the results as first-order bounding estimates.
Significance. If the modeling steps are shown to be robust, the work supplies a rare consistent baseline for ranking hazards and guiding resilience investments across the full portfolio of threats to critical infrastructure.
major comments (3)
- [Methods] Methods (framework application paragraph): the headline rankings rest on the same fragility curves, population-damage mappings, and macroeconomic multipliers being transferred without material bias across nine physically distinct hazards; no per-hazard calibration, cross-validation against observed outages, or sensitivity tests for transferability are described, which directly undermines the comparative claims.
- [Results] Results (reported figures for tropical cyclone wind, tornado, and compound scenario): the quantitative values ($137 M/day, $4.93 B/day, $85.16 B/day) are presented without error bars, derivation details, or validation of the underlying fragility and multiplier steps, leaving the ordering vulnerable to systematic bias in any single transferred component.
- [Abstract] Abstract and stress-test section: the compound scenario is described as an 'upper-bound stress test' yet the same uniform national datasets and network model are used; without explicit checks that the fragility and propagation assumptions remain comparable under simultaneous hazards, the $85.16 B/day figure cannot be reliably distinguished from an artifact of the modeling choices.
minor comments (2)
- [Abstract] The abstract states numerical results but supplies no derivation details, validation of fragility models, or sensitivity checks.
- [Results] Notation for 'expected daily damage' versus 'downstream economic output losses' should be defined explicitly on first use to avoid ambiguity in the comparative tables.
Simulated Author's Rebuttal
We thank the referee for their constructive comments on the robustness of the multi-hazard framework. We address each major point below and indicate where revisions will be made to improve transparency and discussion of assumptions.
read point-by-point responses
-
Referee: [Methods] Methods (framework application paragraph): the headline rankings rest on the same fragility curves, population-damage mappings, and macroeconomic multipliers being transferred without material bias across nine physically distinct hazards; no per-hazard calibration, cross-validation against observed outages, or sensitivity tests for transferability are described, which directly undermines the comparative claims.
Authors: The study applies a single integrated framework uniformly across hazards precisely to enable consistent comparison using the best available national-scale datasets. Per-hazard calibration and outage validation data do not exist in comparable form for all nine hazards, which is why the results are explicitly framed as first-order bounding estimates. We will add a new subsection on model assumptions and limitations, plus sensitivity tests on key transferred parameters (fragility thresholds and multipliers), to better qualify the comparative rankings. revision: partial
-
Referee: [Results] Results (reported figures for tropical cyclone wind, tornado, and compound scenario): the quantitative values ($137 M/day, $4.93 B/day, $85.16 B/day) are presented without error bars, derivation details, or validation of the underlying fragility and multiplier steps, leaving the ordering vulnerable to systematic bias in any single transferred component.
Authors: The figures are direct outputs of the sequential hazard-fragility-propagation steps detailed in the methods. We will expand the results section and add supplementary material with explicit derivation steps for the three highlighted values. Error bars are omitted because the estimates are constructed as bounding values rather than statistical forecasts; we will instead add a dedicated uncertainty discussion covering the main sources of potential bias in the transferred components. revision: partial
-
Referee: [Abstract] Abstract and stress-test section: the compound scenario is described as an 'upper-bound stress test' yet the same uniform national datasets and network model are used; without explicit checks that the fragility and propagation assumptions remain comparable under simultaneous hazards, the $85.16 B/day figure cannot be reliably distinguished from an artifact of the modeling choices.
Authors: The compound scenario applies the individual fragility functions concurrently to the same network model, which is the basis for labeling it an upper-bound stress test. We agree that interactions between simultaneous hazards are not explicitly validated. We will revise the abstract and stress-test section to clarify the additive application of fragility curves and add a short discussion of this modeling choice and its limitations. revision: yes
Circularity Check
No circularity: results propagate from external hazard datasets and network model
full rationale
The derivation applies an integrated framework to external national hazard datasets and a fixed 13k-line/10k-substation network model to compute failure probabilities, damage, and output losses. No step reduces a claimed prediction or ranking to a fitted parameter, self-citation, or input by construction. The uniform application of fragility curves and multipliers is an assumption about transferability, not a definitional loop. The paper is self-contained against external benchmarks.
Axiom & Free-Parameter Ledger
free parameters (2)
- hazard-specific fragility curve parameters
- economic output loss multipliers
axioms (2)
- domain assumption National hazard datasets accurately represent exposure and intensity distributions across the contiguous US.
- domain assumption Fragility and propagation models remain unbiased when applied uniformly across dissimilar hazards.
Reference graph
Works this paper leans on
-
[1]
Afzal, Suhail and Mokhlis, Hazlie and Mansor, Nurulafiqah Nadzirah and Illias, Hazlee Azil and Jamian, Jasrul Jamani and Sarmin, Mohd Khairun Nizam Mohd , address =. Modeling and. 2024. 2024 , isbn =. doi:10.1109/ICPEA60617.2024.10498988 , url =
-
[2]
Seismic fragility estimation of electrical substations accounting for component damage and short circuit faults , volume =. 2026 , issn =. doi:10.1016/j.ress.2025.111671 , journal =
-
[3]
Arab, Ali and Khodaei, Amin and Eskandarpour, Rozhin and Thompson, Matthew P. and Wei, Yu , shorttitle =. Three. 2021 , issn =. doi:10.1109/ACCESS.2021.3074477 , journal =
-
[4]
A probabilistic modeling and simulation framework for power grid flood risk assessment , volume =. 2025 , issn =. doi:10.1016/j.ijdrr.2025.105353 , journal =
-
[5]
A comprehensive review on resilience definitions, frameworks, metrics, and enhancement strategies in electrical distribution systems , volume =. 2025 , issn =. doi:10.1016/j.apenergy.2025.126141 , journal =
-
[6]
Bian, Haifeng and Zhang, Jun and Xie, Guanglong and Zhang, Chen , address =. Risk. 2024 9th. 2024 , isbn =. doi:10.1109/ACPEE60788.2024.10532389 , url =
-
[7]
Science Advances , publisher =
A globally consistent local-scale assessment of future tropical cyclone risk , volume =. Science Advances , publisher =. 2022 , doi =
2022
-
[8]
Risk-. 2019 , issn =. doi:10.1061/(ASCE)AS.1943-5525.0001029 , journal =
-
[9]
Census.gov , author =
2020. Census.gov , author =. 2020 , url =
2020
-
[10]
Census.gov , author =
Statistics of. Census.gov , author =. 2023 , url =
2023
-
[11]
First. 2020 , issn =. doi:10.1029/2019SW002260 , journal =
-
[12]
Environmental Research Letters , volume=
Quantifying the compound hazard of freezing rain and wind gusts across CONUS , author=. Environmental Research Letters , volume=. 2024 , publisher=
2024
-
[13]
Coburn, Jacob and Pryor, Sara C. and Barthelmie, Rebecca J. , title =. doi:10.5281/zenodo.10080809 , url =
-
[14]
Bor, Dennies K. and Oughton, Edward J. and Weigel, Robert S. and Gaunt, C. Trevor , year =. C-. doi:10.5281/zenodo.20089397 , url =
-
[15]
2023 , doi =
Wildfire. 2023 , doi =
2023
-
[16]
Multi-phase assessment and adaptation of power systems resilience to natural hazards , volume =. 2016 , issn =. doi:10.1016/j.epsr.2016.03.019 , journal =
-
[17]
2022 , month = jul, url =
Hazus Earthquake Model Technical Manual, Hazus 5.1 , institution =. 2022 , month = jul, url =
2022
-
[18]
Probabilistic analysis of wind-induced failures of transmission tower-line systems , volume =. 2025 , issn =. doi:10.1080/15732479.2025.2554724 , journal =
-
[19]
Ghorani, Rahim and Fattaheian-Dehkordi, Sajjad and Farrokhi, Mahdi and Fotuhi-Firuzabad, Mahmud and Lehtonen, Matti , shorttitle =. Modeling and. 2021 , issn =. doi:10.1109/ACCESS.2021.3084368 , journal =
-
[20]
2024 , doi =
Slope-. 2024 , doi =
2024
-
[21]
Earthquake failure mode and collapse fragility of a 1000. 2020 , issn =. doi:10.1016/j.istruc.2020.06.018 , journal =
-
[22]
Multi-hazard failure analysis and performance evaluation of transmission towers utilizing data-driven probabilistic models subject to combined wind and earthquake , volume =. 2025 , issn =. doi:10.1016/j.istruc.2025.109196 , journal =
-
[23]
2023 , url =
Transmission. 2023 , url =
2023
-
[24]
Review of failure risk and outage prediction in power system under wind hazards , volume =. 2022 , issn =. doi:10.1016/j.epsr.2022.108098 , journal =
-
[25]
Huang, Liping and Cun, Xin and Wang, Yifei and Lai, Chun Sing and Lai, Loi Lei and Tang, Junxi and Zhong, Bang , series =. Resilience-. 2018 , issn =. doi:10.1016/j.ifacol.2018.11.744 , journal =
-
[26]
Seismic fragility analysis of electric substation equipment and structures , volume =. 1998 , issn =. doi:10.1016/S0266-8920(97)00017-9 , journal =
-
[27]
and Sharma, Arjun and Skolfield, J
Jackson, Nicole D. and Sharma, Arjun and Skolfield, J. Kyle , address =. Spatio-. 2025. 2025 , isbn =. doi:10.1109/RWS66711.2025.11304397 , url =
-
[28]
Jeddi, Ashkan B. and Shafieezadeh, Abdollah and Hur, Jieun and Ha, Jeong‐Gon and Hahm, Daegi and Kim, Min‐Kyu , shorttitle =. Multi‐hazard typhoon and earthquake collapse fragility models for transmission towers:. 2022 , issn =. doi:10.1002/eqe.3735 , journal =
-
[29]
and Weimar, Mark R
Kabre, Wilfried W. and Weimar, Mark R. , shorttitle =. Fragility. 2022 , doi =
2022
-
[30]
Fragility. 2025 , issn =. doi:10.1002/wcc.930 , journal =
-
[31]
EUR-Scientific and Technical Research Reports
Climate Change and Critical Infrastructure–floods , year =. EUR-Scientific and Technical Research Reports. Luxembourg: Publications Office of the European Union , author =
-
[32]
Kelbert, Anna and Egbert, Gary D. and Schultz, Adam , year =. doi:10.17611/DP/EMTF.1 , url =
-
[33]
Lifetime multi-hazard fragility analysis of transmission towers under earthquake and wind considering wind-induced fatigue effect , volume =. 2022 , issn =. doi:10.1016/j.strusafe.2022.102266 , journal =
-
[34]
A multi-model probabilistic framework for seismic risk assessment and retrofit planning of electric power networks , volume =. 2026 , issn =. doi:10.1016/j.ress.2025.112001 , journal =
-
[35]
Seismic resilience assessment and improvement framework for electrical substations , volume =. 2023 , issn =. doi:10.1002/eqe.3800 , journal =
-
[36]
Risk assessment framework of geomagnetic storm disaster in long-distance. 2020 , issn =. doi:10.1088/1755-1315/510/2/022015 , journal =
-
[37]
Quantifying the seismic risk for electric power distribution systems , volume =. 2021 , issn =. doi:10.1080/15732479.2020.1734030 , journal =
-
[38]
A 100-year. 2020 , issn =. doi:10.1029/2019SW002329 , journal =
-
[39]
Component-based fragility analysis of transmission towers subjected to hurricane wind load , volume =. 2021 , issn =. doi:10.1016/j.engstruct.2021.112586 , journal =
-
[40]
Mac Manus, D. H. and Rodger, C. J. and Renton, A. and Lo, V. and Malone-Leigh, J. and Petersen, T. and Copland, M. and Hendry, A. T. and Clilverd, M. A. and Richardson, G. S. , shorttitle =. Implementing. 2025 , issn =. doi:10.1029/2025SW004388 , journal =
-
[41]
Macheri, Ramya and Yu, Samson and Islam, Shama and Trinh, Hieu , address =. Assessing. 2025. 2025 , isbn =. doi:10.1109/ETFG61999.2025.11401278 , url =
-
[42]
2024 , url =
Transmission. 2024 , url =
2024
-
[43]
Movahednia, Mohadese and Kargarian, Amin and Ozdemir, Celalettin E. and Hagen, Scott C. , shorttitle =. Power. 2022 , issn =. doi:10.1109/TII.2021.3100079 , journal =
-
[44]
Mujjuni, Francis and Betts, Thomas R. and Blanchard, Richard E. , shorttitle =. Evaluation of. 2023 , issn =. doi:10.1109/ACCESS.2023.3304643 , journal =
-
[45]
A multi-hazard approach to assess severe weather-induced major power outage risks in the. 2018 , issn =. doi:10.1016/j.ress.2018.03.015 , journal =
-
[46]
Quantifying the daily economic impact of extreme space weather due to failure in electricity transmission infrastructure , volume =. 2017 , issn =. doi:10.1002/2016SW001491 , journal =
-
[47]
and Hapgood, Mike and Richardson, Gemma S
Oughton, Edward J. and Hapgood, Mike and Richardson, Gemma S. and Beggan, Ciarán D. and Thomson, Alan W. P. and Gibbs, Mark and Burnett, Catherine and Gaunt, C. Trevor and Trichas, Markos and Dada, Rabia and Horne, Richard B. , shorttitle =. A. 2019 , issn =. doi:10.1111/risa.13229 , journal =
-
[48]
Multi-dimensional hurricane resilience assessment of electric power systems , volume =. 2014 , issn =. doi:10.1016/j.strusafe.2014.01.001 , journal =
-
[49]
Metrics and. 2017 , issn =. doi:10.1109/TPWRS.2017.2664141 , journal =
-
[50]
Panteli, Mathaios and Pickering, Cassandra and Wilkinson, Sean and Dawson, Richard and Mancarella, Pierluigi , shorttitle =. Power. 2017 , issn =. doi:10.1109/TPWRS.2016.2641463 , journal =
-
[51]
doi:10.5194/egusphere-egu2020-19097 , url =
Towards an Integrated Framework for Distributed, Modular Multi-risk Scenario Assessment , year =. doi:10.5194/egusphere-egu2020-19097 , url =
-
[52]
High-resolution, open-source modeling of inland flooding impacts on the. 2024 , issn =. doi:10.1088/2753-3751/ad3558 , journal =
-
[53]
Statistics of extreme geomagnetically induced current events , volume =. 2008 , issn =. doi:10.1029/2008SW000388 , journal =
-
[54]
Multi-hazard system-level logit fragility functions , volume =. 2016 , issn =. doi:10.1016/j.engstruct.2016.05.006 , journal =
-
[55]
2013 , institution =
Aqueduct Water Risk Framework , author =. 2013 , institution =
2013
-
[56]
Impact of. 2024 , issn =. doi:10.3390/atmos15111349 , journal =
-
[57]
Rokhideh, Maryam , shorttitle =. Rethinking. Oxford. 2025 , isbn =. doi:10.1093/acrefore/9780199389407.013.551 , url =
-
[58]
Journal of Structural Engineering , publisher =
Multihazard. Journal of Structural Engineering , publisher =. 2017 , doi =
2017
-
[59]
A probabilistic framework for multi-hazard risk mitigation for electric power transmission systems subjected to seismic and hurricane hazards , volume =. 2018 , issn =. doi:10.1080/15732479.2018.1459741 , journal =
-
[60]
Electrical. 2020 , issn =. doi:10.3390/su12041527 , journal =
-
[61]
doi:10.1016/j.jclepro.2021.128793 , journal =
2021 , issn =. doi:10.1016/j.jclepro.2021.128793 , journal =
-
[62]
A. 2023 , issn =. doi:10.1109/ACCESS.2023.3320579 , journal =
-
[63]
doi:10.48438/JCHS.2023.0022 , journal =
Vulnerability of power distribution utility poles to tsunami bore impacts , year =. doi:10.48438/JCHS.2023.0022 , journal =
-
[64]
Darestani, Yousef M. and Jeddi, Ashkan B. and Shafieezadeh, Abdollah , editor =. Hurricane. Engineering for. 2022 , isbn =. doi:10.1007/978-3-030-85018-0_8 , url =
-
[65]
Assessing the hazard from geomagnetically induced currents to the entire high-voltage power network in. 2014 , issn =. doi:10.1186/1880-5981-66-87 , journal =
-
[66]
Data‐driven spatio‐temporal analysis of wildfire risk to power systems operation , volume =. 2022 , issn =. doi:10.1049/gtd2.12463 , journal =
-
[67]
2020 , url =
National. 2020 , url =
2020
-
[68]
Wildfire and power grid nexus in a changing climate , volume =. 2025 , issn =. doi:10.1038/s44287-025-00150-0 , journal =
-
[69]
Predicting wildfire ignition induced by dynamic conductor swaying under strong winds , volume =. 2023 , issn =. doi:10.1038/s41598-023-30802-w , journal =
-
[70]
Modeling. 2020 , issn =. doi:10.1109/TPWRS.2019.2942279 , journal =
-
[71]
Proposal of. 2026 , issn =. doi:10.1109/ACCESS.2026.3670018 , journal =
-
[72]
Worman, Stacey and Taylor, Susan and Onsager, Terrance and Adkins, Jeffery and Baker, Daniel N. and Forbes, Kevin F. , editor =. Chapter 29 -. Extreme. 2018 , isbn =. doi:10.1016/B978-0-12-812700-1.00029-7 , url =
-
[73]
Impact of transmission tower-line interaction to the bulk power system during hurricane , volume =. 2020 , issn =. doi:10.1016/j.ress.2020.107079 , journal =
-
[74]
Predicting electricity infrastructure induced wildfire risk in. 2022 , issn =. doi:10.1088/1748-9326/ac8d18 , journal =
-
[75]
Zurbuchen, Thomas H. , shorttitle =. How likely is a space weather–induced. 2012 , issn =. doi:10.1029/2012SW000844 , journal =
-
[76]
and Hariri-Ardebili, M
Saouma, Victor E. and Hariri-Ardebili, M. Amin , title =. Aging, Shaking, and Cracking of Infrastructures: From Mechanics to Concrete Dams and Nuclear Structures , editor =. 2021 , pages =
2021
-
[77]
Buildings , year =
Kim, Seokjung and Kim, Jongkwan and Song, Homin and Yoo, Mintaek , title =. Buildings , year =
-
[78]
and Blair, Peter D
Miller, Ronald E. and Blair, Peter D. , address =. Input-. 2009 , doi =
2009
-
[79]
Bor, Dennies K. and Oughton, Edward J. and Weigel, Robert , title =. 2026 , publisher =. doi:10.5281/zenodo.20331026 , url =
discussion (0)
Sign in with ORCID, Apple, or X to comment. Anyone can read and Pith papers without signing in.