REVIEW 4 major objections 4 minor 58 references
Uncovering dynamics between SARS-CoV-2 wastewater concentrations and community infections via Bayesian spatial functional concurrent regression
T0 review · 4 major / 4 minor · reviewed 2026-08-11 · deepseek-v4-flash
Pith's one-line read Wastewater SARS-CoV-2 levels in Houston lead reported COVID-19 positivity rates by about a week, and the wastewater–positivity link is stronger between outbreaks than during them.
desk verdict Useful model with plausible lag inference, but the flagship dynamic-association result is not yet supported because the missingness rule censors the low-count regime where that association is claimed. read the letter →
The pith
A machine-rendered reading of the paper's core claim, the machinery that carries it, and where it could break.
The reading
What carries the argument
The central object is a Bayesian functional concurrent regression model, yi(τ)=Xi(τ−Δ)γ(τ)+θi(τ)+ε, in which the predictor curve is the true wastewater curve Xi, the response is the positivity rate curve yi, Δ is a categorical lag parameter over 0–21 days, γ(τ) is a smooth time-varying coefficient, and θi are spatially correlated functional random effects. The true wastewater curve itself is unobserved and reconstructed through functional factor models with a multiplicative gamma process prior, so uncertainty in the weekly measurements is propagated. The machinery that carries the argument is the joint posterior over Δ, γ(·), and the latent curves: it converts the raw, sparse series into smooth curves, shares information across the 28 sewersheds via a conditionally autoregressive prior on extended Hausdorff-distance neighbors, and lets the lag be inferred rather than fixed.
What would settle it
Re-run the analysis on a data window in which low-case-count days were still reported, or on fully observed simulated data with a known lag and the same missingness mask. If the posterior for the lag Δ and the coefficient γ(τ) moves materially, the missingness rule rather than the underlying biology is producing the headline lead-time and state-dependent findings.
Extended reading notes
Core claim
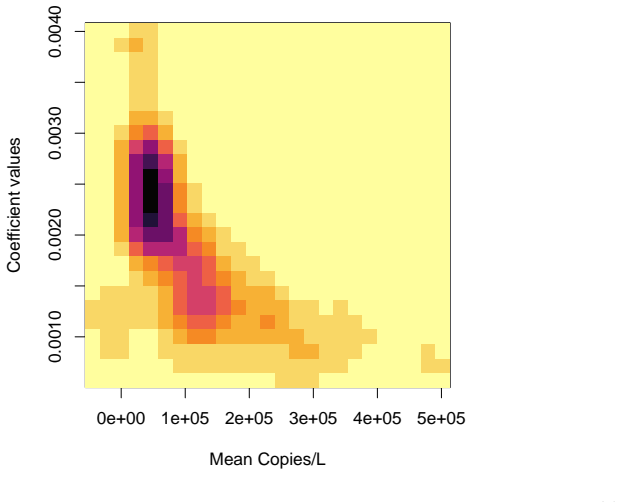
The paper claims that the relationship between SARS-CoV-2 wastewater concentration and reported COVID-19 positivity rate is a time-varying functional coefficient, not a constant link, and that the wastewater signal leads the clinical signal by a lag that can be learned from data. The estimated lag distribution places 95% posterior mass between 5 and 11 days, with mode near 8–9 days. The estimated coefficient function γ(τ) moves inversely with the population wastewater level: in quiet periods an incremental rise in wastewater has a larger association with positivity, while during outbreak waves the coefficient is smaller yet estimated more precisely. The authors argue that this dynamic structure, with full uncertainty propagation through measurement error, missingness, and spatial dependence, is needed to avoid the biases of pre-smoothed or lag-fixed correlation analyses.
Load-bearing premise
The data rule that treats any day with fewer than five positive cases as missing must be innocuous; those days are concentrated exactly in the non-outbreak periods where the model finds the strongest wastewater–positivity association, so if missingness tracks the true case count the estimated lag and the dynamic coefficient could be distorted.
Editorial extensions
If this is right
- A spike in wastewater concentration can be treated as an early warning 5 to 11 days before reported positivity rises, with the most probable lead around 8 to 9 days.
- The association between wastewater and positivity is not a fixed multiplier; it is stronger during non-outbreak periods and weaker, but more precisely estimated, during waves.
- The method yields a full posterior distribution for the lag rather than a single cross-correlation number, so decision makers can use probabilistic statements such as the 95% HPD interval.
- Spatial borrowing of information across sewersheds lets the model estimate positivity curves even where public testing faded to zero.
Reading between the lines
- The same modeling template should transfer to other pathogens and outcomes such as influenza or ICU admissions, where the lead-time question is equally urgent but testing data are even sparser.
- The dynamic coefficient γ(τ) implies that alert thresholds for wastewater should be state-dependent: a small rise during a quiet period is more informative than the same rise during an active wave.
- A direct check of the missingness assumption would be to re-estimate on a period with near-complete testing, or to simulate under an informative missingness mechanism; until then the non-outbreak association estimates carry an unquantified risk.
Signed reviews
Editorial analysis
A structured set of objections, weighed in public.
Referee Report
Summary. The paper proposes a Bayesian spatial functional concurrent regression model to characterize the time-varying association between SARS-CoV-2 wastewater concentrations and reported clinical positivity rates across 28 Houston wastewater treatment plant service areas. The model includes a shared time-lag parameter, a measurement-error model for the wastewater concentrations, functional factor models with multiplicative gamma process priors, and a spatially correlated CAR prior for the functional random effects. The application yields a posterior lag distribution concentrated between 5 and 11 days and an estimated regression coefficient function that is inversely related to the level of wastewater concentration, with stronger associations during non-outbreak periods. The authors argue this provides an early-warning tool with a quantified lead time and shows that the wastewater-positivity relationship is dynamic over the pandemic.
Significance. If the central estimates are reliable, the paper makes a useful contribution to wastewater-based epidemiology by providing a unified Bayesian framework that propagates uncertainty from sparse functional data, measurement error, and an unknown lag. The novelty is moderate: the key modeling components (Bayesian functional factor models, CAR priors, and ultra-efficient MCMC) are adapted from prior work by the same group, but the combination with an unknown lag in a spatial functional concurrent regression is a sensible extension. The paper ships a full Gibbs sampler and demonstrates its application on a real public health dataset. However, the flagship claims—the 5–11 day lead time and the dynamic inverse association—depend on a data-processing rule that censors the response, and the manuscript provides no simulation or sensitivity analysis to establish that the results are not an artifact of that rule.
major comments (4)
- [Section 1.1, Eq. (7)] The missingness rule 'Days with less than five positive cases in a given WWTP area are considered as missing' is a deterministic, outcome-dependent censoring mechanism on the response variable y_i(τ) = p_i(τ)/n_i(τ). Because the model in Eq. (7) assumes independent observation errors and does not model the testing volume or the censoring threshold, the missingness is non-ignorable. Low-count periods, which are precisely the non-outbreak regime where the paper claims the strongest association, are systematically unobserved; the posterior of γ(τ) and Δ is then identified only through temporal smoothing and spatial borrowing rather than through direct response data. The manuscript does not provide any simulation, sensitivity analysis, or posterior predictive check demonstrating that this rule does not bias γ(τ) or the lag estimate. I am not claiming the result is false; I am claiming the central inverse-association finding has not been shown to survive the missingness mechanism that defines the outcome.
- [Section 3, Figure 2] The paper's flagship dynamic-relationship claim is that γ(τ) is large precisely when wastewater levels are low, i.e., during non-outbreak periods. This is also the regime in which positivity rates are most likely to be censored by the <5-case rule. The fitted positivity curves during those periods in Figure 4 are largely imputed from the smoothness prior and the spatial CAR component, so the inverse relationship in Figure 2 may be a consequence of where data are observed rather than a feature of the underlying association. The authors should perform a sensitivity analysis with alternative thresholds (e.g., censoring at <1 or <10 cases), or model the test-count process, to show that the inverse pattern is stable to the censoring rule.
- [Section 2.1.1, Figure 6] The model assumes a single shared lag parameter Δ across all locations and all time periods, yet the abstract's lead-time claim is stated in terms of 'spikes' in wastewater levels versus positivity rates. If the temporal association γ(τ) is in fact dynamic, and if reporting delays or testing practices vary across WWTPs and over the pandemic, a constant lag may be an average that does not characterize any particular spike. At minimum, the paper should test sensitivity to allowing site-specific lags or a time-varying lag, or should justify the common-lag assumption with a model comparison. Without such a check, the 5–11 day HPD interval cannot be interpreted as the lead time for outbreak spikes.
- [Section 3, Section 4] The paper presents a new inferential method but includes no simulation study, no out-of-sample validation, and no posterior predictive checks. The text claims (after Figure 5) that the model 'is able to provide estimates to the sparsely observed regions through the wastewater measurements by borrowing information from nearby service areas,' yet for the 2023 tail, where positivity data 'halting completely,' the imputed positivity curves are entirely unverifiable. A simulation study under realistic missingness patterns, or a holdout prediction exercise (e.g., hiding the last observed positivity values and comparing predictions), is necessary to support both the methodological claims and the applied conclusions about the dynamic association.
minor comments (4)
- [Section 2.1.1 and Supplement Eq. (9)] If Δ takes values 0,...,21, that is 22 possible values, so the uniform prior should be Categorical(1/22), not Categorical(1/21) as written in the supplement; the text also says 'equal probability for each possible lag,' which conflicts with the stated probability.
- [Section 4 and Author Attribution] There are typographical errors: 'postivity' should be 'positivity,' 'drat' should be 'draft,' and 'devleopment' should be 'development.'
- [Eq. (7)] Equation (7) contains a double comma after the covariance matrix: 'N_{m_i^y}(0, σ^2_{\epsilon_y} I_{m_i^y}),,' which should be a single comma.
- [Figure 5 caption] The caption says '95% pointwise credible intervals (dashed lines),' but the text in Section 3 refers to 'shaded regions' for Figure 4 and 5; the presentation is inconsistent and should be clarified.
Circularity Check
No significant circularity: the lag and dynamic association are estimated from the data under a generative model, not derived from their own definitions or from a load-bearing self-citation chain.
full rationale
The paper's central outputs are posterior estimates: the lag parameter Delta and the concurrent coefficient function gamma(tau) both enter the likelihood (Eqs. 1 and 7) as free unknown quantities. Delta is assigned a discrete uniform prior over {0,...,21} and updated via the full conditional in Supplement Eq. 18, so the 5-11 day HPD is not forced by construction. gamma(tau) is a smoothed regression coefficient with a roughness-penalized prior, and the inverse association between wastewater level and the coefficient in Figure 3 is a posterior summary of estimated quantities, not an imposed relation. The model does invoke self-citations for computational machinery (Kowal 2021 for low-rank thin plate spline orthogonalization, Sun and Kowal 2024 for MCMC efficiency, Schedler and Ensor 2021 for Hausdorff-distance spatial weights), but these are independent methodological building blocks and are not used to define, restrict, or 'uniquely' force the lag or the dynamic effect. No fitted parameter is renamed as a prediction, no outcome is defined in terms of the predictor, and no uniqueness claim is imported from the authors' prior work. The data-processing rule in Section 1.1 (days with fewer than five positive cases treated as missing) is a valid concern about non-ignorable missingness and potential bias, but it is an inference-quality issue, not a circular derivation: it does not make the estimated lag or gamma(tau) equal to an input by construction. Because the central derivation is a standard Bayesian estimation from the observed series rather than a reduction to its inputs, no circular step is present.
Assumptions & free parameters
free parameters (3)
- Time lag Δ =
Posterior mode 8-9 days, 95% HPD 5-11 days
- Regression coefficient function γ(τ) =
Time-varying, posterior mean shown in Figure 2
- Number of factors (K, L) and basis dimensions (P, H, J) =
Not specified in main text
assumptions (4)
- domain assumption Positivity rate at time τ depends on wastewater only at time τ-Δ (concurrent regression with a single lag)
- domain assumption Spatial dependence among WWTP random effects is constant over time
- ad hoc to paper Missingness of positivity rates on days with fewer than five positive cases is ignorable in the likelihood
- domain assumption Linear relationship between wastewater concentration and positivity rate at each time
Cite this review
Pith. "Pith review of Uncovering dynamics between SARS-CoV-2 wastewater concentrations and community infections via Bayesian spatial functional concurrent regression." pith.science (2026). https://pith.science/paper/TARYLHUS
@misc{pith2026241202970,
  author       = {Pith},
  title        = {Pith review of: Uncovering dynamics between SARS-CoV-2 wastewater concentrations and community infections via Bayesian spatial functional concurrent regression},
  year         = {2026},
  howpublished = {\url{https://pith.science/paper/TARYLHUS}},
  note         = {Machine review of arXiv:2412.02970}
}
read the original abstract
Monitoring wastewater concentrations of SARS-CoV-2 yields a low-cost, noninvasive method for tracking disease prevalence and provides early warning signs of upcoming outbreaks in the serviced communities. There is tremendous clinical and public health interest in understanding the exact dynamics between wastewater viral loads and infection rates in the population. As both data sources may contain substantial noise and missingness, in addition to spatial and temporal dependencies, properly modeling this relationship must address these numerous complexities simultaneously while providing interpretable and clear insights. We propose a novel Bayesian functional concurrent regression model that accounts for both spatial and temporal correlations while estimating the dynamic effects between wastewater concentrations and positivity rates over time. We explicitly model the time lag between the two series and provide full posterior inference on the possible delay between spikes in wastewater concentrations and subsequent outbreaks. We estimate a time lag likely between 5 to 11 days between spikes in wastewater levels and reported clinical positivity rates. Additionally, we find a dynamic relationship between wastewater concentration levels and the strength of its association with positivity rates that fluctuates between outbreaks and non-outbreaks.
Figures


Figures from the paper (3 more)


Reference graph
Works this paper leans on
-
[1]
Accorsi EK, Qiu X, Rumpler E, Kennedy-Shaffer L, Kahn R, Joshi K, Goldstein E, Stensrud MJ, Niehus R, Cevik M, et al. 2021. How to detect and reduce potential sources of biases in studies of SARS - CoV -2 and COVID -19. European Journal of Epidemiology. 36(2):179--196. [accessed 2024-10-24]. ://link.springer.com/10.1007/s10654-021-00727-7
-
[2]
Acosta N, Bautista MA, Waddell BJ, McCalder J, Beaudet AB, Man L, Pradhan P, Sedaghat N, Papparis C, Bacanu A, et al. 2022. Longitudinal SARS - CoV -2 RNA wastewater monitoring across a range of scales correlates with total and regional COVID -19 burden in a well-defined urban population. Water Research. 220:118611. [accessed 2023-08-18]. ://doi.org/10.10...
arXiv 2022
-
[3]
Bhattacharya A, Dunson DB. 2011. Sparse Bayesian infinite factor models. Biometrika. 98(2):291--306. [accessed 2021-06-11]. ://academic.oup.com/biomet/article-lookup/doi/10.1093/biomet/asr013
-
[4]
Cao Y, Francis R. 2021. On forecasting the community-level COVID -19 cases from the concentration of SARS - CoV -2 in wastewater. Science of The Total Environment. 786:147451. ://www.sciencedirect.com/science/article/pii/S0048969721025225
work page 2021
-
[5]
Cavany S, Bivins A, Wu Z, North D, Bibby K, Perkins TA. 2022. Inferring SARS - CoV -2 RNA shedding into wastewater relative to the time of infection. Epidemiology and Infection. 150:e21. [accessed 2024-03-18]. ://www.cambridge.org/core/product/identifier/S0950268821002752/type/journal\_article
work page 2022
-
[6]
Cederbaum J, Pouplier M, Hoole P, Greven S. 2016. Functional linear mixed models for irregularly or sparsely sampled data. Statistical Modelling. 16(1):67--88. [accessed 2023-05-27]. ://journals.sagepub.com/doi/10.1177/1471082X15617594
-
[7]
Dai X, Acosta N, Lu X, Hubert CRJ, Lee J, Frankowski K, Bautista MA, Waddell BJ, Du K, McCalder J, et al. 2024. A Bayesian framework for modeling COVID ‐19 case numbers through longitudinal monitoring of SARS ‐ CoV ‐2 RNA in wastewater. Statistics in Medicine. 43(6):1153--1169. [accessed 2024-03-17]. ://onlinelibrary.wiley.com/doi/10.1002/sim.10009
-
[8]
Dai X, Champredon D, Fazil A, Mangat CS, Peterson SW, Mejia EM, Lu X, Chekouo T. 2022. Statistical framework to support the epidemiological interpretation of SARS - CoV -2 concentration in municipal wastewater. Scientific Reports. 12(1):13490. [accessed 2024-03-17]. ://www.nature.com/articles/s41598-022-17543-y
work page 2022
Show all 58 references
-
[9]
D'Aoust PM, Towhid ST, Mercier E, Hegazy N, Tian X, Bhatnagar K, Zhang Z, Naughton CC, MacKenzie AE, Graber TE, et al. 2021. COVID -19 wastewater surveillance in rural communities: Comparison of lagoon and pumping station samples. Science of The Total Environment. 801:149618. ...
2021
-
[10]
Ensor KB, Schedler JC, Sun T, Schneider R, Mulenga A, Wu J, Stadler LB, Hopkins L. 2024. Online trend estimation and detection of trend deviations in sub-sewershed time series of SARS - CoV -2 RNA measured in wastewater. Scientific Reports. 14(1):5575. [accessed 2024-03-18]. :...
2024
-
[11]
Fazli M, Sklar S, Porter MD, French BA, Shakeri H. 2021. Wastewater- Based Epidemiological Modeling for Continuous Surveillance of COVID -19 Outbreak . In: 2021 IEEE International Conference on Big Data ( Big Data ); Dec; Orlando, FL, USA. IEEE. p. 4342--4349. [accessed 2023-0...
2021
-
[12]
Fitzgerald SF, Rossi G, Low AS, McAteer SP, O’Keefe B, Findlay D, Cameron GJ, Pollard P, Singleton PTR, Ponton G, et al. 2021. Site Specific Relationships between COVID -19 Cases and SARS - CoV -2 Viral Load in Wastewater Treatment Plant Influent . Environmental Science & Tech...
2021 doi
-
[13]
Galani A, Aalizadeh R, Kostakis M, Markou A, Alygizakis N, Lytras T, Adamopoulos PG, Peccia J, Thompson DC, Kontou A, et al. 2022. SARS - CoV -2 wastewater surveillance data can predict hospitalizations and ICU admissions. Science of The Total Environment. 804:150151. [accesse...
2022
-
[14]
Goldsmith J, Greven S, Crainiceanu C. 2013. Corrected Confidence Bands for Functional Data Using Principal Components . Biometrics. 69(1):41--51. [accessed 2024-02-13]. ://academic.oup.com/biometrics/article/69/1/41-51/7490897
2013
-
[15]
Goldsmith J, Schwartz JE. 2017. Variable selection in the functional linear concurrent model. Statistics in Medicine. 36(14):2237--2250. [accessed 2024-03-05]. ://onlinelibrary.wiley.com/doi/10.1002/sim.7254
2017 doi
-
[16]
Goldsmith J, Zipunnikov V, Schrack J. 2015. Generalized Multilevel Function -on- Scalar Regression and Principal Component Analysis . Biometrics. 71(2):344--353. [accessed 2024-02-19]. ://academic.oup.com/biometrics/article/71/2/344-353/7511367
2015
-
[17]
Holm RH, Mukherjee A, Rai JP, Yeager RA, Talley D, Rai SN, Bhatnagar A, Smith T. 2022. SARS - CoV -2 RNA abundance in wastewater as a function of distinct urban sewershed size. Environmental Science: Water Research & Technology. 8(4):807--819. Publisher: The Royal Society of C...
2022 doi
-
[18]
Hopkins L, Persse D, Caton K, Ensor K, Schneider R, McCall C, Stadler LB. 2023. Citywide wastewater SARS - CoV -2 levels strongly correlated with multiple disease surveillance indicators and outcomes over three COVID -19 waves. Science of The Total Environment. 855:158967. [ac...
2023
-
[19]
James GM, Hastie TJ, Sugar CA. 2000. Principal component models for sparse functional data. Biometrika. 87(3):587--602. [accessed 2023-11-03]. ://academic.oup.com/biomet/article-lookup/doi/10.1093/biomet/87.3.587
2000 doi
-
[20]
Jeng HA, Singh R, Diawara N, Curtis K, Gonzalez R, Welch N, Jackson C, Jurgens D, Adikari S. 2023. Application of wastewater-based surveillance and copula time-series model for COVID -19 forecasts. Science of The Total Environment. 885:163655. [accessed 2023-09-11]. ://linking...
2023
-
[21]
Kaplan EH, Wang D, Wang M, Malik AA, Zulli A, Peccia J. 2021. Aligning SARS - CoV -2 indicators via an epidemic model: application to hospital admissions and RNA detection in sewage sludge. Health Care Management Science. 24(2):320--329. ://doi.org/10.1007/s10729-020-09525-1
2021 doi
-
[22]
Kaya D, Falender R, Radniecki T, Geniza M, Cieslak P, Kelly C, Lininger N, Sutton M. 2022. Correlation between Clinical and Wastewater SARS - CoV -2 Genomic Surveillance , Oregon , USA . Emerging Infectious Diseases. 28(9):1906--1908. [accessed 2023-08-18]. ://doi.org/10.3201/...
2022
-
[23]
Kowal DR. 2021. Dynamic Regression Models for Time - Ordered Functional Data . Bayesian Analysis. 16(2). [accessed 2023-11-03]. ://projecteuclid.org/journals/bayesian-analysis/volume-16/issue-2/Dynamic-Regression-Models-for-Time-Ordered-Functional-Data/10.1214/20-BA1213.full
2021 doi
-
[24]
Kowal DR, Canale A. 2023. Semiparametric Functional Factor Models with Bayesian Rank Selection . Bayesian Analysis. 18(4). [accessed 2024-02-26]. ://projecteuclid.org/journals/bayesian-analysis/volume-18/issue-4/Semiparametric-Functional-Factor-Models-with-Bayesian-Rank-Select...
2023 doi
-
[25]
Lai M, Cao Y, Wulff SS, Robinson TJ, McGuire A, Bisha B. 2023. A time series based machine learning strategy for wastewater-based forecasting and nowcasting of COVID -19 dynamics. Science of The Total Environment. 897:165105. [accessed 2023-09-11]. ://linkinghub.elsevier.com/r...
2023
-
[26]
Leroux A, Xiao L, Crainiceanu C, Checkley W. 2018. Dynamic prediction in functional concurrent regression with an application to child growth. Statistics in Medicine. 37(8):1376--1388. [accessed 2023-11-28]. ://onlinelibrary.wiley.com/doi/10.1002/sim.7582
2018 doi
-
[27]
Li G, Denise H, Diggle P, Grimsley J, Holmes C, James D, Jersakova R, Mole C, Nicholson G, Smith CR, et al. 2023 a . A spatio-temporal framework for modelling wastewater concentration during the COVID -19 pandemic. Environment International. 172:107765. [accessed 2024-03-21]. ...
2023
-
[28]
Li X, Kulandaivelu J, Zhang S, Shi J, Sivakumar M, Mueller J, Luby S, Ahmed W, Coin L, Jiang G. 2021. Data-driven estimation of COVID -19 community prevalence through wastewater-based epidemiology. Science of The Total Environment. 789:147947. ://www.sciencedirect.com/science/...
2021
-
[29]
Li X, Zhang S, Sherchan S, Orive G, Lertxundi U, Haramoto E, Honda R, Kumar M, Arora S, Kitajima M, et al. 2023 b . Correlation between SARS - CoV -2 RNA concentration in wastewater and COVID -19 cases in community: A systematic review and meta-analysis. Journal of Hazardous M...
2023
-
[30]
McMahan CS, Self S, Rennert L, Kalbaugh C, Kriebel D, Graves D, Colby C, Deaver JA, Popat SC, Karanfil T, et al. 2021. COVID -19 wastewater epidemiology: a model to estimate infected populations. The Lancet Planetary Health. 5(12):e874--e881. ://www.sciencedirect.com/science/a...
2021
-
[31]
Min D, Zhilin L, Xiaoyong C. 2007. Extended Hausdorff distance for spatial objects in GIS . International Journal of Geographical Information Science. 21(4):459--475. [accessed 2024-03-24]. ://www.tandfonline.com/doi/abs/10.1080/13658810601073315
2007 doi
-
[32]
Montagna S, Tokdar ST, Neelon B, Dunson DB. 2012. Bayesian Latent Factor Regression for Functional and Longitudinal Data . Biometrics. 68(4):1064--1073. [accessed 2021-06-11]. ://doi.wiley.com/10.1111/j.1541-0420.2012.01788.x
2012
-
[33]
Morvan M, Jacomo AL, Souque C, Wade MJ, Hoffmann T, Pouwels K, Lilley C, Singer AC, Porter J, Evens NP, et al. 2022. An analysis of 45 large-scale wastewater sites in England to estimate SARS - CoV -2 community prevalence. Nature Communications. 13(1):4313. ://doi.org/10.1038/...
2022 doi
-
[34]
Olesen SW, Imakaev M, Duvallet C. 2021. Making waves: Defining the lead time of wastewater-based epidemiology for COVID -19. Water Research. 202:117433. [accessed 2024-03-18]. ://linkinghub.elsevier.com/retrieve/pii/S004313542100631X
2021
-
[35]
Peccia J, Zulli A, Brackney DE, Grubaugh ND, Kaplan EH, Casanovas-Massana A, Ko AI, Malik AA, Wang D, Wang M, et al. 2020 a . Measurement of SARS - CoV -2 RNA in wastewater tracks community infection dynamics. Nature Biotechnology. 38(10):1164--1167. [accessed 2023-08-18]. ://...
2020 doi
-
[36]
Peccia J, Zulli A, Brackney DE, Grubaugh ND, Kaplan EH, Casanovas-Massana A, Ko AI, Malik AA, Wang D, Wang M, et al. 2020 b . SARS - CoV -2 RNA concentrations in primary municipal sewage sludge as a leading indicator of COVID -19 outbreak dynamics. medRxiv:2020.05.19.20105999....
2020 doi
-
[37]
Peng J, Paul D. 2009. A Geometric Approach to Maximum Likelihood Estimation of the Functional Principal Components From Sparse Longitudinal Data . Journal of Computational and Graphical Statistics. 18(4):995--1015. [accessed 2024-02-13]. ://www.tandfonline.com/doi/abs/10.1198/...
2009 arXiv
-
[38]
Schedler JC, Ensor KB. 2021. A spatiotemporal case‐crossover model of asthma exacerbation in the City of Houston . Stat. 10(1):e357. [accessed 2023-11-28]. ://onlinelibrary.wiley.com/doi/10.1002/sta4.357
2021 doi
-
[39]
S entürk D, Müller HG. 2010. Functional Varying Coefficient Models for Longitudinal Data . Journal of the American Statistical Association. 105(491):1256--1264. [accessed 2024-03-23]. ://www.tandfonline.com/doi/full/10.1198/jasa.2010.tm09228
2010 doi
-
[40]
Shi M, Weiss RE, Taylor JMG. 1996. An Analysis of Paediatric CD4 Counts for Acquired Immune Deficiency Syndrome Using Flexible Random Curves . Applied Statistics. 45(2):151. [accessed 2024-02-13]. ://www.jstor.org/stable/2986151?origin=crossref
1996
-
[41]
Stadler L, Ensor K, Clark J, Kalvapalle P, LaTurner ZW, Mojica L, Terwilliger A, Zhuo Y, Ali P, Avadhanula V, et al. 2020. Wastewater Analysis of SARS - CoV -2 as a Predictive Metric of Positivity Rate for a Major Metropolis . Epidemiology. preprint. [accessed 2023-08-18]. ://...
2020 doi
-
[42]
Suarez AJ, Ghosal S. 2017. Bayesian Estimation of Principal Components for Functional Data . Bayesian Analysis. 12(2). [accessed 2024-02-22]. ://projecteuclid.org/journals/bayesian-analysis/volume-12/issue-2/Bayesian-Estimation-of-Principal-Components-for-Functional-Data/10.12...
2017 doi
-
[43]
Sun TY, Kowal DR. 2024. Ultra- Efficient MCMC for Bayesian Longitudinal Functional Data Analysis . Journal of Computational and Graphical Statistics:1--13. [accessed 2024-11-23]. ://www.tandfonline.com/doi/full/10.1080/10618600.2024.2362227
2024
-
[44]
Symanski E, Ensor KB, Piedra PA, Sheth K, Caton K, Williams SL, Persse D, Banerjee D, Hopkins L. 2021. Population- Based Estimates of SARS - CoV -2 Seroprevalence in Houston , Texas as of September 2020. The Journal of Infectious Diseases:jiab203. [accessed 2024-10-24]. ://aca...
2021 doi
-
[45]
Torabi F, Li G, Mole C, Nicholson G, Rowlingson B, Smith CR, Jersakova R, Diggle PJ, Blangiardo M. 2023. Wastewater-based surveillance models for COVID -19: A focused review on spatio-temporal models. Heliyon. 9(11):e21734. [accessed 2024-03-21]. ://linkinghub.elsevier.com/ret...
2023
-
[46]
Vallejo JA, Trigo-Tasende N, Rumbo-Feal S, Conde-Pérez K, López-Oriona A, Barbeito I, Vaamonde M, Tarrío-Saavedra J, Reif R, Ladra S, et al. 2022. Modeling the number of people infected with SARS - COV -2 from wastewater viral load in Northwest Spain . Science of The Total Env...
2022
-
[47]
Wand MP, Ormerod JT. 2008. ON SEMIPARAMETRIC REGRESSION WITH O ' SULLIVAN PENALIZED SPLINES . Australian & New Zealand Journal of Statistics. 50(2):179--198. [accessed 2024-02-29]. ://onlinelibrary.wiley.com/doi/10.1111/j.1467-842X.2008.00507.x
2008 arXiv
-
[48]
Wolken M, Sun T, McCall C, Schneider R, Caton K, Hundley C, Hopkins L, Ensor K, Domakonda K, Kalvapalle P, et al. 2023. Wastewater surveillance of SARS - CoV -2 and influenza in preK -12 schools shows school, community, and citywide infections. Water Research. 231:119648. [acc...
2023
-
[49]
Wu F, Xiao A, Zhang J, Moniz K, Endo N, Armas F, Bonneau R, Brown MA, Bushman M, Chai PR, et al. 2022. SARS - CoV -2 RNA concentrations in wastewater foreshadow dynamics and clinical presentation of new COVID -19 cases. Science of The Total Environment. 805:150121. ://www.scie...
2022
-
[50]
Yao F, Müller HG, Wang JL. 2005. Functional Data Analysis for Sparse Longitudinal Data . Journal of the American Statistical Association. 100(470):577--590. [accessed 2023-11-03]. ://www.tandfonline.com/doi/abs/10.1198/016214504000001745
2005 doi
-
[51]
@esa (Ref
\@ifxundefined[1] #1\@undefined \@firstoftwo \@secondoftwo \@ifnum[1] #1 \@firstoftwo \@secondoftwo \@ifx[1] #1 \@firstoftwo \@secondoftwo [2] @ #1 \@temptokena #2 #1 @ \@temptokena \@ifclassloaded agu2001 natbib The agu2001 class already includes natbib coding, so you should ...
-
[52]
\@lbibitem[] @bibitem@first@sw\@secondoftwo \@lbibitem[#1]#2 \@extra@b@citeb \@ifundefined br@#2\@extra@b@citeb \@namedef br@#2 \@nameuse br@#2\@extra@b@citeb \@ifundefined b@#2\@extra@b@citeb @num @parse #2 @tmp #1 NAT@b@open@#2 NAT@b@shut@#2 \@ifnum @merge>\@ne @bibitem@firs...
-
[53]
@open @close @open @close and [1] URL: #1 \@ifundefined chapter * \@mkboth \@ifxundefined @sectionbib * \@mkboth * \@mkboth\@gobbletwo \@ifclassloaded amsart * \@ifclassloaded amsbook * \@ifxundefined @heading @heading NAT@ctr thebibliography [1] @ \@biblabel @NAT@ctr \@bibset...
1997
-
[54]
Gu, and B
Jang, E., S. Gu, and B. Poole (2017, August). Categorical Reparameterization with Gumbel - Softmax . arXiv:1611.01144 [cs, stat]
2017 arXiv
-
[55]
Kowal, D. R. (2021, June). Dynamic Regression Models for Time - Ordered Functional Data . Bayesian Analysis\/ 16\/ (2)
2021
-
[56]
Neal, R. M. (2003, June). Slice sampling. The Annals of Statistics\/ 31\/ (3)
2003
-
[57]
" * write output.state after.block = add.period
ENTRY address archive assignee author booktitle cartographer chapter collaboration doi edition editor eid howpublished institution inventor journal key lastchecked month note number numpages organization pages publisher school series title type url urldate volume year label ex...
-
[58]
write newline
" write newline "" before.all 'output.state := FUNCTION n.dashify 't := "" t empty not t #1 #1 substring "-" = t #1 #2 substring "--" = not "--" * t #2 global.max substring 't := t #1 #1 substring "-" = "-" * t #2 global.max substring 't := while if t #1 #1 substring * t #2 gl...
Reviewed August 11, 2026 · model on record in the stance chip above.
Discussion (0). Continue with ORCID to comment.