Flexible modeling of bimodal distributions via skewed-t mixtures
Pith reviewed 2026-06-26 16:06 UTC · model grok-4.3
The pith
Mixtures of skewed-t distributions model bimodal skewed heavy-tailed data and confirm bimodality in S&P 500 returns.
A machine-rendered reading of the paper's core claim, the machinery that carries it, and where it could break.
Core claim
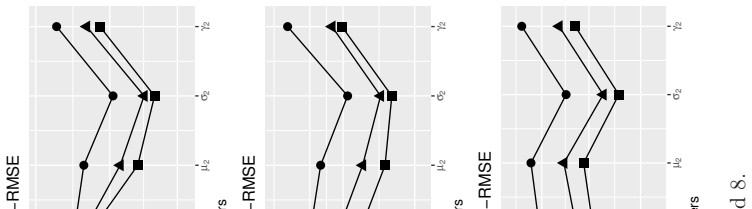
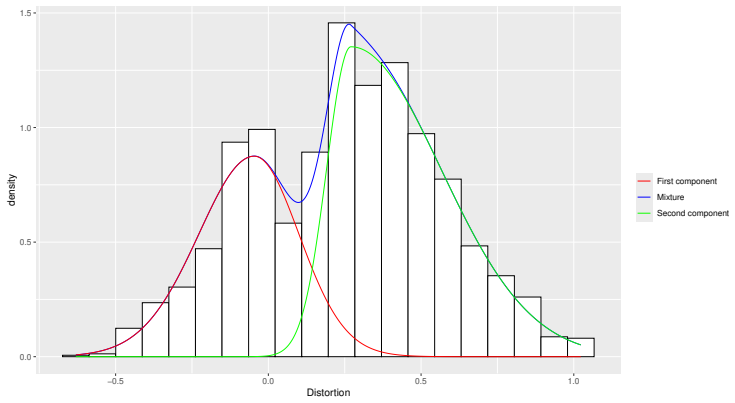
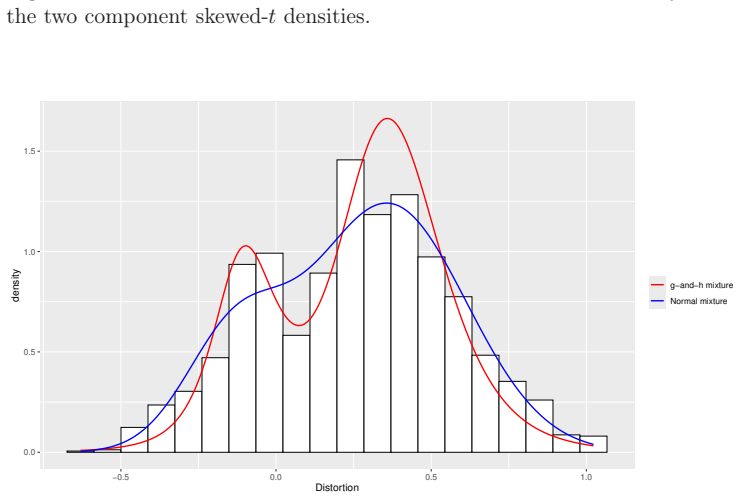
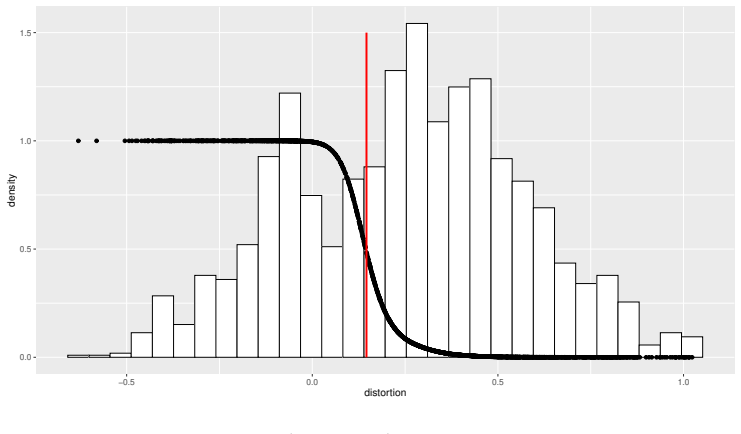
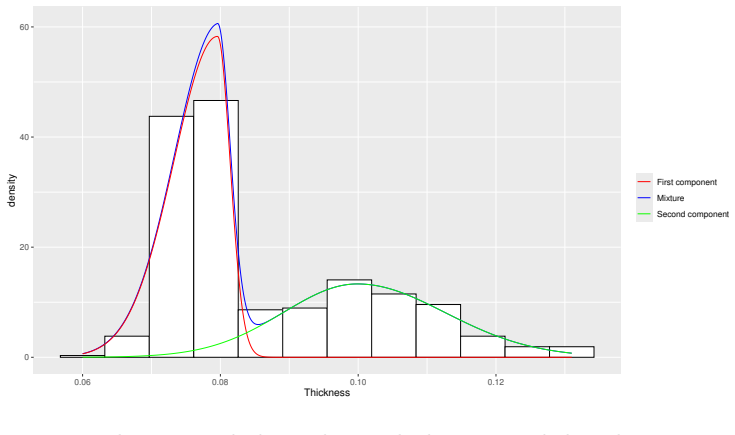
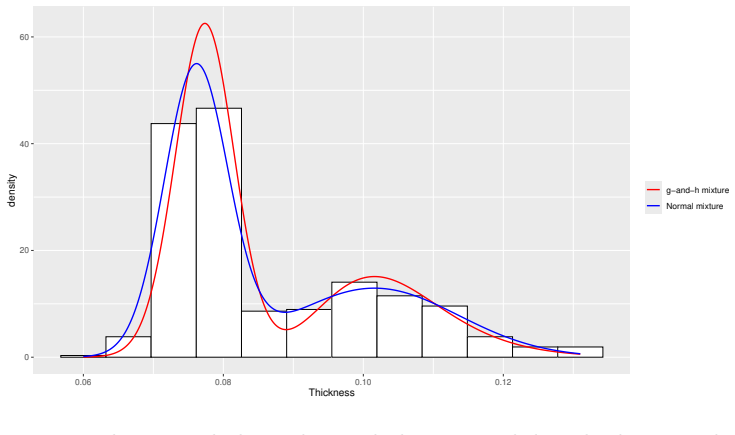
A finite mixture of location-scale skewed-t distributions, with parameters obtained by EM and skewness tested by likelihood ratio, recovers parameters precisely in correctly specified simulations, fits misspecified data better than g-and-h mixtures, and applied to S&P 500 distortion data establishes bimodality indicating the US stock market has historically been in bearish or bullish conditions rather than near its fundamental value.
What carries the argument
Mixture of Fernández-Steel skewed-t distributions estimated by EM algorithm together with a likelihood ratio test for component skewness.
If this is right
- The model can be extended by replacing the skewed-t base distribution with any other symmetric distribution while retaining the same EM estimation and skewness test.
- Parameter estimates remain accurate when the data truly follow the mixture and the model still captures the shape of data generated from a different heavy-tailed bimodal family.
- The likelihood ratio test can be used to decide whether asymmetry is needed in one or both components of the mixture.
- Fitting the mixture to financial returns supplies statistical support for the existence of two market regimes rather than a single central tendency.
Where Pith is reading between the lines
- The same construction could be used to test for regime shifts in other economic series that display apparent bimodality.
- If the two components are interpreted as distinct economic states, the model supplies a parametric way to assign observations to bull or bear periods.
- Stability of the mixture parameters over long samples would justify treating the bear-bull split as a time-invariant feature of the market.
Load-bearing premise
The observed data, including S&P 500 returns, are generated from or closely approximated by a finite mixture of skewed-t components whose parameters remain stable over the sample period.
What would settle it
A Monte Carlo experiment matching the sample size and moments of the S&P 500 series in which the likelihood ratio test for skewness rejects at rates far from the nominal level, or in which the fitted two-component skewed-t mixture collapses to a single mode.
Figures
read the original abstract
We propose a mixture of location-scale skewed-$t$ distributions to fit bimodal, skewed and heavy-tailed data. In particular, the mixture is based on the skewed-$t$ distribution by Fern\'andez and Steel (1998), so that the model-building procedure can be easily extended to mixtures of other symmetric distributions. After studying the properties of the mixture, we develop a maximum likelihood estimation approach via the EM algorithm and a likelihood ratio test of the null hypothesis of no skewness in any given component. A simulation-based comparison to a recently proposed mixture of g-and-h distributions suggests that the performance of the proposed model is excellent, in terms of both estimation precision in well-specified setups and modeling capability in mis-specified frameworks. Fitting the model to the Standard & Poor's 500 distortion allows us to confirm the bimodality of its distribution, with the implication that the US stock market has historically been in bearish or bullish conditions, rather than near its fundamental value.
Editorial analysis
A structured set of objections, weighed in public.
Referee Report
Summary. The paper proposes a finite mixture of location-scale skewed-t distributions (based on the Fernández-Steel 1998 skewed-t) for bimodal, skewed, and heavy-tailed data. It derives properties of the mixture, develops an EM algorithm for maximum likelihood estimation, and introduces a likelihood ratio test for the null of no skewness in any component. Simulations compare the model favorably to a g-and-h mixture in both well-specified and misspecified settings. An application to S&P 500 returns is used to confirm bimodality and interpret the data as arising from distinct bearish/bullish regimes rather than a single central value.
Significance. If the central claims hold, the work supplies a practical, extensible mixture framework that leverages an established skewed-t family and standard EM machinery. The simulation evidence of good estimation precision and robustness to misspecification would strengthen the case for the model as a flexible alternative for such data; the empirical illustration would then provide a concrete demonstration of its ability to recover economically interpretable structure in financial returns.
major comments (2)
- [empirical application] Empirical application: the conclusion that S&P 500 returns exhibit bimodality corresponding to stable bearish/bullish regimes rests on the assumption that the mixture parameters (mixing proportions, component location, scale, skewness, and degrees of freedom) remain constant over the full historical sample. No structural-break diagnostics, rolling-window fits, or checks for time-series dependence are reported, yet financial returns routinely violate stationarity; this directly affects the validity of the fitted model and the LRT for skewness.
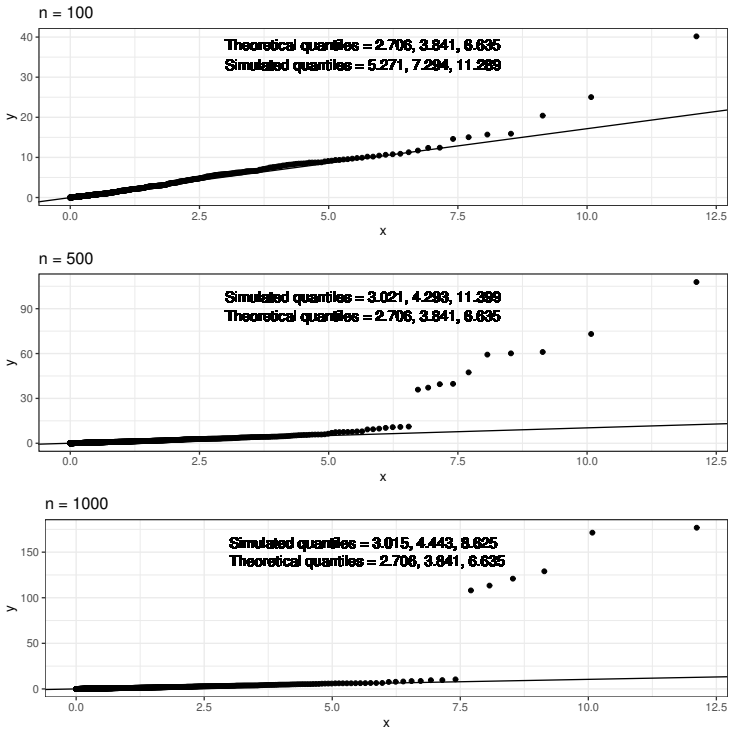
- [likelihood ratio test] Likelihood ratio test section: the LRT for the null of no skewness in any component is presented without finite-sample size or power results under the actual sample size, possible serial dependence, or the mixture setting of the S&P 500 data. Because the test is invoked to support the skewness assessment in the application, its operating characteristics under these conditions are load-bearing for the reported conclusions.
minor comments (1)
- [model definition] Notation for the component-specific parameters (location, scale, skewness, df) should be introduced once with a clear table or list to avoid repeated redefinition across sections.
Simulated Author's Rebuttal
Thank you for the referee's thoughtful comments. We provide point-by-point responses to the major comments below, indicating where revisions will be made.
read point-by-point responses
-
Referee: Empirical application: the conclusion that S&P 500 returns exhibit bimodality corresponding to stable bearish/bullish regimes rests on the assumption that the mixture parameters (mixing proportions, component location, scale, skewness, and degrees of freedom) remain constant over the full historical sample. No structural-break diagnostics, rolling-window fits, or checks for time-series dependence are reported, yet financial returns routinely violate stationarity; this directly affects the validity of the fitted model and the LRT for skewness.
Authors: The model is formulated for i.i.d. data from a mixture distribution, which is appropriate for modeling the unconditional distribution of returns. The application to S&P 500 is an illustration of how the model can identify bimodality, with the two components interpretable as bear and bull regimes. We recognize that assuming constant parameters over the entire period is a simplification and that financial returns may exhibit non-stationarity. In the revision, we will explicitly state the i.i.d. assumption and note that extensions to time-varying mixtures or regime-switching models could address time dependence, while emphasizing that the current work focuses on the cross-sectional mixture properties. revision: partial
-
Referee: Likelihood ratio test section: the LRT for the null of no skewness in any component is presented without finite-sample size or power results under the actual sample size, possible serial dependence, or the mixture setting of the S&P 500 data. Because the test is invoked to support the skewness assessment in the application, its operating characteristics under these conditions are load-bearing for the reported conclusions.
Authors: We derive the LRT under the mixture model framework with the null hypothesis that all components are symmetric (skewness parameter zero). The test statistic's asymptotic distribution accounts for the boundary problem. While the paper includes simulation studies for parameter estimation accuracy, we have not reported dedicated finite-sample simulations for the LRT's size and power specifically under serial correlation or for the S&P 500 sample characteristics. We will revise the manuscript to include a clearer statement on the asymptotic nature of the test and its potential limitations in the presence of dependence, but we maintain that the test provides useful evidence in the application under the model assumptions. revision: partial
Circularity Check
No circularity: model, estimation, and conclusions are independent of self-defined quantities or self-citation chains.
full rationale
The paper defines a mixture of Fernández-Steel (1998) skewed-t components, derives EM-based MLE and an LRT for skewness, runs new simulations comparing to g-and-h mixtures, and fits the model to S&P 500 returns to assess bimodality. None of these steps reduce by the paper's own equations to a fitted parameter defined in terms of itself, nor does any central claim rest on a load-bearing self-citation whose content is unverified. The 1998 reference is external; the simulation design and data application are new and falsifiable against external benchmarks. The derivation chain is therefore self-contained.
Axiom & Free-Parameter Ledger
free parameters (3)
- mixing proportions
- component-specific location, scale, skewness, and degrees of freedom
- number of mixture components
axioms (2)
- domain assumption The observed data are i.i.d. draws from a finite mixture of skewed-t distributions.
- standard math The EM algorithm converges to a local maximum of the observed-data likelihood.
Reference graph
Works this paper leans on
-
[1]
M., and Rodr \' guez-Casal, A
Ameijeiras-Alonso, J., Crujeiras, R. M., and Rodr \' guez-Casal, A. (2019). Mode testing, critical bandwidth and excess mass. TEST , 28(3):900--919
2019
-
[2]
Azzalini, A. (2005). The skew-normal distribution and related multivariate families. Scandinavian Journal of Statistics , 32(2):159--188
2005
-
[3]
Bee, M., Hambuckers, J., and Trapin, L. (2019). Estimating V alue-at- R isk for the g-and-h distribution: an indirect inference approach. Quantitative Finance , 19(8):1255--1266
2019
-
[4]
Bee, M., Hambuckers, J., and Trapin, L. (2021). Estimating large losses in insurance analytics and operational risk using the g-and-h distribution. Quantitative Finance , 21(7):1207--1221
2021
-
[5]
and Faires, J
Burden, R. and Faires, J. (2010). Numerical Analysis . Brooks/Cole, ninth edition
2010
-
[6]
and Steel, M
Fern\'andez, C. and Steel, M. F. J. (1998). On B ayesian modeling of fat tails and skewness. Journal of the American Statistical Association , 93(441):359--371
1998
-
[7]
Flury, B. (1997). A First Course in Multivariate Statistics . Springer
1997
-
[8]
Garcia, R., Renault, E., and Veredas, D. (2011). Estimation of stable distributions by indirect inference. Journal of Econometrics , 161(2):325 -- 337
2011
-
[9]
Hoaglin, D. C. (1985). Summarizing Shape Numerically: The g-and-h Distributions , chapter 11, pages 461--513. Wiley
1985
-
[10]
Izenman, A. J. and Sommer, C. J. (1988). Philatelic mixtures and multimodal densities. Journal of the American Statistical Association , 83(404):941--953
1988
-
[11]
Kim, H.-J. (2008). Moments of truncated S tudent-t distribution. Journal of the Korean Statistical Society , 37(1):81--87
2008
-
[12]
L., Little, R
Lange, K. L., Little, R. J. A., and Taylor, J. M. G. (1989). Robust statistical modeling using the t distribution. Journal of the American Statistical Association , 84(408):881--896
1989
-
[13]
and McLachlan, G
Lee, S. and McLachlan, G. (2013). On mixtures of skew normal and skew t distributions . Advances in Data Analysis and Classification , 7:241--266
2013
-
[14]
and McLachlan, G
Lee, S. and McLachlan, G. (2014). Finite mixtures of multivariate skew t-distributions: some recent and new results. Statistics and Computing , 24:181--202
2014
-
[15]
Lehmann, E. L. and Casella, G. (1998). Theory of Point Estimation . Springer, second edition
1998
-
[16]
Lin, T.-I. (2010). Robust mixture modeling using multivariate skew t distributions. Statistics and Computing , 20:343--356
2010
-
[17]
Lin, T.-I., Lee, J., and Hsieh, W. (2007). Robust mixture modeling using the skew t distribution. Statistics and Computing , 17:81--92
2007
-
[18]
and Krishnan, T
McLachlan, G. and Krishnan, T. (2008). The EM Algorithm and Extensions . Wiley, second edition
2008
-
[19]
and Peel, D
McLachlan, G. and Peel, D. (2000). Finite Mixture Models . Wiley
2000
-
[20]
Pearson, K. (1894). Contribution to the mathematical theory of evolution. Phil. Trans. Roy. Soc. A , 185:71--110
-
[21]
Robertson, C. A. and Fryer, J. G. (1969). Some descriptive properties of normal mixtures. Scandinavian Actuarial Journal , 1969(3-4):137--146
1969
-
[22]
and Westerhoff, F
Schmitt, N. and Westerhoff, F. (2017). On the bimodality of the distribution of the S&P 500's distortion: E mpirical evidence and theoretical explanations. Journal of Economic Dynamics and Control , 80:34--53
2017
-
[23]
Shiller, R. J. (2015). Irrational Exuberance: Revised and Expanded Third Edition . Princeton University Press
2015
-
[24]
Titterington, D., Smith, A., and Makov, U. (1985). Statistical Analysis of Finite Mixture Distributions . Wiley
1985
-
[25]
van Zyl, J. M. (2015). The efficiency of the likelihood ratio to choose between a t-distribution and a normal distribution. arXiv preprint arXiv:1505.01979
Pith/arXiv arXiv 2015
-
[26]
and Ripley, B
Venables, W. and Ripley, B. (2002). Modern Applied Statistics with S . Springer, fourth edition
2002
-
[27]
and Walker, S
Villa, C. and Walker, S. G. (2014). Objective prior for the number of degrees of freedom of a t distribution. Bayesian Analysis , 9(1):197--220
2014
-
[28]
Wu, C. F. J. (1983). On the convergence properties of the EM algorithm. Annals of Statistics , 11(1):95--103
1983
-
[29]
R., Rui, H., and Chervoneva, I
Zhan, T., Misung, Y., Peck, A. R., Rui, H., and Chervoneva, I. (2025). Estimation and model selection for finite mixtures of T ukey's g-&-h distributions. Statistics and Computing , 35:67
2025
discussion (0)
Sign in with ORCID, Apple, or X to comment. Anyone can read and Pith papers without signing in.