REVIEW 4 major objections 5 minor 46 references
Predicting publication productivity for researchers: a piecewise Poisson model
T0 review · 4 major / 5 minor · reviewed 2026-08-14 · deepseek-v4-flash
Pith's one-line read Poisson model forecasts group publication output from paper counts.
desk verdict A simple piecewise Poisson model with a nice empirical motivation, but the validation is undercut by training/test overlap and the distributional fit fails after 2013. read the letter →
The pith
A machine-rendered reading of the paper's core claim, the machinery that carries it, and where it could break.
The reading
What carries the argument
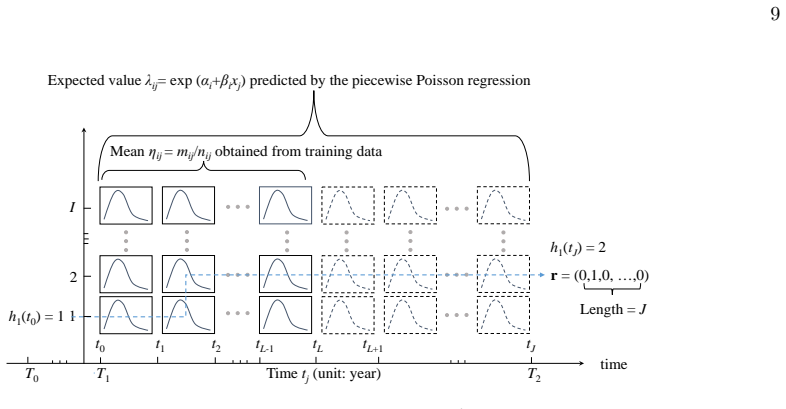
The load-bearing object is the piecewise Poisson model of Eq. (1): a partition of researchers into subsets indexed by their historical publication count $i$, with each subset's publication rate evolving exponentially in calendar time. This partition removes diversity in publishing experience, the Poisson assumption supplies the count-data likelihood, and the log-linear link turns estimation into ordinary linear regression. Prediction then proceeds by drawing a Poisson count for each interval and accumulating it per researcher, so the same mechanism generates individual trajectories and group averages.
What would settle it
Fit Eq. (3) to observed group means through 2009, compute the 95% confidence band for the extrapolated years 2014-2018, and compare the actually observed annual means for each group $i$; if a substantial share of these later means fall outside the band, the log-linear extrapolation is disconfirmed.
Extended reading notes
Core claim
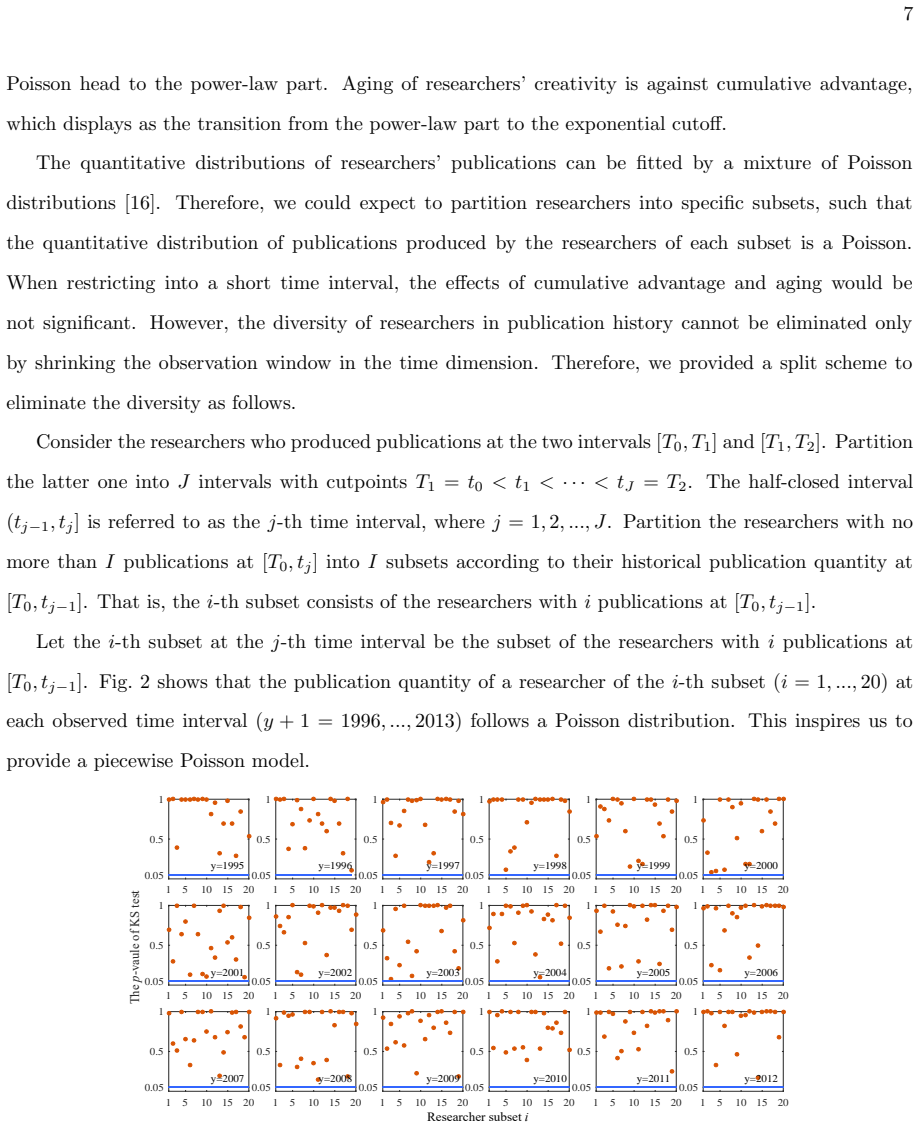
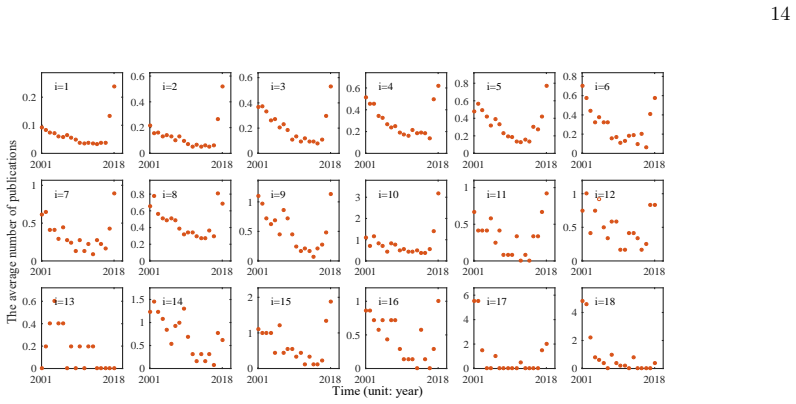
The central discovery is the piecewise Poisson structure of publication counts: for researchers with $i$ publications before time $t_{j-1}$, the number of publications in the interval $(t_{j-1}, t_j]$ follows a Poisson distribution with mean $\lambda_{ij} = \lambda_{i1} e^{\beta_i(t_j - t_1)}$. Taking logs and substituting the observed group productivity $\eta_{ij} = m_{ij}/n_{ij}$ gives the linear regression $\log \eta_{ij} = \alpha_i + \beta_i(t_j - t_1)$, whose fits are significant for $i \le 12$, a range covering 99.5% of the training researchers. The resulting forecasts track observed group means closely, with group-level correlation near 0.98 to 0.99, and reproduce the bulk of the publication-count distribution, though they do not capture the fat upper tail. The paper presents this as evidence that the future of a group of researchers is far from random.
Load-bearing premise
The model assumes that the log of each group's publication rate changes linearly with calendar time, and that the slope fitted on 1995-2009 remains valid through 2018; if the trend changes through funding shocks, career-stage effects, or field growth, every forecast inherits the error.
Editorial extensions
If this is right
- Researchers with the same past publication count form a homogeneous population whose one-period future output follows a Poisson distribution.
- Group publication productivity can be predicted from publication timestamps alone, without author attributes, collaboration networks, or citation data.
- The Poisson regression parameters provide an unbiased quantitative index that funding agencies could apply to large pools of applications.
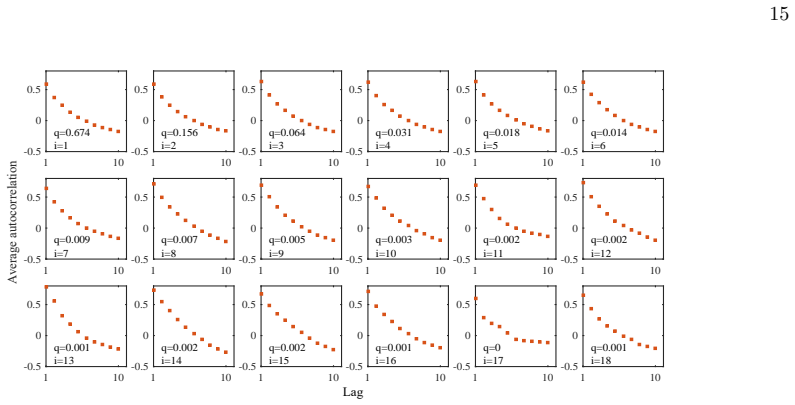
- Individual-level long-range prediction remains out of reach, since autocorrelations of cumulative output are mostly below 0.5; the autoregressive strategies that work for citations and the $h$-index do not transfer to productivity.
- Forecasts are reliable for the majority of researchers, with 98.76% of the test set covered here, but not for the highly prolific tail.
Reading between the lines
- If the slope $\beta_i$ is stable across cohorts, the model could be refit on rolling windows to separate career aging from field-wide growth; systematic slope drift would indicate that a single calendar-time trend is not the whole story.
- The partition-then-Poisson construction could be tried on other fat-tailed count outcomes, such as patents, grants, or software releases, using historical count as the sole grouping variable.
- Checking for overdispersion within each $(i,j)$ subset would test whether the Poisson assumption fully absorbs heterogeneity or whether a negative-binomial extension is needed.
Signed reviews
Editorial analysis
A structured set of objections, weighed in public.
Referee Report
Summary. The paper proposes a piecewise Poisson model for researcher publication productivity. Researchers are partitioned by their cumulative publication count at a fixed time, and within each group the annual publication count is modeled as Poisson with rate lambda_ij = lambda_i1 exp(beta_i (t_j - t1)). The parameters alpha_i = log(lambda_i1) and beta_i are estimated by linear regression on log group-mean counts from the dblp training years 1995-2009, and forecasts are generated by simulating Poisson draws over 2001-2018 (main experiment) or 1996-2013 (Appendix C). Validation consists of group-level and sorted-list correlations of mean cumulative counts and KS tests comparing predicted and observed cumulative publication distributions. The paper also argues against individual-level autoregressive prediction based on autocorrelation coefficients.
Significance. If the model were properly validated, it would provide a simple, interpretable baseline for group-level publication forecasting and an interesting empirical observation that conditioning on past publication count yields approximately Poisson annual counts. The proposed tests are falsifiable, and the use of the large dblp dataset is a strength. However, the current validation design has a training/test temporal overlap, the distributional tests reject the model in out-of-sample years, and Eq. (5) contains an arithmetic error. The central contribution at this stage is the modeling idea, not an established forecasting method.
major comments (4)
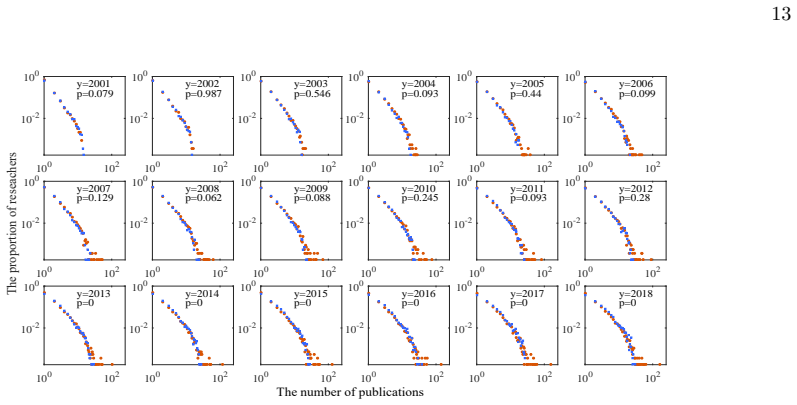
- [Section 6, Table 1, Figs. 5-6 and Appendix C] The evaluation is contaminated by temporal overlap between training and test. The training dataset Set 5 contains all dblp records from 1995 to 2009, while the test researchers in Set 4 are followed from 2001 to 2018 (Set 7). No exclusion of Set 4 researchers from Set 5 is reported, so the 2001-2009 part of the 'prediction' uses the same researchers and the same years that determine alpha_i and beta_i. The same overlap holds in Appendix C, where Set 6 (1996-2013) overlaps the training years 1996-2009. Consequently the early KS p-values in Figs. 6 and 11 are in-sample, and the collapse of p to 0 from 2013 onward in Fig. 6 (and from 2007 onward in Fig. 11) is exactly where the forecast becomes out of sample. The paper therefore does not currently provide a clean out-of-sample test of Eq. (1).
- [Section 6, Eq. (5)] Equation (5) defines the lag-l autocorrelation with the same sum in numerator and denominator; as written, r_l is identically 1 for every l. The denominator should be the full-length sum of squared deviations, such as sum_{t=1}^{T} (y_t - ybar)^2. This makes the reported finding that autocorrelations are 'almost smaller than 0.5' unverifiable from the manuscript and weakens the argument that autoregressive predictors are unsuitable for individual publication counts.
- [Experiments, Figs. 6 and 11, Abstract] The abstract and conclusions state that the model's effectiveness was testified, but the distributional test in Figs. 6 and 11 rejects the predicted cumulative distribution for all out-of-sample years (p = 0 from 2013 in the main experiment and from 2007 in Appendix C). The remaining support rests on the sorted-correlation index s2, which compares sorted lists and can be high even when individual-level calibration is poor; it is not a sufficient substitute for the distributional test. Please either restrict the effectiveness claim to the training-overlap period or provide a properly out-of-sample distributional validation.
- [Algorithm 1] Algorithm 1 draws from Pois(lambda_{h l}) where h is the running cumulative publication count. A test researcher who starts with h <= I1 = 13 can have h exceed I = 40 after simulated publications, but lambda_{h l} is only defined for h <= I. The algorithm does not specify a truncation, censoring, or extrapolation rule for this case, so the simulation step is not fully defined for productive trajectories.
minor comments (5)
- [Comparisons with previous results] The text refers to 'Eq. (5)' when discussing the Simonton formula, but the Simonton formula is numbered Eq. (4); please correct the cross-reference.
- [Figs. 4, 6, 11] Several p-values are reported as exactly 0; these should be reported as p < 0.001 or with the actual numerical value in scientific notation.
- [Table 1] The columns of Table 1 (a through f) are described only in the caption; adding explicit column headers or a legend would improve readability.
- [Figure 9] The y-axis label 'Average autocorrelation' is ambiguous; clarify that the average is taken across researchers for each lag, not across lags.
- [Reproducibility] The manuscript does not state whether the code or the exact data subsets are available; providing these, or at least detailed pseudocode for the simulation and KS testing steps, would strengthen reproducibility.
Circularity Check
Fitted-input validation: the test researchers' 2001–2009 output lies inside the 1995–2009 training set, so the early 'predictions' are in-sample fits; the paper's own KS p-values collapse once the forecast becomes truly out of sample.
-
fitted input called prediction
[Section 6 (Experiments), Table 1 and Figs. 5–6; Appendix C, Figs. 10–11]
"The training dataset consists of the researchers in Set 5 and their historical publication quantity from Set 1, Its parameters are I = 40, J = 23, L = 14, T0 = 1951, T1 = t0 = 1995, tL = 2009, and T2 = tJ = 2018. The test dataset consists of the researchers in Set 4, their historical publication quantity from Set 2, and their annual publication quantity from Set 7. Its parameters are tX = 2000, and tY = 2018."
Set 5 spans 1995–2009 and contains all dblp researchers active in that window; the Set 4 test researchers published in 2000, so they are part of Set 5. Thus their 2001–2009 annual outputs are included in n_ij and m_ij, and hence in eta_ij = m_ij/n_ij, the response variable regressed in Eq. (3) to obtain alpha_i and beta_i. Predicting those same years is therefore an in-sample fit, not an out-of-sample forecast. The paper's own Fig. 6 shows KS p-values > 0.05 through 2012 and p = 0 from 2013–2018; Appendix C (Fig. 11) shows p = 0 from 2008 onward after an overlap through 2009. The reported validation of Eq. (1) over the forecast horizon is thus partly a restatement of fitted rates.
full rationale
The paper's conditional-Poisson partition claim is an empirical finding supported by KS tests on the training data, not a consequence of Eq. (1); Eq. (1) is an explicit log-linear modeling assumption, and the paper's self-citations are background or empirical rather than load-bearing uniqueness imports. The reduction-by-construction found here is the training/test overlap: because the training data are all of dblp 1995–2009 and the test researchers published in 2000, the test researchers' own 2001–2009 publications contribute to the eta_ij values used to fit alpha_i and beta_i. Consequently, the reported 'predictions' for 2001–2009 (and 1996–2009 in Appendix C) are in-sample fitted values, and the figures show the distributional match persists mainly through that overlap and then fails. This makes the headline predictive validation partially circular, although the underlying piecewise-Poisson idea retains independent testable content if a genuinely non-overlapping forecast were evaluated.
Assumptions & free parameters
free parameters (3)
- Group intercept alpha_i = log(lambda_i1) =
Fitted by linear regression for each i; individual values not listed
- Group time slope beta_i =
Fitted by linear regression for each i; individual values not listed
- Model capacity cutoff I1 =
13 in main experiment
assumptions (4)
- domain assumption Annual publication counts within each historical-count group form a Poisson distribution with a single rate
- domain assumption The log group publication rate is linear in calendar time (Eq. 1)
- domain assumption The fitted time trend extrapolates unchanged to the prediction window
- domain assumption dblp's cleaned author identities correspond to distinct researchers
Cite this review
Pith. "Pith review of Predicting publication productivity for researchers: a piecewise Poisson model." pith.science (2026). https://pith.science/paper/TH7TWKUZ
@misc{pith2026190807564,
  author       = {Pith},
  title        = {Pith review of: Predicting publication productivity for researchers: a piecewise Poisson model},
  year         = {2026},
  howpublished = {\url{https://pith.science/paper/TH7TWKUZ}},
  note         = {Machine review of arXiv:1908.07564}
}
read the original abstract
Predicting the scientific productivity of researchers is a basic task for academic administrators and funding agencies. This study provided a model for the publication dynamics of researchers, inspired by the distribution feature of researchers' publications in quantity. It is a piecewise Poisson model, analyzing and predicting the publication productivity of researchers by regression. The principle of the model is built on the explanation for the distribution feature as a result of an inhomogeneous Poisson process that can be approximated as a piecewise Poisson process. The model's principle was validated by the high quality dblp dataset, and its effectiveness was testified in predicting the publication productivity for majority of researchers and the evolutionary trend of their publication productivity. Tests to confirm or disconfirm the model are also proposed. The model has the advantage of providing results in an unbiased way; thus is useful for funding agencies that evaluate a vast number of applications with a quantitative index on publications.
Figures

Figures from the paper (8 more)




Reference graph
Works this paper leans on
-
[1]
Sinatra R, Wang D, Deville P, Song C, Barab´ asi AL (2016) Quantifying the evolution of individual scientific impact. Science, 354(6312), aaf5239
work page 2016
-
[2]
Proc Natl Acad Sci USA 102, 16569-16572
Hirsch JE (2005) An index to quantify an individual’s scientific research output. Proc Natl Acad Sci USA 102, 16569-16572
work page 2005
-
[3]
Schubert A (2007) Successive h-indices. Scientometrics, 70, 201-205
work page 2007
-
[4]
Price DJS (1965) Networks of scientific papers. Science 149(3683): 510-515
work page 1965
-
[5]
J Am Soc Inf Sci, 27(5): 292-306
Price DJS (1976) A general theory of bibliometric and other cumulative advantage process. J Am Soc Inf Sci, 27(5): 292-306. 17
work page 1976
-
[6]
Barab´ asi AL, Albert R (1999) Emergence of scaling in random networks. Science, 286(5439): 509- 512
work page 1999
-
[7]
J R Soc Interface, 11: 20140378
Perc M (2014) The Matthew effect in empirical data. J R Soc Interface, 11: 20140378
work page 2014
-
[8]
Acuna DE, Allesina S, Kording KP (2012) Future impact: Predicting scientific success. Nature, 489(7415), 201
work page 2012
Show all 46 references
-
[9]
Europhys Lett, 105(2), 28002
Newman MEJ (2014) Prediction of highly cited papers. Europhys Lett, 105(2), 28002
2014
-
[10]
Scientometrics 112: 483-507
Xie Z, Xie ZL, Li M, Li JP, Yi DY (2017) Modeling the coevolution between citations and coau- thorship of scientific papers. Scientometrics 112: 483-507
2017
-
[11]
Lehman HC (2017) Age and achievement (Vol. 4970). Princeton University Press
2017
-
[12]
Transinformacao 26: 229-238
Gl¨ anzel W (2014) Analysis of co-authorship patterns at the individual level. Transinformacao 26: 229-238
2014
-
[13]
J Assoc Inf Sci Technol 69(2): 305-317
Xie Z, Ouyang ZZ, Li JP, Dong EM, Yi DY (2018) Modelling transition phenomena of scientific coauthorship networks. J Assoc Inf Sci Technol 69(2): 305-317
2018
-
[14]
Dev Rev, 4(1), 77-111
Simonton DK (1984) Creative productivity and age: A mathematical model based on a two-step cognitive process. Dev Rev, 4(1), 77-111
1984
-
[15]
EPJ Data Science 7: 5
Xie Z, Li M, Li JP, Duan XJ, Ouyang ZZ (2018) Feature analysis of multidisciplinary scientific collaboration patterns based on pnas. EPJ Data Science 7: 5
2018
-
[16]
J Informetr 10: 299-311
Xie Z, Ouyang ZZ, Li JP (2016) A geometric graph model for coauthorship networks. J Informetr 10: 299-311
2016
-
[17]
Dong Y, Johnson RA, Chawla NV (2016) Can scientific impact be predicted? IEEE Transactions on Big Data, 2(1), 18-30
2016
-
[18]
Scientometrics, 96(2), 467-483
Mccarty C, Jawitz JW, Hopkins A, Goldman A (2013) Predicting author h-index using character- istics of the co-author network. Scientometrics, 96(2), 467-483
2013
-
[19]
Plos One, 7(11), 1-5
Mazloumian A (2012) Predicting researchers’ scientific impact. Plos One, 7(11), 1-5. 18
2012
-
[20]
Science, 342(6154), 127-132
Wang D, Song C, Barab´ asi AL (2013) Quantifying long-term scientific impact. Science, 342(6154), 127-132
2013
-
[21]
J Informetr, 10(2), 471-484
Cao X, Chen Y, Liu KR (2016) A data analytic approach to quantifying scientific impact. J Informetr, 10(2), 471-484
2016
-
[22]
Appl Intell, 44(2), 252-268
Pobiedina N, Ichise R (2016) Citation count prediction as a link prediction problem. Appl Intell, 44(2), 252-268
2016
-
[23]
J Informetr, 13(2), 485-499
Abrishami A, Aliakbary S (2019) Predicting citation counts based on deep neural network learning techniques. J Informetr, 13(2), 485-499
2019
-
[24]
J Informetr, 13(1), 32-49
Abramo G, D’Angelo CA, Felici G (2019) Predicting publication long-term impact through a combination of early citations and journal impact factor. J Informetr, 13(1), 32-49
2019
-
[25]
Plos One, 9(11), e112520
Stern DI (2014) High-ranked social science journal articles can be identified from early citation information. Plos One, 9(11), e112520
2014
-
[26]
Scientometrics, 115(3), 1395-1412
Kosteas VD (2018) Predicting long-run citation counts for articles in top economics journals. Scientometrics, 115(3), 1395-1412
2018
-
[27]
Bornmann L, Leydesdorff L, Wang J (2014) How to improve the prediction based on citation impact percentiles for years shortly after the publication date? J Informetr, 8(1), 175-180
2014
-
[28]
Bai XM, Zhang LI, Lee I (2019) Predicting the citations of scholarly paper, J Informetr, 13, 407-418
2019
-
[29]
EPJ Data Science, 3(1), 9
Sarig¨ ol E, Pfitzner R, Scholtes I, Garas A, Schweitzer F (2014) Predicting scientific success based on coauthorship networks. EPJ Data Science, 3(1), 9
2014
-
[30]
Scientometrics, 101(2), 1233-1252
Yu T, Yu G, Li PY, Wang L (2014) Citation impact prediction for scientific papers using stepwise regression analysis. Scientometrics, 101(2), 1233-1252
2014
-
[31]
Scientometrics, 107(3), 1265-1282
Klimek P, Jovanovic AS, Egloff R, Schneider R (2016) Successful fish go with the flow: citation impact prediction based on centrality measures for term-document networks. Scientometrics, 107(3), 1265-1282
2016
-
[32]
Phys Rev E 64(2): 025102
Newman M (2001) Clustering and preferential attachment in growing networks. Phys Rev E 64(2): 025102. 19
2001
-
[33]
Physica A 385(2): 750-764
Tomassini M, Luthi L (2007) Empirical analysis of the evolution of a scientific collaboration net- work. Physica A 385(2): 750-764
2007
-
[34]
BioScience, 63(10), 817-823
Laurance WF, Useche DC, Laurance SG, Bradshaw CJ (2013) Predicting publication success for biologists. BioScience, 63(10), 817-823
2013
-
[35]
Milojevi´ c S(2013) Accuracy of simple, initials-based methods for author name disambiguation, J Informetr 7 767-773
2013
-
[36]
Physica A, 527, 121140
Xie Z (2019) A Bayesian model on the merging errors of coauthorship data. Physica A, 527, 121140
2019
-
[37]
Xie Z (2019) A cooperative game model for the multimodality of coauthorship networks, Sciento- metrics, https://doi.org/10.1007/s11192-019-03183-z
2019 doi
-
[38]
Technometrics 15(4): 791-799
Consul PC, Jain GC (1973) A generalization of the Poisson distribution. Technometrics 15(4): 791-799
1973
-
[39]
J R Stat Soc Ser A-G, 135(3), 370-384
Nelder JA, Wedderburn RW (1972) Generalized linear models. J R Stat Soc Ser A-G, 135(3), 370-384
1972
-
[40]
Hollander M, Wolfe DA (1973) Nonparametric Statistical Methods. Wiley
1973
-
[41]
John Wiley & Sons
Box GE, Jenkins GM, Reinsel GC, Ljung GM (2015) Time series analysis: forecasting and control. John Wiley & Sons
2015
-
[42]
J Roy Stat Soc B Met, 34(2), 187-202
Cox DR (1972) Regression models and life-tables. J Roy Stat Soc B Met, 34(2), 187-202
1972
-
[43]
J Gerontol, 9(4), 465-467
Dennis W (1954) Predicting scientific productivity in later maturity from records of earlier decades. J Gerontol, 9(4), 465-467
1954
-
[44]
Soc Stud Sci 35: 673-702
Lee S, Bozeman B (2005) The impact of research collaboration on scientific productivity. Soc Stud Sci 35: 673-702
2005
-
[45]
Ductor L (2015) Does co-authorship lead to higher academic productivity? Oxford B Econ Stat, 77(3), 385-407
2015
-
[46]
Scientometrics, 111(3), 1839-1850
Qi M, Zeng A, Li M, Fan Y, Di Z (2017) Standing on the shoulders of giants: the effect of outstanding scientists on young collaborators’ careers. Scientometrics, 111(3), 1839-1850. 20 Appendix A: The Poisson model The Poisson model is a generalized linear model of regression an...
2017
Reviewed August 14, 2026 · model on record in the stance chip above.
Discussion (0). Continue with ORCID to comment.