REVIEW 5 major objections 5 minor 12 references
Error Analysis of Approximate Array Multipliers
T0 review · 5 major / 5 minor · reviewed 2026-08-14 · deepseek-v4-flash
Pith's one-line read Approximate-multiplier error tracks the specific input operands, not just the design, across all 20 multiplier variants tested.
desk verdict The qualitative warning is worth hearing, but the paper's own numbers contradict its metric definitions and the 'strong correlation' claim is unquantified — as submitted it is not referee-ready. read the letter →
The pith
A machine-rendered reading of the paper's core claim, the machinery that carries it, and where it could break.
The reading
What carries the argument
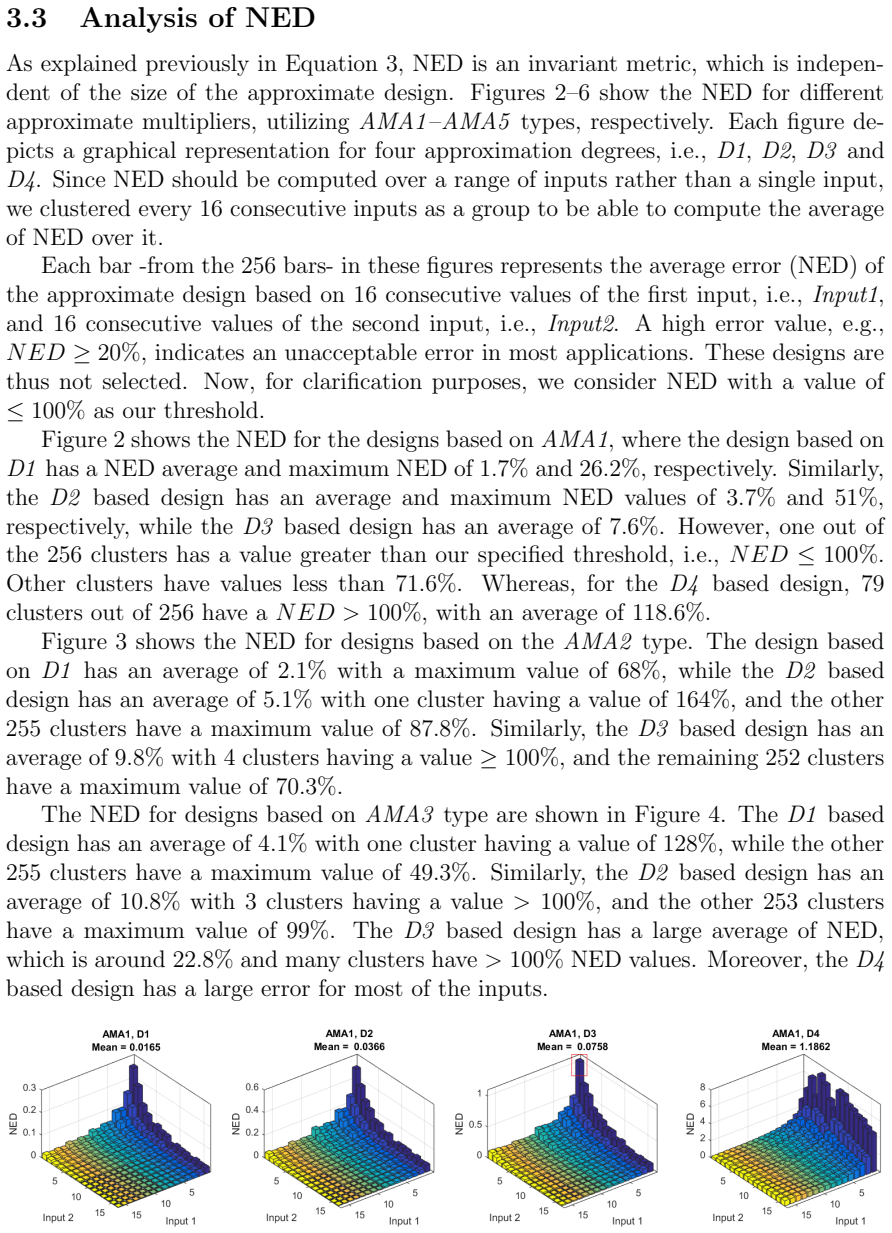
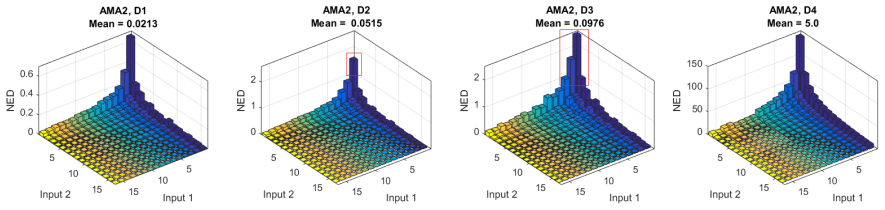
The central object is a library of 20 designs of 8-bit approximate array multipliers built by combining five types of approximate mirror adders (AMA1–AMA5) with four approximation degrees (D1–D4, which approximate 7, 8, 9, or all 16 bits of the product). The analysis machinery is exhaustive simulation of every possible input pair (65,536 pairs per design), together with a binning step that groups 16 consecutive values of each input into clusters so that NED and PSNR can be averaged per cluster. These per-cluster error maps are what display the input-dependence: each bar in the NED and PSNR plots corresponds to one 16-by-16 block of operand values, and the wide spread across bars is the evidence for the paper's claim.
What would settle it
Recompute the NED and PSNR maps for Design1 and Design20 with different cluster sizes, such as blocks of 4 or 8, or blocks shifted by one value, and compare per-cluster maxima; if the number and location of clusters that violate the NED ≤ 100% or PSNR ≥ 25 dB thresholds change substantially, the reported correlation is an artifact of the 16-by-16 binning. Alternatively, list the per-input error distance for every one of the 65,536 input pairs of Design1 and check whether the within-block spread in error distance is comparable to the between-block spread.
Extended reading notes
Core claim
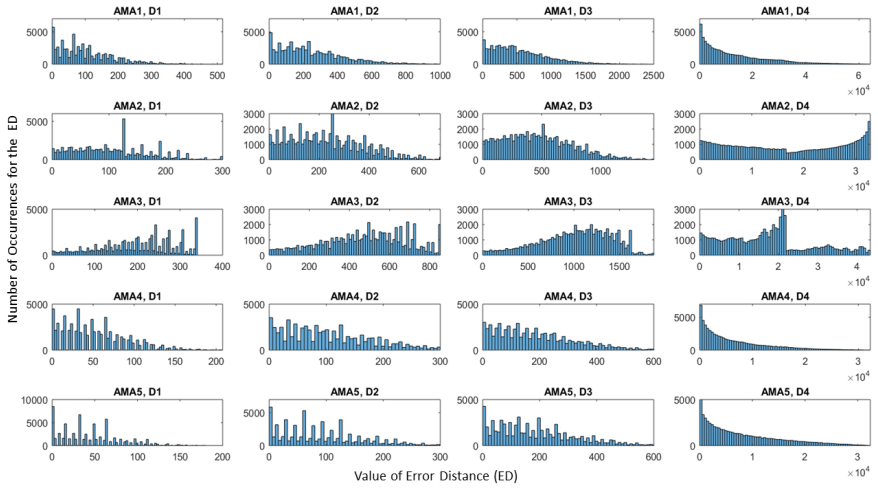
The paper's central claim is that approximation error in an 8-bit approximate array multiplier is strongly correlated with the applied inputs, and that this correlation is visible in every one of the 20 designs examined. Concretely, the error distance for a single design can range from zero to hundreds (Design1 spans 0 to 518 around an average of 102), the normalized error distance averaged over clusters of 16 consecutive input values reaches or exceeds 100% for at least some clusters in many designs, and peak signal-to-noise ratio drops below the 25 dB quality threshold for a non-negligible set of input clusters in every design. The report also observes that error magnitude is governed more by the approximation degree, how many result bits are approximated, than by which approximate full-adder type is used, and that average quality metrics conceal these input-dependent spikes. The intended use of the finding is to enable input-aware quality control: by identifying the operand ranges that produce large errors, one can keep those cases out or route them to a more accurate configuration.
Load-bearing premise
The analysis assumes that grouping every 16 consecutive input values into a cluster faithfully represents how error varies across inputs; if errors change sharply inside a 16-by-16 block, the strong input-dependence shown in the NED and PSNR plots could be a binning artifact rather than a genuine property of the multiplier.
Editorial extensions
If this is right
- Average error metrics such as MED and overall NED underestimate the risk of an approximate multiplier; every design in the library has some input blocks whose NED exceeds 100% or whose PSNR falls below 25 dB.
- The error distance approximately doubles each time the approximation degree is increased, so the degree knob is the dominant lever on error magnitude across all five adder types.
- A user who can identify high-error input ranges in advance can select a different design or a more accurate mode only for those ranges, keeping the cheap approximate design most of the time.
- For D4 designs, where all 16 product bits are approximated, the error is so large that most input clusters are unusable for quality-constrained applications, while D1 designs are usable except for a handful of clusters.
Reading between the lines
- Beyond the report's binning choice, the 16-by-16 clustering may hide sharper per-input spikes: if errors vary within a block, the reported cluster maps could smooth away the very worst individual input pairs, so recomputing with smaller blocks or per-input error distances would show whether the true error surface is even more input-dependent.
- Because the error mechanism is generic to approximate arithmetic, the same input-dependency likely appears in approximate adders, dividers, and tree multipliers, although only array multipliers are tested here.
- The observed structure suggests a testable runtime strategy: a small classifier keyed on the high-order operand bits could predict which of the 20 designs will meet a quality target for a given input pair, and the report's own related work on using PSNR as a quality metric points in this direction, but the present report does not build such a controller.
Signed reviews
Editorial analysis
A structured set of objections, weighed in public.
Referee Report
Summary. The manuscript reports an exhaustive accuracy analysis of 20 8-bit approximate array multipliers built from five approximate full-adder types (AMA1-AMA5) and four approximation degrees (D1-D4). It defines ED, MED, NED, RED, MRED, MSE, and PSNR, presents aggregate metrics in Table 2, and visualizes input-dependent behavior through ED histograms and 256-cluster NED/PSNR surfaces. The central claim is that approximation error correlates strongly with the applied input operands, so average metrics can hide large per-input errors. The paper concludes that input-aware quality control could avoid large-error input regimes.
Significance. The exhaustive enumeration over all 2^16 input pairs for 20 designs is a useful empirical resource, and the observation that error varies by input region is plausible and qualitatively visible in the histograms. If the quantitative metrics were corrected and the correlation claim were backed by a statistical measure, the work could guide adaptive quality control in approximate computing. The paper's value is currently limited by internal inconsistencies in the reported metrics and by the absence of any numerical evidence for the claimed 'strong correlation.'
major comments (5)
- [Section 3.1 / Table 2, Eq. (3)] Equation (3) defines NED = MED/Pmax, with Pmax = 65025 for 8-bit multiplication. For Design1 (AMA1/D1), Table 2 lists MED=102 and NED=0.0165, but 102/65025 is approximately 0.00157, not 0.0165. The same discrepancy appears throughout the table (e.g., Design5: 101/65025 is approximately 0.00155, yet NED is listed as 0.0213; Design17: 44/65025 is approximately 0.00068, yet NED is listed as 0.0069). The NED column must be recomputed from Eq. (3) or the definition must be changed explicitly.
- [Section 3.1 / Table 2, Eq. (7)] Equation (7) gives PSNR = 10*log10(255^2/MSE). For Design1, with MSE=1.69E+04, this yields 10*log10(65025/16900), which is approximately 5.85 dB, not the reported 39.35 dB. For Design5, MSE=1.44E+04 yields approximately 6.55 dB, not 39.97 dB. The PSNR column is therefore not derived from the reported MSE values; either the MSE column is incorrect or an unreported normalization is being used.
- [Section 3.3] The reported per-cluster NED values exceed the maximum possible under Eq. (3). Since the largest possible ED between a 16-bit exact product and a 16-bit approximate output is 65535, any cluster-average NED is at most 65535/65025, which is approximately 1.008 (100.8%). The text reports values of 164% for AMA2/D2, 128% for AMA3/D1, and many clusters above 100% for D3/D4 designs. This is impossible if Eq. (3) is applied, implying that the plotted NED uses a different, unreported normalizing denominator. The NED surfaces in Figures 2-6 therefore cannot be interpreted as NED as defined in Section 3.1.
- [Abstract / Sections 3.2-3.4] The claim of a 'strong correlation' between applied inputs and ED/NED/PSNR is asserted but never quantified. No correlation coefficient, coefficient of determination, or statistical test is reported anywhere; the figures show variation across clusters, but variation alone does not establish correlation, especially when the plotted normalizations are unverified. I request a concrete quantitative measure, such as Pearson or Spearman correlation between input magnitude or input cluster and mean ED/NED, or an R-squared value for cluster means, to support the central claim.
- [Section 3.3] The binning of inputs into blocks of 16 consecutive values is the sole basis for the surfaces in Figures 2-11, yet no sensitivity analysis or formal justification is given. If the error varies sharply within a 16x16 block, the apparent between-cluster structure could be an artifact of the binning rather than a genuine input-dependency. Please report per-input heatmaps or repeat the analysis with at least one alternative cluster size (e.g., 1, 8, 32, 64) to show that the qualitative conclusions are robust.
minor comments (5)
- [Abstract] There is a typo in the abstract: 'peak-to-signal-noise ration' should be 'peak-to-signal-noise ratio.'
- [Section 3.1] Equation (7) uses 255^2 while Eq. (3) uses Pmax=(2^n-1)^2; for 8-bit inputs these coincide (65025), but for general n-bit multipliers the relationship should be clarified.
- [Section 3.3] The threshold language is confusing: the text first says 'NED >= 20% indicates an unacceptable error' and then uses 'NED <= 100% as our threshold.' Please state the intended acceptability criterion consistently.
- [Figures 2-11] The figures need axis labels, legends, and colorbars to be interpretable; as presented, the surfaces are referenced but their scales and axes are not fully described.
- [References] Reference [1] is incomplete: volume, page numbers, and year are missing.
Circularity Check
No significant circularity: this is an empirical accuracy characterization with no fitted parameter renamed as a prediction, and the self-citations are not load-bearing.
full rationale
The report's derivation chain is short and empirical: Section 3.1 defines standard accuracy metrics, Table 2 reports exhaustive simulation over all 2^16 input pairs, and Sections 3.2 through 3.4 bin those simulated errors into 16-by-16 input clusters to display input dependence. No parameter is fitted to a subset of the data and then used to predict a closely related quantity, so there is no fitted-input-called-prediction step. The definitions in Eqs. (1)-(7) do not contain the conclusion; they are independent yardsticks applied to simulated outputs. The self-citations ([7], [11]) supply the multiplier designs and a previously proposed quality-control framing, but neither is used to force or prove the input-dependence result. The numerical inconsistencies flagged in Table 2 are serious correctness concerns: for Design1, Eq. (3) with MED=102 and Pmax=65025 gives NED=0.00157 rather than 0.0165, and Eq. (7) with MSE=1.69E4 gives roughly 5.9 dB rather than 39.35 dB, while Section 3.3 reports cluster NED values above 100 percent even though Eq. (3) bounds average ED/Pmax by 1. The absence of any correlation coefficient or statistical test also means the 'strong correlation' claim is under-supported. However, none of these issues makes the reported result equivalent to the paper's inputs by construction, so they do not constitute circularity.
Assumptions & free parameters
free parameters (3)
- input cluster size =
16
- NED acceptability threshold =
100 percent, with 20 percent cited as high error
- PSNR acceptability threshold =
25 dB
assumptions (4)
- domain assumption The 20 multiplier designs in Table 1 are exactly the circuits described in [7] and constructed from the AMA1-AMA5 full adders of [8].
- domain assumption The error metrics in Equations 1-7 are computed as defined.
- domain assumption Exhaustive simulation over all 2^16 input pairs is sufficient to characterize each design's error distribution.
- ad hoc to paper Clustering inputs into blocks of 16 consecutive values preserves the input-dependency signal.
Cite this review
Pith. "Pith review of Error Analysis of Approximate Array Multipliers." pith.science (2026). https://pith.science/paper/THB4O5FV
@misc{pith2026190801343,
  author       = {Pith},
  title        = {Pith review of: Error Analysis of Approximate Array Multipliers},
  year         = {2026},
  howpublished = {\url{https://pith.science/paper/THB4O5FV}},
  note         = {Machine review of arXiv:1908.01343}
}
read the original abstract
Approximate computing is a nascent energy-efficient computing paradigm suitable for error-tolerant applications. However, the value of approximation error depends on the applied inputs where individual output error may reach intolerable level while the average output error is acceptable. Thus, it is critical to show the response of approximate design for various applied inputs where understanding the interdependence between the inputs and the approximation error could be utilized to control the output quality. In this report, we exhaustively analyze the accuracy of 20 different designs of 8-bit approximate array multipliers. We designed these multipliers based on various configurations including the type of approximable component and how much of the result to approximate, i.e., approximation degree. Accuracy analysis shows a strong correlation between the applied inputs and the magnitude of the observed error, i.e., error distance, normalized error distance and peak-to-signal-noise ratio. We may utilize this input-dependency of approximation error, in controlling the quality of approximate computing by eliminating large magnitude errors and improving the quality of the final results.
Figures
Figures from the paper (8 more)


Reference graph
Works this paper leans on
-
[1]
Intelligent services for big data science,
C. Dobre and F. Xhafa, “Intelligent services for big data science,” Future Gener- ation Computer Systems , vol. 37, pp. 267 – 281
-
[2]
Architectural-space exploration of approximate multipliers,
S. Rehman, W. El-Harouni, M. Shafique, A. Kumar, and J. Henkel, “Architectural-space exploration of approximate multipliers,” in International Conference on Computer-Aided Design . ACM, 2016, pp. 1–8
work page 2016
-
[3]
N. Zhu, W. Goh, W. Zhang, K. Yeo, and Z. H. Kong, “Design of low-power high- speed truncation-error-tolerant adder and its application in digital signal process- ing,” IEEE Transactions on Very Large Scale Integration (VLSI) Systems , vol. 18, no. 8, pp. 1225–1229, 2010
work page 2010
-
[4]
Cade: Configurable approxi- mate divider for energy efficiency,
M. Imani, R. Garcia, A. Huang, and T. Rosing, “Cade: Configurable approxi- mate divider for energy efficiency,” in 2019 Design, Automation Test in Europe Conference Exhibition, 2019, pp. 586–589
work page 2019
-
[5]
Design of power and area efficient approximate multipliers,
S. Venkatachalam and S. B. Ko, “Design of power and area efficient approximate multipliers,” IEEE Transactions on Very Large Scale Integration (VLSI) Systems , vol. 25, no. 5, pp. 1782–1786, 2017
work page 2017
-
[6]
A survey of techniques for approximate computing,
S. Mittal, “A survey of techniques for approximate computing,” vol. 48, no. 4, pp. 1–33, 2016
work page 2016
-
[7]
Comparative study of approximate multi- pliers,
M. Masadeh, O. Hasan, and S. Tahar, “Comparative study of approximate multi- pliers,” in Great Lakes Symposium on VLSI . ACM, 2018, pp. 415–418
work page 2018
-
[8]
Low-power digital signal processing using approximate adders,
V. Gupta, D. Mohapatra, A. Raghunathan, and K. Roy, “Low-power digital signal processing using approximate adders,” IEEE Transactions on Computer-Aided Design of Integrated Circuits and Systems , vol. 32, no. 1, pp. 124–137, 2013
work page 2013
Show all 12 references
-
[9]
Approximate xor/xnor- based adders for inexact computing,
Z. Yang, A. Jain, J. Liang, J. Han, and F. Lombardi, “Approximate xor/xnor- based adders for inexact computing,” in IEEE International Conference on Nan- otechnology (IEEE-NANO), 2013, pp. 690–693
2013
-
[10]
Inexact designs for approx- imate low power addition by cell replacement,
H. A. F. Almurib, T. N. Kumar, and F. Lombardi, “Inexact designs for approx- imate low power addition by cell replacement,” in Design, Automation and Test in Europe, 2016, pp. 660–665
2016
-
[11]
Using machine learning for quality con- figurable approximate computing,
M. Masadeh, O. Hasan, and S. Tahar, “Using machine learning for quality con- figurable approximate computing,” in Design, Automation & Test in Europe . IEEE/ACM, 2019, pp. 1554–1557
2019
-
[12]
Quality of service for video streaming over multi-hop wireless networks: Admission control approach based on analytical capacity estimation,
Y. Xu, J. D. Deng, and M. Nowostawski, “Quality of service for video streaming over multi-hop wireless networks: Admission control approach based on analytical capacity estimation,” in International Conference on Intelligent Sensors, Sensor Networks and Information Processing ...
2013
Reviewed August 14, 2026 · model on record in the stance chip above.
Discussion (0). Continue with ORCID to comment.