REVIEW 4 major objections 6 minor 47 references
SCOTCH III: Complete search for Hypercompact HII regions in the fourth quadrant
T0 review · 4 major / 6 minor · reviewed 2026-08-07 · deepseek-v4-flash
Pith's one-line read The paper reports a complete, methanol-maser-selected search for hypercompact HII regions in the fourth Galactic quadrant, adding 20 new HCHII regions and, with previous SCOTCH papers, tripling the known number of HCHII regions to 33.
desk verdict Solid maser-selected censual survey, but the 'tripling' headline is unsupported by the paper's own numbers and the classification ledger does not close. read the letter →
The pith
A machine-rendered reading of the paper's core claim, the machinery that carries it, and where it could break.
The reading
What carries the argument
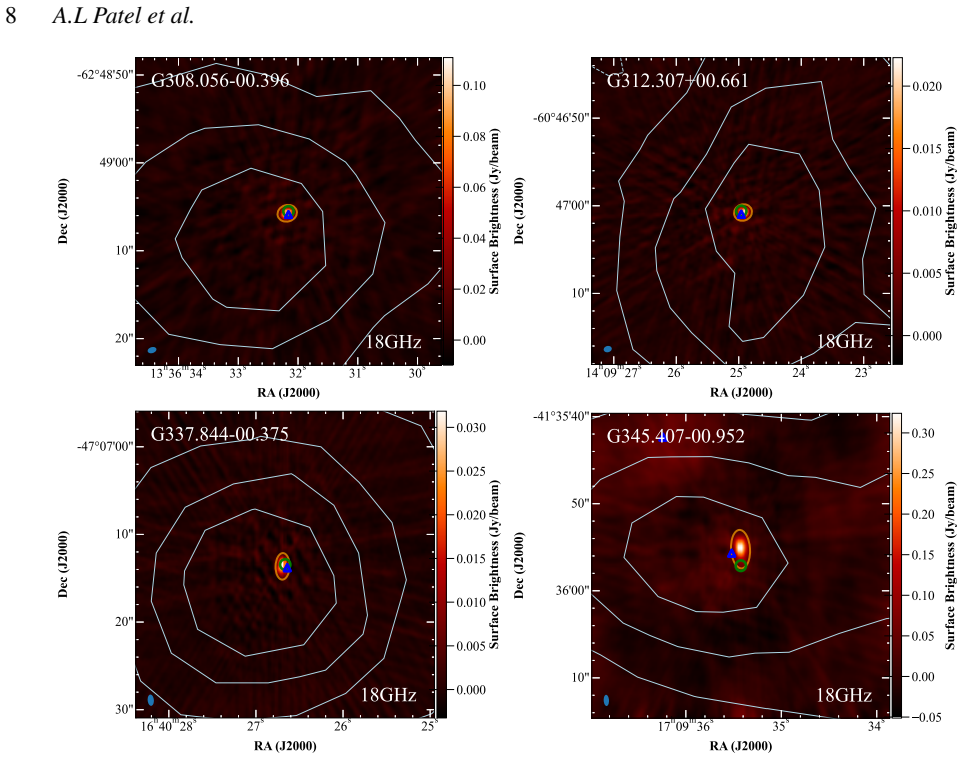
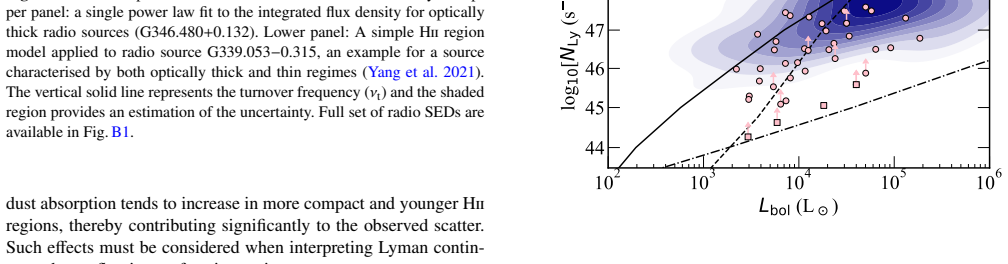
The argument is carried by three mechanisms. First, sample construction: 6.7 GHz methanol masers from the MMB survey are used as signposts of the earliest embedded massive stars, and association with 870-micron ATLASGAL dust clumps ensures the radio sources are embedded in dense natal gas. Second, high-frequency radio continuum observations at 18-24 GHz: at these frequencies the dusty envelope is transparent to free-free emission, whereas HCHII regions are optically thick at 5 GHz, so a positive 5-18 GHz spectral index selects precisely the youngest, densest ionized regions. Third, SED fitting with a uniform-electron-density HII region model (after Mezger & Henderson 1967; coded per Yang et al. 2021): fitting flux densities at 5, 18, and 24 GHz yields electron density, diameter, emission measure, Lyman continuum flux, and turnover frequency, which are then compared with the defining thresholds of HCHII (diameter < 0.05 pc, $n_e > 10^5$ cm$^{-3}$, EM $> 10^8$ pc cm$^{-6}$) to classify each source.
What would settle it
Observing young massive clumps that lack methanol masers, for instance ATLASGAL 870-micron clumps with embedded high-mass YSOs selected by infrared and 5-GHz criteria, at 18-24 GHz and finding a comparable rate of compact, optically thick sources with $n_e > 10^5$ cm$^{-3}$ and sizes below 0.05 pc would falsify the assumption that the maser-selected census is complete. A milder check: imaging the 36 excluded MMB masers without ATLASGAL counterparts at 18-24 GHz would show whether a non-negligible fraction host HCHII regions and thus whether the quoted tripling underestimates the true population.
Extended reading notes
Core claim
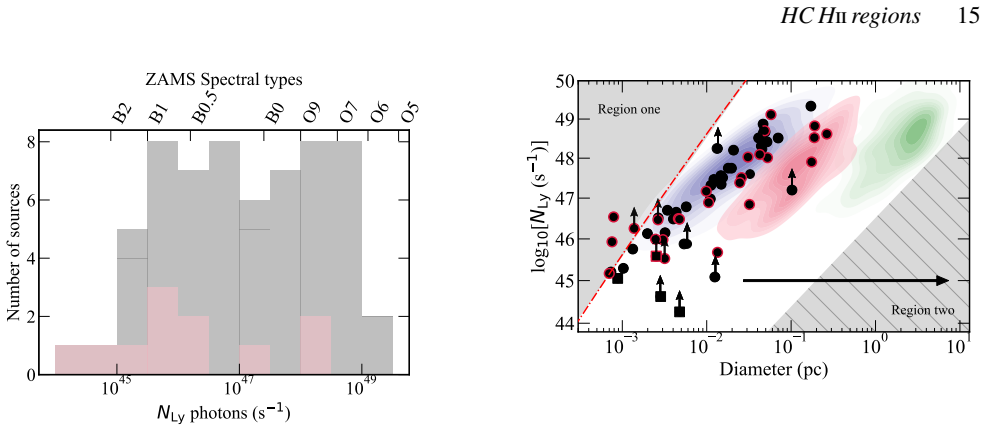
Observing 335 MMB methanol masers between Galactic longitudes 300 and 355 degrees at 18 and 24 GHz with about 20-arcsecond resolution, then following up 42 compact, optically thick candidates at 0.5-arcsecond resolution, yields 35 characterized HII regions in this work: 20 HCHII, 9 intermediate, 3 UCHII, and 3 radio jet candidates. Combined with Papers I and II, the SCOTCH survey has identified 33 HCHII regions, 15 intermediate objects, 9 UCHII regions, and 4 radio jet candidates toward 476 methanol masers, tripling the known HCHII population. Eleven of these sources remain optically thick at 24 GHz and are presented as the youngest, still deeply embedded objects. The paper further claims that these objects fill a continuous band in diameter-electron density space spanning three orders of magnitude, indicating that HII region evolution is a continuous expansion rather than discrete stages, and that the Lyman continuum flux stays roughly constant across that expansion, implying the final stellar mass is set by the HCHII stage.
Load-bearing premise
The whole-census claim rests on the assumption that 6.7 GHz methanol masers with ATLASGAL 870-micron counterparts mark every clump in the fourth quadrant that can host a hypercompact HII region.
Editorial extensions
If this is right
- The known population of hypercompact HII regions grows from roughly 23 to 33, plus 15 intermediate objects, turning a handful of serendipitous discoveries into a sample large enough for statistical study of the earliest ionized phase.
- The survey's detection rate of about 10 per cent of methanol masers implies that roughly 50 further HCHII/intermediate objects could be found by extending the same observations to the remaining unobserved MMB masers, chiefly in the first and second Galactic quadrants.
- The continuous distribution of the combined sample across diameter and electron density supports the view that HII region evolution proceeds by steady expansion rather than by discrete, separable stages.
- The eleven sources that remain optically thick at 24 GHz represent the youngest objects in the sample and are prime targets for radio recombination line and high-frequency continuum follow-up to study the very onset of ionization.
Reading between the lines
- If the completeness assumption holds, the ~10 per cent maser association rate and the scarcity of HCHII regions around O-type stars imply a very short HCHII phase for the most luminous stars, so a full-Galaxy equivalent of this survey would let observers measure the phase lifetime as a function of stellar mass.
- The paper's claim that Lyman flux is set by the HCHII stage predicts that the most compact sources should show broad radio recombination lines tracing infall or outflow, and that their ionizing spectra should match the zero-age main sequence; both are directly testable with ALMA or the ngVLA at sub-arcsecond resolution.
- Because the selection required an ATLASGAL counterpart, the survey may miss HCHII regions whose natal clumps are too faint or too compact for ATLASGAL at 870 microns; a complementary search using dense-gas tracers such as HCN or N$_2$H$^+$ could probe that population and refine the census.
- Methanol masers are known to flicker and disappear as the protostar evolves, so a fraction of the non-detections may be hosts whose maser faded after the HCHII region formed; monitoring these masers over years could reveal how long the maser and the ionized phase overlap.
Editorial analysis
A structured set of objections, weighed in public.
Referee Report
Summary. This paper (SCOTCH III) presents 18/24 GHz ATCA observations toward 335 MMB 6.7 GHz methanol masers in the fourth Galactic quadrant, completing the SCOTCH survey together with Papers I and II. The authors detect 121 discrete radio sources at low resolution, follow up 42 compact/optically-thick candidates at high resolution, construct 5-24 GHz SEDs, and derive physical parameters (diameter, electron density, emission measure, Lyman continuum flux, turnover frequency) using a uniform-density HII model or power-law fits. They report identifying 20 HCHII regions, 9 intermediate objects, 3 UCHII regions, and 3 radio jet candidates in this paper, and 33 HCHII regions, 15 intermediate, 9 UCHII, and 4 jets in the combined SCOTCH sample, which they describe as 'tripling the known number of HCHII regions.' The paper argues for a continuous evolutionary sequence from hypercompact to compact HII regions and that the survey is a complete, methanol-maser-selected census of the youngest HII regions in the fourth quadrant.
Significance. If the central claims are supportable, this survey would be valuable: it is one of the few systematic searches for HCHII regions selected by an early-stage tracer (methanol masers) rather than serendipitous radio detections, and it would roughly triple the sample of known HCHII regions, enabling population-level studies of the earliest observable ionized phase of massive star formation. The paper has clear strengths: standard, reproducible radio data reduction and IMFIT-based flux measurement; explicit tables of fluxes and derived parameters; quantitative KS tests comparing the two SCOTCH subsamples; and a concrete statement of survey completeness limits (MMB+ATLASGAL selection, excluded regions). However, the central quantitative claims of sample size and 'tripling' are not internally consistent across the abstract, Section 4.3, Section 4.4, and Table 8, and the 'complete search' framing depends on the unsupported assumption that methanol masers with ATLASGAL counterparts trace all fourth-quadrant HCHII-hosting clumps. The individual detections and the comparison analysis are likely salvageable, but the headline claims need repair before the paper can be accepted.
major comments (4)
- [Abstract and Section 4.4] The 'tripling' claim is not recoverable from the paper's own numbers. Section 1 states the previously known HCHII population is 23 (Yang et al. 2019, 2021). If the combined SCOTCH count of 33 HCHII regions in Section 4.4 is a cumulative discovery count, the increase is a factor of 1.43, not 3. If 33 is meant to be the post-SCOTCH total, then only 10 HCHII regions are new (a 43% increase), which contradicts the abstract's 'identified 33 HCHII regions' and 'tripling.' In addition, Section 4.3 reports 20 sources satisfying the HCHII criteria plus 3 near-threshold sources 'considered to also be confirmed as HC HII regions,' giving 23 new HCHII regions from this paper, while the abstract reports 20 for this work. These inconsistencies must be resolved with a single explicit accounting that traces each source from Table 8 to the final classification ledger and states precisely how many new HCHII regions this work and Papers I/II add relative to the 23 literature objects.
- [Section 4.3 / Table 8] The classification ledger in Table 8 cannot be reconciled with the abstract's breakdown. A count of Table 8 rows yields 20 HCHII, 10 Transition, and 5 UCHII, but the abstract claims 20 HCHII, 9 intermediate, 3 UCHII, and 3 radio jet candidates, and no explicit jet column appears in Table 8. The Section 4.3 text says the remaining two optically thick sources with low electron densities have 'not certain' nature, and it does not state where the three radio jet candidates are placed in the Table 8 classification. The mapping between the text's classification criteria and the 'type' column of Table 8 must be documented (including which sources are jets, which near-threshold sources are counted as HCHII, and what happens to the two uncertain optically-thick sources).
- [Section 2.2 and Section 5] The 'complete search' claim is narrower than stated. Section 2.2 excludes 36 MMB masers without ATLASGAL counterparts and the Galactic centre region 355-5 degrees, and Section 5 notes 498 masers remain unobserved at high frequencies in other quadrants. The abstract says the observations 'complete the search for hypercompact HII regions' in the fourth quadrant, but the completeness is only with respect to MMB masers that have ATLASGAL counterparts. The paper should openly restate the selection function in the abstract/conclusions, since the unbiasedness of the census and hence the 'factor of three' sample-growth argument depend on the assumption that every young massive clump in the fourth quadrant capable of hosting an HCHII region is marked by a 6.7 GHz methanol maser with an ATLASGAL 870-micron counterpart.
- [Section 2.2 / Section 4.2] The 'complete search' title and Sections 4.3-4.5 implicitly treat the 35 sources followed up at high resolution as the complete final sample, but the selection of the 42 follow-up candidates is not fully specified in the text. Section 3.1 says 38 sources with positive 5-18 GHz spectral index plus 5 sources with positive 18-24 GHz index were selected, totalling 43, yet Section 2.2 says 42 compact sources were followed up. The paper should reconcile this number discrepancy and state the exact selection rule (whether the three power-law sources outside 5-GHz coverage were included, and how the 42-or-43 list was finalized).
minor comments (6)
- [Abstract] The sentence 'making them as excellent HCHII region candidates' contains a typo ('as' should be removed).
- [Section 2.1] Table 3 is referenced in Section 2.2 before Table 3 is described; the observational parameters are largely duplicated between Tables 2 and 3, so the paper should clarify which table is the authoritative summary.
- [Section 4.4] The text says Figure 9 presents parameters for '31 of them discussed in this work' but Section 4.2 and Table 8 cover 35 sources; this discrepancy (31 vs 35) needs correction or explanation.
- [Section 4.3] The text cites 'Table 9' for the classification criteria and 'Figure 9' for the parameter distributions, but the table/figure numbering is confusingly similar; consider renumbering to reduce ambiguity.
- [Section 2.3] The sentence 'These maps are imaged using a pixel size of 0.2 arcsec, with 120 pixels along each side, which resulted in a image size of~25x25 arcsec' should read 'an image size.'
- [Section 4.2] The power-law fits for G346.480+0.132 are described as optically thick, but Table 8 labels that source UCHII; the relation between power-law fitting and the final type label should be explained.
Circularity Check
No circularity: the SED fits are classified against external literature thresholds and the source-sample claims are not derived from the fitted quantities by construction.
full rationale
The paper's derivation chain is observational. It targets 6.7 GHz methanol masers, detects radio continuum at 18 and 24 GHz, constructs SEDs between 5 and 24 GHz, and fits either a uniform-density HII region model (Mezger & Henderson 1967; implemented following Yang et al. 2021) or a power law. The fitted free parameters are electron density and diameter; the emission measure, turnover frequency, and Lyman continuum flux are then computed from standard formulae. The HC/UC/intermediate classification is made by comparing these fitted quantities with literature thresholds in Table 9 (e.g., n_e > 1e5 cm^-3 and diameter < 0.05 pc), i.e., an external definition is applied to measured quantities, not a prediction reduced to inputs. The Yang et al. (2021) citation is coauthor work, but the model is a standard textbook expression with independently stated assumptions; no uniqueness theorem or ansatz is imported to force the result. The 'tripling' headline and the sample-composition numbers (abstract vs Sections 4.3/4.4 vs Table 8) show internal arithmetic inconsistencies, and Section 2.2 states a completeness limitation (36 masers without ATLASGAL counterparts and the 355-5 deg Galactic centre region are excluded). These are correctness and scope concerns, not circularity: the individual classifications and derived properties would stand independently of the conflicting totals. No step in the paper equates its output to its input by construction.
Assumptions & free parameters
free parameters (5)
- Uniform-density HII model electron density n_e (per source) =
varies, e.g., 1.19e4 to 82.19e4 cm^-3 for the 35 candidates
- Uniform-density HII model diameter (per source) =
varies, e.g., 0.0007 to 0.1716 pc
- Power-law spectral index for four optically thick sources =
0.38, 0.72, 0.80, 0.97
- Spectral index threshold for optically thick classification =
0.3
- Kinematic distance solution for three clumps =
far distances 9.4, 10.6, 15.2 kpc
assumptions (6)
- standard math A uniform electron density HII region model describes the radio SEDs of these compact sources.
- domain assumption 6.7 GHz methanol masers are reliable signposts of young, embedded high-mass protostars.
- domain assumption The 5 GHz counterparts from CORNISH-South and MAGPIS are unresolved, so peak flux equals integrated flux for spectral index calculations.
- domain assumption Electron temperature Te = 10,000 K for all sources.
- ad hoc to paper MMB sources without ATLASGAL counterparts and the 355-5 degree Galactic centre region do not contain significant numbers of HCHII regions.
- domain assumption Literature kinematic distances from Urquhart et al. (2018, 2022) and the Reid et al. (2016) model are accurate enough for luminosity and Lyman flux estimates.
Cite this review
Pith. "Pith review of SCOTCH III: Complete search for Hypercompact HII regions in the fourth quadrant." pith.science (2026). https://pith.science/paper/TM7WIT7Q
@misc{pith2026250602737,
  author       = {Pith},
  title        = {Pith review of: SCOTCH III: Complete search for Hypercompact HII regions in the fourth quadrant},
  year         = {2026},
  howpublished = {\url{https://pith.science/paper/TM7WIT7Q}},
  note         = {Machine review of arXiv:2506.02737}
}
read the original abstract
We present high-frequency (18-24 GHz) radio continuum observations towards 335 methanol masers, excellent signposts for young, embedded high-mass protostars. These complete the search for hypercompact HII (HCHII) regions towards young high-mass star-forming clumps within the fourth quadrant of the Galactic plane. HCHII regions are the earliest observable signatures of radio continuum emission from high-mass stars ionizing their surroundings, though their rarity and short lifetimes make them challenging to study. We have observed methanol maser sites at 20-arcsec resolution and identified 121 discrete high-frequency radio sources. Of these, 42 compact sources are embedded in dense clumps and coincide with methanol masers, making them as excellent HCHII region candidates. These sources were followed up at higher resolution (0.5-arcsec) for confirmation. We constructed spectral energy distributions across 5-24 GHz to determine their physical properties, fitting either a simple HII region model or a power-law as needed. This analysis identified 20 HCHII regions, 9 intermediate objects, 3 UCHII regions, and 3 radio jet candidates. Combining these results with previous findings, the SCOTCH survey has identified 33 HCHII regions, 15 intermediate objects, 9 UCHII regions, and 4 radio jet candidates, tripling the known number of HCHII regions. Eleven of these sources remain optically thick at 24 GHz. This survey provides a valuable sample of the youngest HII regions and insights into early massive star formation.
Figures


Figures from the paper (11 more)





Reference graph
Works this paper leans on
-
[1]
write newline
" write newline "" before.all 'output.state := FUNCTION fin.entry write newline FUNCTION new.block output.state before.all = 'skip after.block 'output.state := if FUNCTION new.sentence output.state after.block = 'skip output.state before.all = 'skip after.sentence 'output.state := if if FUNCTION not #0 #1 if FUNCTION and 'skip pop #0 if FUNCTION or pop #1...
-
[2]
Anderson L. D., Bania T. M., Balser D. S., Cunningham V., Wenger T. V., Johnstone B. M., Armentrout W. P., 2014, @doi [ ] 10.1088/0067-0049/212/1/1 , https://ui.adsabs.harvard.edu/abs/2014ApJS..212....1A 212, 1
-
[3]
M., eds, Revista Mexicana de Astronomia y Astrofisica Conference Series Vol
Anglada G., 1995, in Lizano S., Torrelles J. M., eds, Revista Mexicana de Astronomia y Astrofisica Conference Series Vol. 1, Revista Mexicana de Astronomia y Astrofisica Conference Series. p. 67
work page 1995
-
[4]
Becker R. H., White R. L., Helfand D. J., Zoonematkermani S., 1994, @doi [ ] 10.1086/191941 , http://adsabs.harvard.edu/abs/1994ApJS...91..347B 91, 347
-
[5]
Breen S. L., Ellingsen S. P., Contreras Y., Green J. A., Caswell J. L., Stevens J. B., Dawson J. R., Voronkov M. A., 2013, @doi [ ] 10.1093/mnras/stt1315 , https://ui.adsabs.harvard.edu/abs/2013MNRAS.435..524B 435, 524
-
[6]
Brown R. L., Lockman F. J., Knapp G. R., 1978, @doi [ ] 10.1146/annurev.aa.16.090178.002305 , https://ui.adsabs.harvard.edu/abs/1978ARA&A..16..445B 16, 445
-
[7]
Brunthaler A., et al., 2021, @doi [ ] 10.1051/0004-6361/202039856 , https://ui.adsabs.harvard.edu/abs/2021A&A...651A..85B 651, A85
-
[8]
Carpenter J. M., Snell R. L., Schloerb F. P., 1990, , http://cdsads.u-strasbg.fr/cgi-bin/nph-bib_query?bibcode=1990ApJ...362..147C&db_key=AST 362, 147
work page 1990
Show all 47 references
-
[11]
P., Xu Y., Ren Z.-Y., Shen Z.-Q., Sobolev A
Chen X., Li J.-J., Zhang B., Ellingsen S. P., Xu Y., Ren Z.-Y., Shen Z.-Q., Sobolev A. M., 2019, @doi [ ] 10.3847/1538-4357/aaf862 , https://ui.adsabs.harvard.edu/abs/2019ApJ...871..198C 871, 198
2019 doi
-
[12]
Churchwell E., 2002, @doi [ ] 10.1146/annurev.astro.40.060401.093845 , http://adsabs.harvard.edu/abs/2002ARA
2002
-
[13]
Comeron F., Torra J., 1996, , https://ui.adsabs.harvard.edu/abs/1996A&A...314..776C 314, 776
1996
-
[15]
H., Helfand D
Giveon U., Becker R. H., Helfand D. J., White R. L., 2005, @doi [ ] 10.1086/430459 , http://cdsads.u-strasbg.fr/cgi-bin/nph-bib_query?bibcode=2005AJ....130..156G&db_key=AST 130, 156
2005 doi
-
[16]
C., 2005, @doi [ ] 10.1086/427470 , https://ui.adsabs.harvard.edu/abs/2005ApJ...621..359G 621, 359
Gonz \'a lez-Avil \'e s M., Lizano S., Raga A. C., 2005, @doi [ ] 10.1086/427470 , https://ui.adsabs.harvard.edu/abs/2005ApJ...621..359G 621, 359
2005 doi
-
[17]
A., et al., 2009, @doi [ ] 10.1111/j.1365-2966.2008.14091.x , http://cdsads.u-strasbg.fr/abs/2009MNRAS.392..783G 392, 783
Green J. A., et al., 2009, @doi [ ] 10.1111/j.1365-2966.2008.14091.x , http://cdsads.u-strasbg.fr/abs/2009MNRAS.392..783G 392, 783
2009
-
[19]
G., Kurtz S
Hoare M. G., Kurtz S. E., Lizano S., Keto E., Hofner P., 2007, Protostars and Planets V, http://adsabs.harvard.edu/abs/2007prpl.conf..181H pp 181--196
2007
-
[20]
Irabor T., et al., 2023, @doi [ ] 10.1093/mnras/stad005 , https://ui.adsabs.harvard.edu/abs/2023MNRAS.520.1073I 520, 1073
2023 doi
-
[21]
E., Hoare M
Kalcheva I. E., Hoare M. G., Urquhart J. S., Kurtz S., Lumsden S. L., Purcell C. R., Zijlstra A. A., 2018, @doi [ ] 10.1051/0004-6361/201832734 , https://ui.adsabs.harvard.edu/abs/2018A&A...615A.103K 615, A103
2018 doi
-
[22]
Khan S., et al., 2024, @doi [ ] 10.1051/0004-6361/202449390 , https://ui.adsabs.harvard.edu/abs/2024A&A...689A..81K 689, A81
2024 doi
-
[23]
Kurtz S., Hofner P., 2005, @doi [ ] 10.1086/431546 , http://adsabs.harvard.edu/abs/2005AJ....130..711K 130, 711
2005 doi
-
[24]
Kurtz S., Churchwell E., Wood D. O. S., 1994, @doi [ ] 10.1086/191952 , http://adsabs.harvard.edu/abs/1994ApJS...91..659K 91, 659
1994 doi
-
[25]
E., Watson A
Kurtz S. E., Watson A. M., Hofner P., Otte B., 1999, @doi [ ] 10.1086/306928 , http://adsabs.harvard.edu/abs/1999ApJ...514..232K 514, 232
1999 doi
-
[26]
J., 2005, @doi [ ] 10.1051/0004-6361:20042386 , http://adsabs.harvard.edu/abs/2005A
Martins F., Schaerer D., Hillier D. J., 2005, @doi [ ] 10.1051/0004-6361:20042386 , http://adsabs.harvard.edu/abs/2005A
2005 doi
-
[27]
G., Henderson A
Mezger P. G., Henderson A. P., 1967, @doi [ ] 10.1086/149030 , https://ui.adsabs.harvard.edu/abs/1967ApJ...147..471M 147, 471
1967 doi
-
[28]
D., Green A
Murphy T., Cohen M., Ekers R. D., Green A. J., Wark R. M., Moss V., 2010, @doi [ ] 10.1111/j.1365-2966.2010.16589.x , http://adsabs.harvard.edu/abs/2010MNRAS.405.1560M 405, 1560
2010
-
[29]
Nguyen H., et al., 2022, @doi [ ] 10.1051/0004-6361/202244115 , https://ui.adsabs.harvard.edu/abs/2022A&A...666A..59N 666, A59
2022 doi
-
[30]
Panagia N., 1973, , http://cdsads.u-strasbg.fr/cgi-bin/nph-bib_query?bibcode=1973AJ.....78..929P&db_key=AST 78, 929
1973
-
[31]
L., et al., 2023, @doi [ ] 10.1093/mnras/stad2143 , https://ui.adsabs.harvard.edu/abs/2023MNRAS.524.4384P 524, 4384
Patel A. L., et al., 2023, @doi [ ] 10.1093/mnras/stad2143 , https://ui.adsabs.harvard.edu/abs/2023MNRAS.524.4384P 524, 4384
2023 doi
-
[32]
L., Urquhart J
Patel A. L., Urquhart J. S., Yang A. Y., Moore T., Thompson M. A., Menten K. M., Csengeri T., 2024, @doi [ ] 10.1093/mnras/stae1910 , https://ui.adsabs.harvard.edu/abs/2024MNRAS.tmp.1866P
2024 doi
-
[33]
R., et al., 2013, @doi [ ] 10.1088/0067-0049/205/1/1 , http://adsabs.harvard.edu/abs/2013ApJS..205....1P 205, 1
Purcell C. R., et al., 2013, @doi [ ] 10.1088/0067-0049/205/1/1 , http://adsabs.harvard.edu/abs/2013ApJS..205....1P 205, 1
2013 doi
-
[34]
Purser S. J. D., et al., 2016, @doi [ ] 10.1093/mnras/stw1027 , http://adsabs.harvard.edu/abs/2016MNRAS.460.1039P 460, 1039
2016 doi
-
[35]
Purser S. J. D., Lumsden S. L., Hoare M. G., Kurtz S., 2021, @doi [ ] 10.1093/mnras/stab747 , https://ui.adsabs.harvard.edu/abs/2021MNRAS.504..338P 504, 338
2021 doi
-
[36]
J., Dame T
Reid M. J., Dame T. M., Menten K. M., Brunthaler A., 2016, @doi [ ] 10.3847/0004-637X/823/2/77 , http://adsabs.harvard.edu/abs/2016ApJ...823...77R 823, 77
2016 doi
-
[37]
M., Codella C., Beltr \'a n M
S \'a nchez-Monge \'A ., L \'o pez-Sepulcre A., Cesaroni R., Walmsley C. M., Codella C., Beltr \'a n M. T., Pestalozzi M., Molinari S., 2013, @doi [ ] 10.1051/0004-6361/201321589 , http://adsabs.harvard.edu/abs/2013A
2013 doi
-
[38]
J., Teuben P
Sault R. J., Teuben P. J., Wright M. C. H., 1995, in Shaw R. A., Payne H. E., Hayes J. J. E., eds, Astronomical Society of the Pacific Conference Series Vol. 77, Astronomical Data Analysis Software and Systems IV. p. 433 ( @eprint arXiv astro-ph/0612759 )
1995 arXiv
-
[39]
Schuller F., et al., 2009, @doi [ ] 10.1051/0004-6361/200811568 , http://adsabs.harvard.edu/abs/2009A
2009 doi
-
[40]
Sewilo M., Watson C., Araya E., Churchwell E., Hofner P., Kurtz S., 2004, @doi [ApJ] 10.1086/423247 , http://adsabs.harvard.edu/abs/2004ApJS..154..553S 154, 553
2004 doi
-
[41]
S., et al., 2013, @doi [ ] 10.1093/mnras/stt1310 , http://adsabs.harvard.edu/abs/2013MNRAS.435..400U 435, 400
Urquhart J. S., et al., 2013, @doi [ ] 10.1093/mnras/stt1310 , http://adsabs.harvard.edu/abs/2013MNRAS.435..400U 435, 400
2013 doi
-
[42]
S., et al., 2014a, @doi [ ] 10.1093/mnras/stu1207 , http://adsabs.harvard.edu/abs/2014MNRAS.443.1555U 443, 1555
Urquhart J. S., et al., 2014a, @doi [ ] 10.1093/mnras/stu1207 , http://adsabs.harvard.edu/abs/2014MNRAS.443.1555U 443, 1555
-
[43]
S., et al., 2014b, @doi [ ] 10.1051/0004-6361/201424126 , http://adsabs.harvard.edu/abs/2014A
Urquhart J. S., et al., 2014b, @doi [ ] 10.1051/0004-6361/201424126 , http://adsabs.harvard.edu/abs/2014A
-
[44]
S., et al., 2018, @doi [ ] 10.1093/mnras/stx2258 , http://adsabs.harvard.edu/abs/2018MNRAS.473.1059U 473, 1059
Urquhart J. S., et al., 2018, @doi [ ] 10.1093/mnras/stx2258 , http://adsabs.harvard.edu/abs/2018MNRAS.473.1059U 473, 1059
2018 doi
-
[45]
S., et al., 2022, @doi [ ] 10.1093/mnras/stab3511 , https://ui.adsabs.harvard.edu/abs/2022MNRAS.510.3389U 510, 3389
Urquhart J. S., et al., 2022, @doi [ ] 10.1093/mnras/stab3511 , https://ui.adsabs.harvard.edu/abs/2022MNRAS.510.3389U 510, 3389
2022 doi
-
[46]
E., et al., 2011, @doi [ ] 10.1111/j.1365-2966.2011.19054.x , http://adsabs.harvard.edu/abs/2011MNRAS.416..832W 416, 832
Wilson W. E., et al., 2011, @doi [ ] 10.1111/j.1365-2966.2011.19054.x , http://adsabs.harvard.edu/abs/2011MNRAS.416..832W 416, 832
2011
-
[47]
L., Rohlfs K., H \"u ttemeister S., 2013, Tools of Radio Astronomy , @doi 10.1007/978-3-642-39950-3
Wilson T. L., Rohlfs K., H \"u ttemeister S., 2013, Tools of Radio Astronomy , @doi 10.1007/978-3-642-39950-3
2013 doi
-
[48]
Wood D. O. S., Churchwell E., 1989a, @doi [ ] 10.1086/191329 , http://cdsads.u-strasbg.fr/cgi-bin/nph-bib_query?bibcode=1989ApJS...69..831W&db_key=AST 69, 831
-
[49]
Wood D. O. S., Churchwell E., 1989b, @doi [ ] 10.1086/167390 , http://cdsads.u-strasbg.fr/cgi-bin/nph-bib_query?bibcode=1989ApJ...340..265W&db_key=AST 340, 265
-
[50]
Y., Thompson M
Yang A. Y., Thompson M. A., Tian W. W., Bihr S., Beuther H., Hindson L., 2019, @doi [ ] 10.1093/mnras/sty2811 , https://ui.adsabs.harvard.edu/abs/2019MNRAS.482.2681Y 482, 2681
2019 doi
-
[51]
Y., et al., 2021, @doi [Astronomy & Astrophysics] 10.1051/0004-6361/202038608 , 645, A110
Yang A. Y., et al., 2021, @doi [Astronomy & Astrophysics] 10.1051/0004-6361/202038608 , 645, A110
2021 doi
Reviewed August 7, 2026 · model on record in the stance chip above.
Discussion (0). Sign in to comment.