REVIEW 3 major objections 5 minor 67 references
Supra-arcade downflows in an extensive fan associated with a giant quiescent solar filament eruption
T0 review · 3 major / 5 minor · reviewed 2026-08-04 · deepseek-v4-flash
Pith's one-line read After a giant quiescent filament eruption, supra-arcade downflows in the resulting fan are at least three times wider than those seen in active-region flares, while moving at the same speeds.
desk verdict A worthwhile, careful study of a rare giant-filament SAD event that convincingly shows unusually wide SADs, though the headline width ratio needs a harder number before it's fully secure. read the letter →
The pith
A machine-rendered reading of the paper's core claim, the machinery that carries it, and where it could break.
The reading
What carries the argument
The central interpretive mechanism is the Rayleigh–Taylor/Richtmyer–Meshkov instability scaling prediction: in a multi-mode unstable interface, the largest unstable wavelength scales with the transverse size of the system, while the velocity of the developing structures does not. The paper uses the fan width as the system size and the measured SAD width as the instability length scale, comparing these across events of different sizes (active-region flares vs. this giant filament eruption). Widths are measured with an empirical standard—a cut line 6 pixels behind the SAD head, with the width taken as the FWHM of the intensity profile—and heights are deprojected to solar-surface coordinates.
What would settle it
Measure the width of SAD A along a cut that passes through its actual widest part (not the 6-pixel standard) and compare it to the largest width in the active-region SAD sample cited in this paper; if the ratio falls below three, the central scaling claim fails. Alternatively, finding a wide fan that hosts only narrow SADs would question the system-size dependence.
Extended reading notes
Core claim
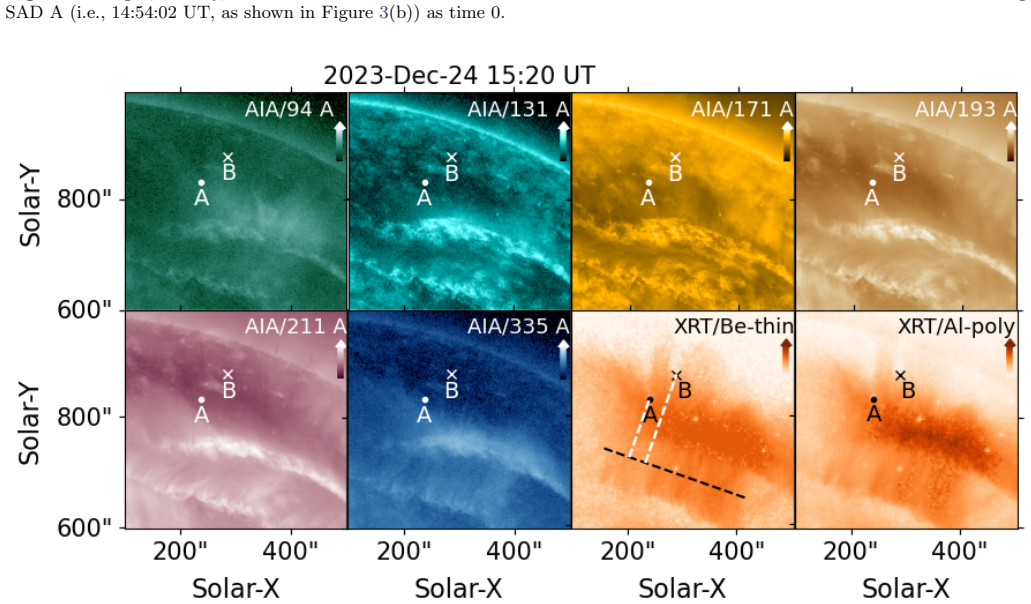
The authors report observations of an extensive supra-arcade fan spanning over 0.85 solar radii above the arcade formed after a giant quiescent filament eruption. Within this fan, the two largest continuously observed supra-arcade downflows (SADs A and B) have velocities within the 20–400 km/s range typical of active-region flare SADs, but the maximum width of SAD A is at least three times the largest width found in a statistical sample of more than 600 active-region SADs. This width–velocity combination matches the nonlinear Rayleigh–Taylor/Richtmyer–Meshkov instability picture: the largest unstable mode scales with system size, while the velocity scale is independent of system size. The fa
Load-bearing premise
The 'at least three times wider' claim depends on a width measured 6 pixels behind a SAD head, multiplied by a visually estimated factor of 'at least two' to obtain the largest width, and compared with an active-region SAD maximum value that is not quoted in this paper; if the visual factor or the comparison value is wrong, the headline scaling result weakens.
Editorial extensions
If this is right
- If the instability scaling holds, wider supra-arcade fans should always host correspondingly wider downflows, so fan width can serve as a predictor for the largest SAD width in any eruption.
- The existence of SADs in a quiet-Sun filament eruption with no GOES flare implies that SAD formation does not require flare-level heating or radiation; reconnection in gradual, cooler eruptions can drive the same downflow phenomenon.
- The cooler, lower-emission-measure fan still shows underdense SADs and compression heating ahead of their heads, suggesting these processes operate even in low-density environments, not just in dense flare loops.
- The maximum initial height of a SAD in this event (214.66 Mm) exceeds the ~200 Mm upper limit in active-region samples, indicating that current EUV instruments' field of view may miss the highest-altitude origins of some SADs.
Reading between the lines
- The paper's headline width ratio relies on a visually estimated 'at least two' factor to convert the 6-pixel-cut width to the largest width; a direct measurement of SAD A's width at its actual widest location, rather than at the standard cut, would provide a harder test of the three-fold claim.
- If system size controls SAD width, then upcoming wide-field EUV or soft-X-ray instruments with larger fields of view should reveal even wider SADs in very extended filament eruptions, a testable prediction of the scaling.
- The similarity of SAD velocities across system sizes, despite order-of-magnitude differences in temperature and emission measure, suggests that the effective gravitational acceleration or reconnection electric field in the current sheet is comparable across these events; simulations varying only the transverse system size could test this.
- The absence of a GOES flare but continued reconnection and downflow activity suggests that flare classification based solely on soft-X-ray flux may overlook a population of gradual, low-emission reconnection events that still participate in energy transfer.
Editorial analysis
A structured set of objections, weighed in public.
Referee Report
Summary. The paper reports Hinode/XRT observations of an extensive supra-arcade fan and two large supra-arcade downflows (SADs) following a giant quiescent solar filament eruption on 2023 December 24. The fan spans roughly 0.85 R_sun, persists for more than eight hours, and contains numerous SADs. The authors measure the heights, plane-of-sky corrected velocities, and widths of the two best-observed SADs (A and B), and derive fan/SAD temperatures and emission measures from XRT filter ratios. Their headline claim is that the largest SAD width is greater than 80 Mm, at least three times the maximum widths of AR-flare SADs in Xie et al. (2022b), while the velocities of these large SADs remain within the typical AR-flare SAD velocity range. They interpret this as support for Rayleigh-Taylor/Richtmyer-Meshkov-type instability models in which the instability length scale grows with system size but the instability velocities do not. They also find a cooler fan (~5 MK), no GOES signature, and cooler SAD plasma relative to the surrounding fan.
Significance. If the width comparison holds, this is an important observational result: it would be one of the first direct indications that SAD dimensions are governed by the global reconnection-scale / fan width, while SAD velocities remain roughly independent of that scale. It would also broaden SAD observations beyond active-region flares and support the idea that quiescent filament eruptions involve reconnection processes similar to those in flares. The paper has clear strengths: off-limb deprojection, PSF deconvolution and saturation handling for XRT, a consistency check with AIA via synthetic images, and an explicit statement of the limitations of the dataset. The central quantitative claim, however, currently rests on a width measured along an empirical 6-pixel cut multiplied by a visual factor, so the scaling conclusion needs to be placed on a firmer measurement basis before it can carry the theoretical weight placed on it.
major comments (3)
- [§3.2, Figure 4(c)] The central claim that the maximum SAD width is >80 Mm and at least three times the AR-flare maximum depends on two unquantified choices: the SAD width is measured along a cut placed 6 pixels from the SAD head (an empirical standard), and the 'largest width' is then estimated by a visual factor of 'at least twice' (green line in Figure 3d). No uncertainty is attached to either step, and no independent measurement is made at the widest part of the SAD. Because the entire RTI/RMI scaling interpretation rests on this number, the authors should provide an objective width measurement (e.g., FWHM along multiple cuts through the SAD, or a reproducible largest-width criterion) with a stated uncertainty or a conservative lower bound. As written, the factor of two could be off by a substantial amount and the ratio to AR SADs is not robustly established.
- [§3.2, comparison with Xie et al. (2022b)] The manuscript states that the largest width is 'more than 3 times the largest widths measured in more than 600 AR flare SADs' but never quotes the comparison value from Xie et al. (2022b), nor states whether those widths were measured with the same 6-pixel/FWHM convention, the same PSF deconvolution, or the same projection treatment. Without that information the reader cannot verify the claimed 3x ratio. Please quote the relevant statistics from Xie et al. (2022b) (maximum, median, and distribution) and explicitly reconcile the width definitions.
- [Section 4] The theoretical interpretation is built on two SADs in a single event. The paper appropriately says in §1 that the dataset is not suitable for a statistical study, but the abstract and conclusions nonetheless state the width/velocity scaling as a general finding. Given that the key measurement is a single visual estimate, I recommend either adding a quantitative treatment that propagates the width uncertainty into the scaling claim or explicitly framing the conclusion as a case study requiring further events.
minor comments (5)
- [Abstract; §3.1] The statement that the fan is 'about three times as wide' as AR-flare fans is not supported by a quantitative comparison or a cited AR-fan width distribution. Please specify how the fan width is defined and what reference value is used.
- [Appendix B] The deprojection assumes the baseline lies on the solar surface and that the Sun is spherical. The resulting heights and velocities could be sensitive to the baseline position. A sensitivity estimate or a range of H and derived velocities for plausible baseline placements would increase confidence; the width comparison itself is not deprojected.
- [Figure 8 caption] Typo: 'adopted form' should likely be 'adopted from'.
- [General] The terms 'de-projection' and 'deprojection' are used inconsistently; please choose one and use it throughout.
- [Appendix C] The consistency test with AIA is qualitative and ignores cross-calibration and pixel-size differences. This is acceptable for the stated purpose, but the wording 'confirms the consistency' should be softened to 'is consistent with'.
Circularity Check
No significant circularity; the observational measurements are independent of the RTI/RMI interpretation, with only minor non-load-bearing self-citations.
full rationale
The paper's central claims are based on direct XRT observations: SAD widths are measured along a defined cut, velocities from tracking SAD heads, and the largest width estimated with a visual factor. No parameter is fitted to force agreement with the RTI/RMI theory. The theory comparison is qualitative and cites both an external result (Alon et al. 1995) and the authors' own simulation (Shen et al. 2022); the simulation is not used to derive the measured quantities, so there is no reduction of a prediction to an input. The comparison to Xie et al. (2022b) relies on a self-citation, but that prior work provides an independent statistical sample of AR-flare SADs; the paper does not quote the comparison maximum, which is a transparency weakness rather than circularity. The 'largest width' estimate uses a visually applied factor of 'at least two' to the 6-pixel width; this is a measurement-uncertainty issue, not a circular derivation. No equation or definition links the output to the input by construction, so no circular step is present.
Assumptions & free parameters
free parameters (3)
- 6-pixel offset =
6 pixels
- largest-width visual factor =
at least 2x measured width
- baseline position for height/deprojection =
central arcade region parallel to ribbons
assumptions (4)
- domain assumption Fan and SADs are viewed through a single dominant temperature plasma (isothermal) for filter-ratio analysis
- domain assumption SAD heads identified visually as low-intensity features moving sunward; the features are genuine plasma voids rather than artifacts of projection/filter
- domain assumption The RTI/RMI model predictions (Shen et al. 2022; Alon et al. 1995) apply to this quiescent-filament fan
- domain assumption Deprojection geometry assumes the baseline lies on the solar surface and the Sun is spherical
Cite this review
Pith. "Pith review of Supra-arcade downflows in an extensive fan associated with a giant quiescent solar filament eruption." pith.science (2026). https://pith.science/paper/TUH2MVJ7
@misc{pith2026250909944,
  author       = {Pith},
  title        = {Pith review of: Supra-arcade downflows in an extensive fan associated with a giant quiescent solar filament eruption},
  year         = {2026},
  howpublished = {\url{https://pith.science/paper/TUH2MVJ7}},
  note         = {Machine review of arXiv:2509.09944}
}
read the original abstract
We investigate the aftermath of a giant quiescent solar filament eruption on December 24, 2023. One feature of the eruption is an extensive fan above the filament channel that is about three times as wide as similar structures that appear above active regions (ARs) during solar flares. The fan contains numerous supra-arcade downflows (SADs), and we investigate the largest SADs with continuous Hinode X-ray Telescope (XRT) observations. The measured maximum width of the SADs in this event is at least three times the maximum width of SADs observed in AR flares, whereas the velocities of the largest SADs are similar to the typical values of AR SADs. The kinetic characteristics of the largest SADs observed in this event align with previous model predictions, where SADs originate from the non-linear development of Rayleigh-Taylor type instabilities. In this scenario, the larger system size allows the existence of larger-scale instabilities, while the development of the velocities of these instabilities is expected to be independent of the system size. Compared to AR flares, the temperature and emission measure in this event are lower, and there is less overall radiation, resulting in no evident Geostationary Operational Environmental Satellite (GOES) signature. Similar to those in AR flares, SADs show lower temperatures compared to the surrounding fan plasma. Our observations show that SADs are present in a wide variety of eruptions. The reconnection mechanisms present in quiescent filament eruptions are similar to those driving more compact eruptions originating from ARs.
Figures


Figures from the paper (8 more)



Reference graph
Works this paper leans on
-
[1]
Afshari, M., Peres, G., Jibben, P. R., et al. 2016, AJ, 152, 107, doi: 10.3847/0004-6256/152/4/107
-
[2]
1995, PhRvL, 74, 534, doi: 10.1103/PhysRevLett.74.534
Alon, U., Hecht, J., Ofer, D., & Shvarts, D. 1995, PhRvL, 74, 534, doi: 10.1103/PhysRevLett.74.534
-
[3]
Anderson, M., & Martin, S. F. 2005, in Astronomical Society of the Pacific Conference Series, Vol. 346, Large-scale Structures and their Role in Solar Activity, ed. K. Sankarasubramanian, M. Penn, & A. Pevtsov, 201
2005
-
[4]
2004, ApJL, 605, L77, doi: 10.1086/420768
Asai, A., Yokoyama, T., Shimojo, M., & Shibata, K. 2004, ApJL, 605, L77, doi: 10.1086/420768
doi:10.1086/420768 2004
-
[5]
2012, SoPh, 275, 41, doi: 10.1007/s11207-011-9804-8
Boerner, P., Edwards, C., Lemen, J., et al. 2012, SoPh, 275, 41, doi: 10.1007/s11207-011-9804-8
-
[6]
Brueckner, G. E., Howard, R. A., Koomen, M. J., et al. 1995, SoPh, 162, 357, doi: 10.1007/BF00733434
-
[7]
Cai, Q., Shen, C., Raymond, J. C., et al. 2019, MNRAS, 489, 3183, doi: 10.1093/mnras/stz2167
-
[8]
2017, A&A, 606, A84, doi: 10.1051/0004-6361/201629893 Del Zanna, G
Chen, X., Liu, R., Deng, N., & Wang, H. 2017, A&A, 606, A84, doi: 10.1051/0004-6361/201629893 Del Zanna, G. 2013, A&A, 558, A73, doi: 10.1051/0004-6361/201321653
Show all 67 references
-
[9]
R., Antiochos, S
DeVore, C. R., Antiochos, S. K., & Aulanier, G. 2005, ApJ, 629, 1122, doi: 10.1086/431721
2005 doi
-
[10]
2018, A&A, 611, A64, doi: 10.1051/0004-6361/201730536 Dud ´ ık, J., Aulanier, G., Kaˇ sparov´ a, J., et al
Diercke, A., Kuckein, C., Verma, M., & Denker, C. 2018, A&A, 611, A64, doi: 10.1051/0004-6361/201730536 Dud ´ ık, J., Aulanier, G., Kaˇ sparov´ a, J., et al. 2022, ApJL, 937, L10, doi: 10.3847/2041-8213/ac8eaf
2018 doi
-
[11]
A., Webb, D
Emery, B. A., Webb, D. F., Gibson, S. E., et al. 2021, SoPh, 296, 119, doi: 10.1007/s11207-021-01857-7
2021 doi
-
[12]
S., & McKenzie, D
Freed, M. S., & McKenzie, D. E. 2018, ApJ, 866, 29, doi: 10.3847/1538-4357/aadee4
2018 doi
-
[13]
Reeves, K. K. 2025, ApJL, 986, L16, doi: 10.3847/2041-8213/adde59
2025 doi
-
[14]
Gibson, S. E. 2018, Living Reviews in Solar Physics, 15, 7, doi: 10.1007/s41116-018-0016-2
2018 doi
-
[15]
2007, SoPh, 243, 63, doi: 10.1007/s11207-007-0182-1
Golub, L., DeLuca, E., Austin, G., et al. 2007, SoPh, 243, 63, doi: 10.1007/s11207-007-0182-1
2007 doi
-
[16]
J., & Reeves, K
Hanneman, W. J., & Reeves, K. K. 2014, ApJ, 786, 95, doi: 10.1088/0004-637X/786/2/95
2014 doi
-
[17]
Hao, Q., Fang, C., Cao, W., & Chen, P. F. 2015, ApJS, 221, 33, doi: 10.1088/0067-0049/221/2/33
2015 doi
-
[18]
J., & Sime, D
Hiei, E., Hundhausen, A. J., & Sime, D. G. 1993, Geophys. Res. Lett., 20, 2785, doi: 10.1029/93GL01449
1993 doi
-
[19]
1985, SoPh, 100, 415, doi: 10.1007/BF00158439
Hirayama, T. 1985, SoPh, 100, 415, doi: 10.1007/BF00158439
1985 doi
-
[20]
Hudson, H., Haisch, B., & Strong, K. T. 1995, J. Geophys. Res., 100, 3473, doi: 10.1029/94JA02710 12Xie et al
1995 doi
-
[21]
E., McKenzie, D
Innes, D. E., McKenzie, D. E., & Wang, T. 2003, SoPh, 217, 247, doi: 10.1023/B:SOLA.0000006899.12788.22
2003
-
[22]
2006, A&A, 449, L17, doi: 10.1051/0004-6361:20064942
Isobe, H., & Tripathi, D. 2006, A&A, 449, L17, doi: 10.1051/0004-6361:20064942
2006 doi
-
[23]
I., Bain, H
Khan, J. I., Bain, H. M., & Fletcher, L. 2007, A&A, 475, 333, doi: 10.1051/0004-6361:20077894
2007 doi
-
[24]
I., Uchida, Y., McAllister, A
Khan, J. I., Uchida, Y., McAllister, A. H., et al. 1998, A&A, 336, 753
1998
-
[25]
2016, A&A, 589, A84, doi: 10.1051/0004-6361/201526636
Kuckein, C., Verma, M., & Denker, C. 2016, A&A, 589, A84, doi: 10.1051/0004-6361/201526636
2016 doi
-
[26]
R., Title, A
Lemen, J. R., Title, A. M., Akin, D. J., et al. 2012, SoPh, 275, 17, doi: 10.1007/s11207-011-9776-8
2012 doi
- [27]
-
[28]
F., Cheng, X., Ding, M
Li, Z. F., Cheng, X., Ding, M. D., et al. 2021, ApJ, 915, 124, doi: 10.3847/1538-4357/ac043e
2021 doi
-
[29]
K., Sui, L., et al
Lin, J., Ko, Y. K., Sui, L., et al. 2005, ApJ, 622, 1251, doi: 10.1086/428110
2005 doi
-
[30]
2021, A&A, 653, A51, doi: 10.1051/0004-6361/202140847
Liu, R., & Wang, Y. 2021, A&A, 653, A51, doi: 10.1051/0004-6361/202140847
2021 doi
-
[31]
2013, ApJ, 767, 168, doi: 10.1088/0004-637X/767/2/168
Liu, W., Chen, Q., & Petrosian, V. 2013, ApJ, 767, 168, doi: 10.1088/0004-637X/767/2/168
2013 doi
-
[32]
H., Karpen, J
Mackay, D. H., Karpen, J. T., Ballester, J. L., Schmieder, B., & Aulanier, G. 2010, SSRv, 151, 333, doi: 10.1007/s11214-010-9628-0
2010 doi
-
[33]
I., Su, Y
McCauley, P. I., Su, Y. N., Schanche, N., et al. 2015, SoPh, 290, 1703, doi: 10.1007/s11207-015-0699-7
2015 doi
-
[34]
McKenzie, D. E. 2000, SoPh, 195, 381, doi: 10.1023/A:1005220604894 —. 2013, ApJ, 766, 39, doi: 10.1088/0004-637X/766/1/39
2000 doi
- [35]
-
[36]
X., Keppens, R., Roussev, I
Mei, Z. X., Keppens, R., Roussev, I. I., & Lin, J. 2017, A&A, 604, L7, doi: 10.1051/0004-6361/201731146 M¨ uller, D., Nicula, B., Felix, S., et al. 2017, A&A, 606, A10, doi: 10.1051/0004-6361/201730893
2017 doi
-
[37]
2011, SoPh, 269, 169, doi: 10.1007/s11207-010-9685-2
Narukage, N., Sakao, T., Kano, R., et al. 2011, SoPh, 269, 169, doi: 10.1007/s11207-010-9685-2
2011 doi
-
[38]
2014, Living Reviews in Solar Physics, 11, 1, doi: 10.12942/lrsp-2014-1
Parenti, S. 2014, Living Reviews in Solar Physics, 11, 1, doi: 10.12942/lrsp-2014-1
2014 doi
- [39]
-
[40]
K., Freed, M
Reeves, K. K., Freed, M. S., McKenzie, D. E., & Savage, S. L. 2017, ApJ, 836, 55, doi: 10.3847/1538-4357/836/1/55
2017 doi
-
[41]
K., & Golub, L
Reeves, K. K., & Golub, L. 2011, ApJL, 727, L52, doi: 10.1088/2041-8205/727/2/L52
2011 doi
-
[42]
K., T¨ or¨ ok, T., Miki´ c, Z., Linker, J., & Murphy, N
Reeves, K. K., T¨ or¨ ok, T., Miki´ c, Z., Linker, J., & Murphy, N. A. 2019, ApJ, 887, 103, doi: 10.3847/1538-4357/ab4ce8
2019 doi
-
[43]
2023, ApJ, 947, 67, doi: 10.3847/1538-4357/ac9b4e
Ruan, W., Yan, L., & Keppens, R. 2023, ApJ, 947, 67, doi: 10.3847/1538-4357/ac9b4e
2023 doi
-
[44]
L., & McKenzie, D
Savage, S. L., & McKenzie, D. E. 2011, ApJ, 730, 98, doi: 10.1088/0004-637X/730/2/98
2011 doi
-
[45]
L., McKenzie, D
Savage, S. L., McKenzie, D. E., & Reeves, K. K. 2012, ApJL, 747, L40, doi: 10.1088/2041-8205/747/2/L40
2012 doi
-
[46]
R., J., & Wang, Y
Sheeley, N. R., J., & Wang, Y. M. 2002, ApJ, 579, 874, doi: 10.1086/342923
2002 doi
-
[47]
K., et al
Shen, C., Chen, B., Reeves, K. K., et al. 2022, Nature Astronomy, 6, 317, doi: 10.1038/s41550-021-01570-2
2022 doi
-
[48]
Shibata, K., Takasao, S., & Reeves, K. K. 2023, ApJ, 943, 106, doi: 10.3847/1538-4357/acaa9c
2023 doi
-
[49]
2015, ApJ, 807, 144, doi: 10.1088/0004-637X/807/2/144
Su, Y., van Ballegooijen, A., McCauley, P., et al. 2015, ApJ, 807, 144, doi: 10.1088/0004-637X/807/2/144
2015 doi
-
[50]
2024, ApJ, 974, 205, doi: 10.3847/1538-4357/ad738d
Sun, Z., Tian, H., Li, T., Liu, R., & Duan, Y. 2024, ApJ, 974, 205, doi: 10.3847/1538-4357/ad738d
2024 doi
-
[51]
2023, MNRAS, 522, 4468, doi: 10.1093/mnras/stad1228 van Ballegooijen, A
Tan, G., Hou, Y., & Tian, H. 2023, MNRAS, 522, 4468, doi: 10.1093/mnras/stad1228 van Ballegooijen, A. A. 2004, ApJ, 612, 519, doi: 10.1086/422512
2023 doi
-
[52]
2024, The Journal of Open Source Software, 9, 6396, doi: 10.21105/joss.06396
Velasquez, J., Murphy, N., Reeves, K., et al. 2024, The Journal of Open Source Software, 9, 6396, doi: 10.21105/joss.06396
2024 doi
-
[53]
P., Brooks, D
Warren, H. P., Brooks, D. H., Ugarte-Urra, I., et al. 2018, ApJ, 854, 122, doi: 10.3847/1538-4357/aaa9b8
2018 doi
-
[54]
P., O’Brien, C
Warren, H. P., O’Brien, C. M., & Sheeley, Neil R., J. 2011, ApJ, 742, 92, doi: 10.1088/0004-637X/742/2/92
2011 doi
-
[55]
E., Golub, L., et al
Weber, M., Deluca, E. E., Golub, L., et al. 2007, PASJ, 59, S853, doi: 10.1093/pasj/59.sp3.S853
2007 doi
-
[56]
J., & Seaton, D
West, M. J., & Seaton, D. B. 2015, ApJL, 801, L6, doi: 10.1088/2041-8205/801/1/L6
2015 doi
-
[57]
K., & Gou, T
Xie, X., Li, G., Reeves, K. K., & Gou, T. 2024, Frontiers in Astronomy and Space Sciences, 11, 1383746, doi: 10.3389/fspas.2024.1383746
2024
-
[58]
2022a, MNRAS, 509, 406, doi: 10.1093/mnras/stab2954
Xie, X., Mei, Z., Shen, C., et al. 2022a, MNRAS, 509, 406, doi: 10.1093/mnras/stab2954
-
[59]
Xie, X., & Reeves, K. K. 2023, ApJ, 942, 28, doi: 10.3847/1538-4357/ac9f47
2023 doi
-
[60]
K., Shen, C., & Ingram, J
Xie, X., Reeves, K. K., Shen, C., & Ingram, J. D. 2022b, ApJ, 933, 15, doi: 10.3847/1538-4357/ac695d
-
[61]
K., et al
Xie, X., Shen, C., Reeves, K. K., et al. 2025, ApJL, 984, L27, doi: 10.3847/2041-8213/adc91b
2025 doi
-
[62]
2018, ApJL, 862, L23, doi: 10.3847/2041-8213/aad40d
Xu, Y., P¨ otzi, W., Zhang, H., et al. 2018, ApJL, 862, L23, doi: 10.3847/2041-8213/aad40d
2018 doi
-
[63]
2020, ApJ, 898, 88, doi: 10.3847/1538-4357/ab9a3d
Xue, J., Su, Y., Li, H., & Zhao, X. 2020, ApJ, 898, 88, doi: 10.3847/1538-4357/ab9a3d
2020 doi
-
[64]
T., Shiota, D., Sakajiri, T., et al
Yamamoto, T. T., Shiota, D., Sakajiri, T., et al. 2002, ApJL, 579, L45, doi: 10.1086/345076
2002 doi
-
[65]
C., Mei, Z., et al
Ye, J., Raymond, J. C., Mei, Z., et al. 2023, ApJ, 955, 88, doi: 10.3847/1538-4357/acf129 SADs in an extensive fan13
2023 doi
-
[66]
2006, Advances in Space Research, 38, 466, doi: 10.1016/j.asr.2005.03.110
Zhou, G., Wang, Y., & Wang, J. 2006, Advances in Space Research, 38, 466, doi: 10.1016/j.asr.2005.03.110
2006 doi
-
[67]
2019, ApJ, 884, 157, doi: 10.3847/1538-4357/ab4355
Zou, P., Jiang, C., Wei, F., Zuo, P., & Wang, Y. 2019, ApJ, 884, 157, doi: 10.3847/1538-4357/ab4355
2019 doi
Reviewed August 4, 2026 · model on record in the stance chip above.
Discussion (0). Sign in to comment.